. 2021 Dec;54(12):e13142.
doi: 10.1111/cpr.13142. Epub 2021 Oct 11.

CoCrMo-Nanoparticles induced peri-implant osteolysis by promoting osteoblast ferroptosis via regulating Nrf2-ARE signalling pathway

Affiliations

CoCrMo-Nanoparticles induced peri-implant osteolysis by promoting osteoblast ferroptosis via regulating Nrf2-ARE signalling pathway

Yiming Xu et al. Cell Prolif. 2021 Dec.

Abstract

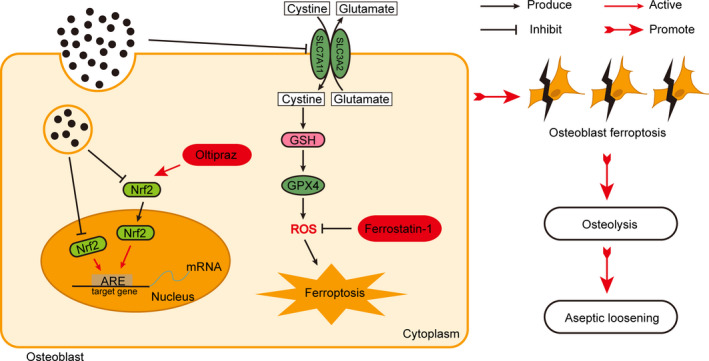
Objectives: Aseptic loosening (AL) is the most common reason of total hip arthroplasty (THA) failure and revision surgery. Osteolysis, caused by wear particles released from implant surfaces, has a vital role in AL. Although previous studies suggest that wear particles always lead to osteoblast programmed death in the process of AL, the specific mechanism remains incompletely understood and osteoblast ferroptosis maybe a new mechanism of AL.

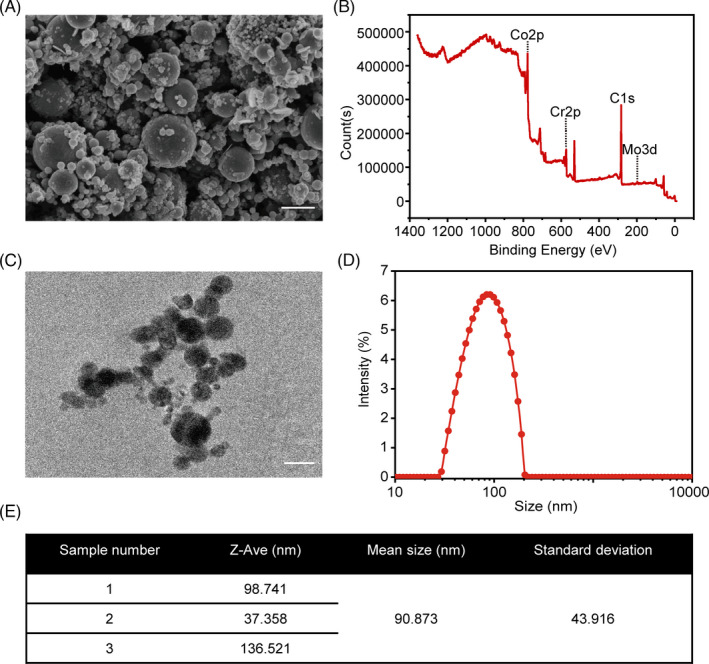
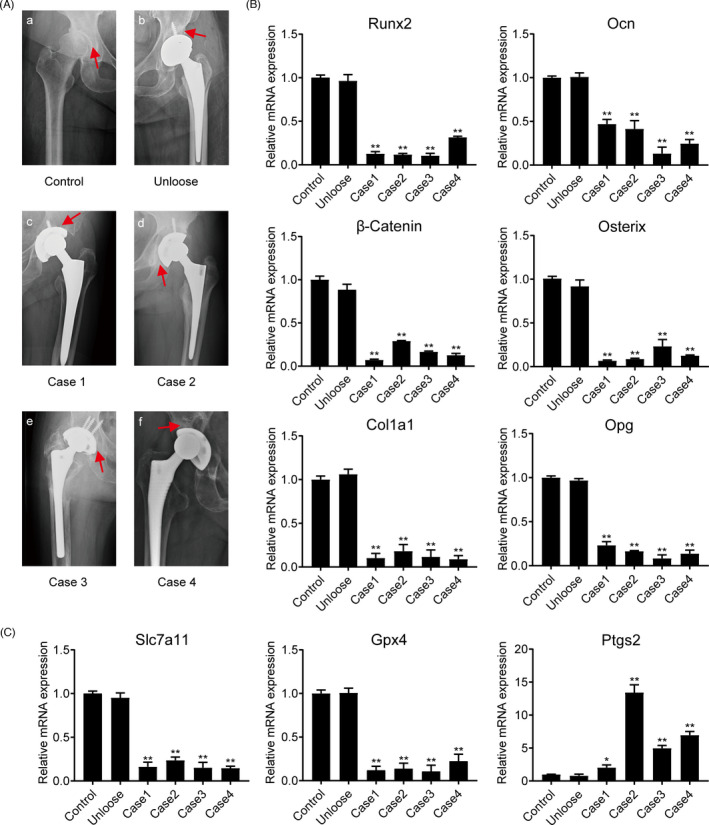
Materials and methods: CoCrMo nanoparticles (CoNPs) were prepared to investigate the influence of ferroptosis in osteoblasts and calvaria resorption animal models. Periprosthetic osteolytic bone tissue was collected from patients who underwent AL after THA to verify osteoblast ferroptosis.

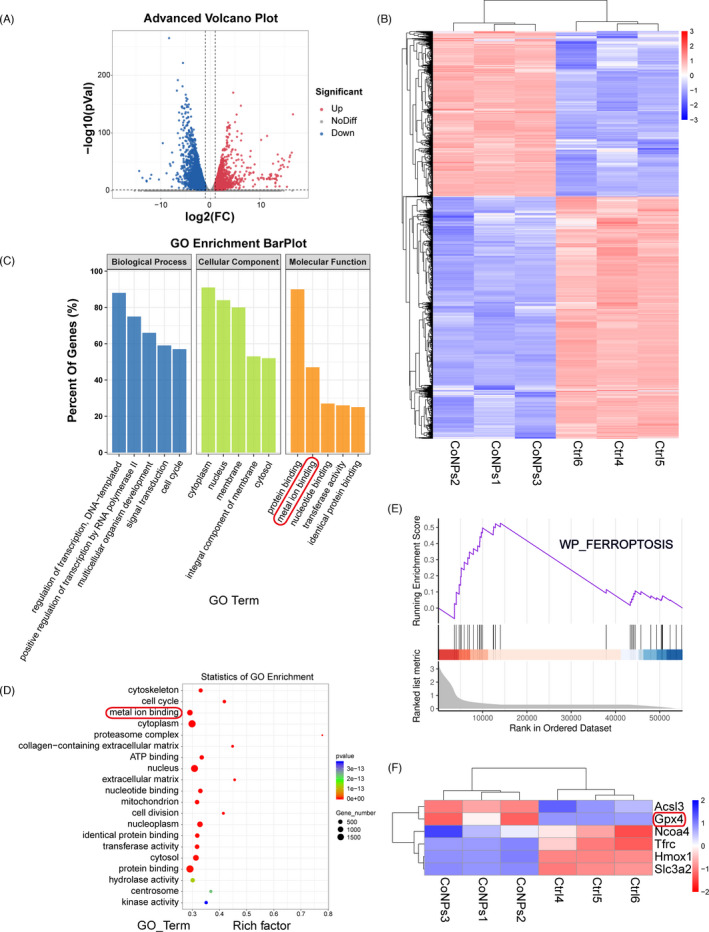
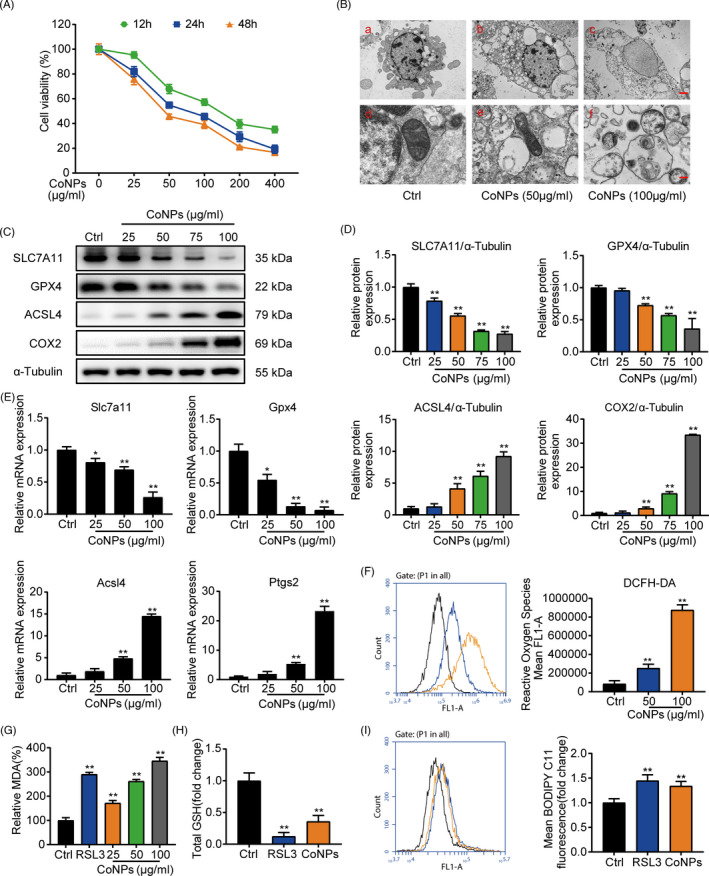
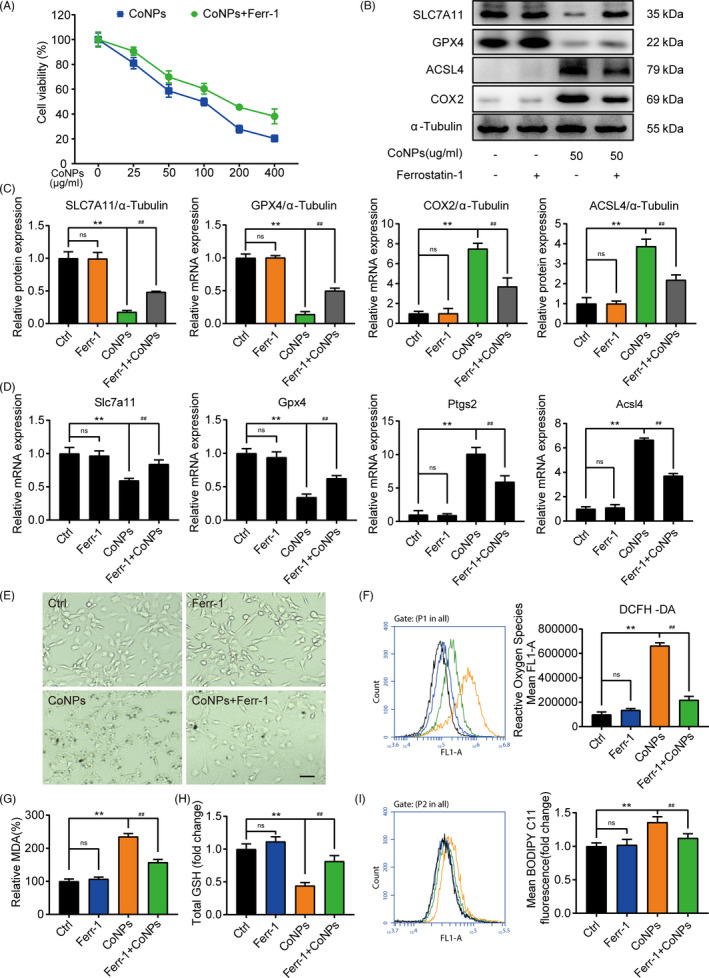
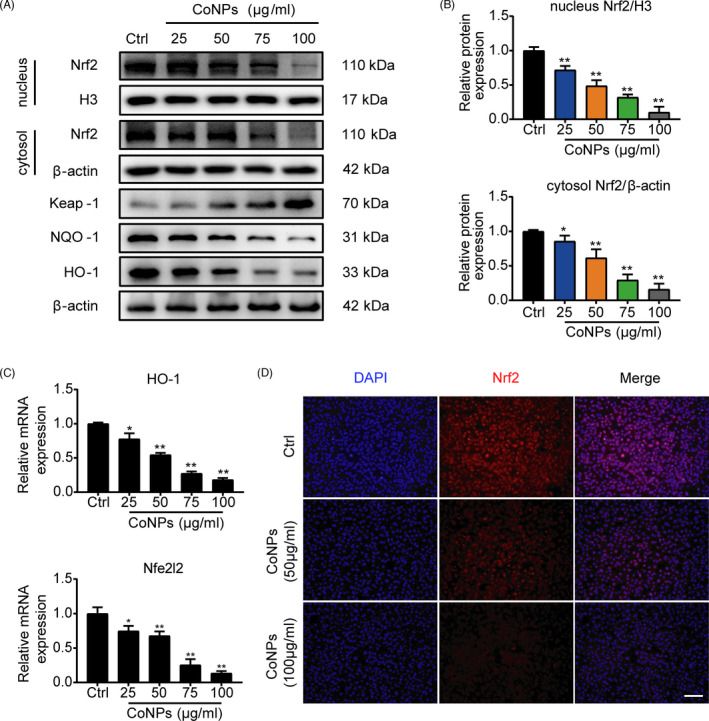
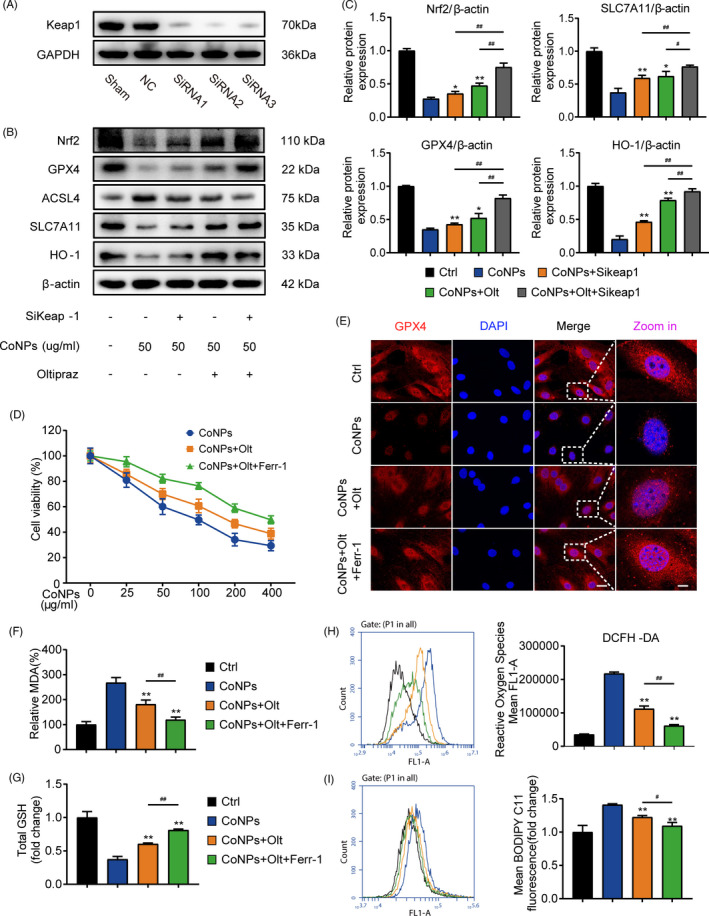
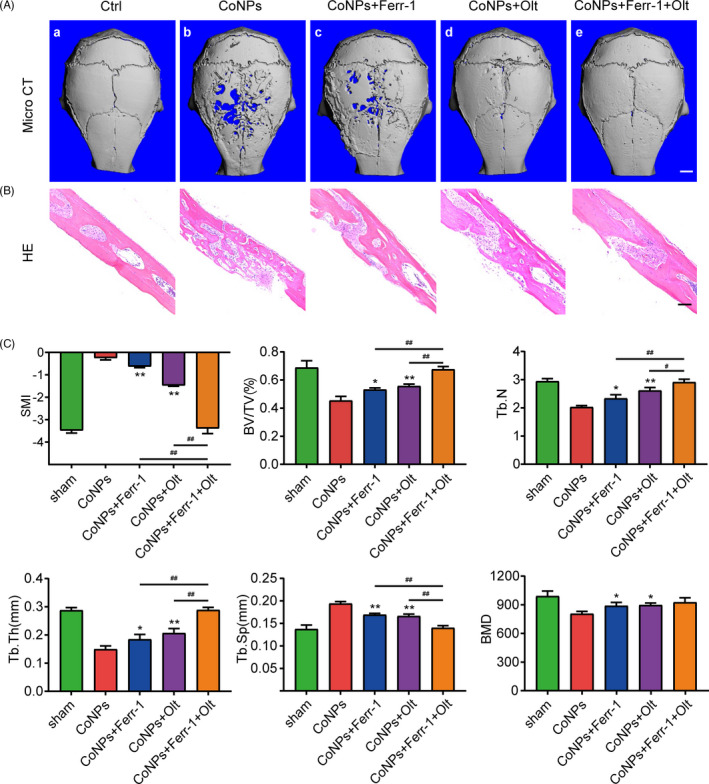
Results: Our study demonstrated that CoNPs induced significant ferroptosis in osteoblasts and particles induced osteolysis (PIO) animal models. Blocking ferroptosis with specific inhibitor Ferrostatin-1 dramatically reduced particle-induced ferroptosis in vitro. Moreover, in osteoblasts, CoNPs significantly downregulated the expression of Nrf2 (nuclear factor erythroid 2-related factor 2), a core element in the antioxidant response. The overexpression of Nrf2 by siKeap1 or Nrf2 activator Oltipraz obviously upregulated antioxidant response elements (AREs) and suppressed ferroptosis in osteoblasts. Furthermore, in PIO animal models, the combined utilization of Ferrostatin-1 and Oltipraz dramatically ameliorated ferroptosis and the severity of osteolysis.

Conclusions: These results indicate that CoNPs promote osteoblast ferroptosis by regulating the Nrf2-ARE signalling pathway, which suggests a new mechanism underlying PIO and represents a potential therapeutic approach for AL.


Conflict of interest statement

The authors declare no conflicts of interest for this work.

Figures

FIGURE 1
FIGURE 1
Physical characteristics of CoCrMo nanoparticles. (A) Scanning electron microscopy (SEM) image of CoNPs. Scale bar: 100 nm. (B) Chemical composition of CoNPs, using X‐ray photoelectron spectroscopy (XPS). (C) Transmission electron microscopy (TEM) image of CoNPs. Scale bar: 100 nm. (D) The size distribution of CoNPs, and (E) their mean size
FIGURE 2
FIGURE 2
RNA‐seq analysis revealed that CoNPs downregulated GPX4 expression in MC3T3‐E1 cells, which correlates with ferroptosis. (A) Volcano plot reveals 2358 upregulated genes and 3458 downregulated genes in MC3T3‐E1 cells after CoNPs (50 μg/ml) stimulations for 12 h. (B) Heat map and cluster analysis. (C, D) Significant pathway of GO Enrichment analysis in which metal ion binding enriched significantly. (E) Enrichment plot of Ferroptosis gene sets which were importantly differentiated between the control group and CoNPs group. (F) Heat map and cluster analysis between Ferroptosis gene sets and differential genes in which ferroptosis core regulator GPX4 decreased significantly
FIGURE 3
FIGURE 3
Preoperative examination of x‐rays from patients with aseptic loosening and the analysis of related mRNA expression in peri‐implant bone tissue of patients. (A) Preoperative radiographs of patients with aseptic loosening. The red arrow represents the site from where we collected the specimens. Control: developmental dysplasia of the hip required THA. Unloose: unloose specimens; Case1‐4: loose specimens. (B) The mRNA expression of osteogenic marker genes Runx2, Ocn, β‐Catenin, Osterix, Col1a1, and Opg in bone tissue of these patients. (C) The mRNA expression of ferroptosis‐related genes, Gpx4, Slc7a11, and Ptgs2, in bone tissue from these patients. Data represent mean ± SD of triplicate independent experiments. *, # indicates p < 0.05, **, ## indicates p < 0.01, ns indicates not significant
FIGURE 4
FIGURE 4
CoNPs‐induced osteoblasts ferroptosis in vitro. (A) Effect of gradient concentrations (0, 25, 50, 100, 200, 400 μg/ml) of CoNPs on the osteoblast survival was observed by CCK‐8. (B) Transmission electron microscopy of osteoblasts after treatment with gradient concentrations of CoNPs for 24 h. Scale bar: 20 μm (upper) and 2 μm (lower). (C) Western blots performed after MC3T3‐E1 cells were treated with CoNPs for 24 h (n = 3). (D) ImageJ software was used to quantify the density of the western blot bands shown in (C). (E) Relative mRNA expression of Gpx4, Slc7a11, Acsl4, and Ptgs2 in each group. (F) ROS generation was detected by flow cytometry with DCFH‐DA (10 mM) in each group. (G) Lipid peroxide MDA level in each group. (H) The GSH level in each group. (I) Cell lipid peroxidation was detected by BODIPY 581/591 C11 staining using flow cytometry in each group. *, # indicates p < 0.05, **, ## indicates p < 0.01, ns indicates not significant
FIGURE 5
FIGURE 5
Ferrostatin‐1 protected osteoblasts against ferroptosis induced by CoNPs in vitro. (A) Osteoblasts were treated with ferrostatin‐1 (1 μM/ml) for 12 h before treatment with CoNPs for 24 h. Cell viability was observed by CCK‐8. (B) Western blots performed after osteoblasts being stimulated with indicated treatment. (C) The quantification of the western blot bands shown in (B). (D) Relative mRNA expression in each group. (E) Light microscopic changes of MC3T3‐E1 cells in each group. Scale bar: 100 μm. (F) ROS generation was demonstrated by flow cytometry with DCFH‐DA (10 mM) in each group. (G) Lipid peroxide MDA level in each group. (H) The GSH level in each group. (I) Cell lipid peroxidation was detected by BODIPY 581/591 C11 staining in each group. *, # indicates p < 0.05, **, ## indicates p < 0.01, ns indicates not significant
FIGURE 6
FIGURE 6
CoNPs downregulated the expression of Nrf2 in vitro. (A) Western blots performed after osteoblasts were treated with gradient concentrations (0, 25, 50, 75, 100 μg/ml) of CoNPs for 24 h (n = 3). (B) The quantification of the western blot bands shown in (A). (C) Relative mRNA expression of Nfe2l2 and HO‐1 in each group. (D) Immunofluorescence staining of Nrf2 in MC3T3‐E1 cells treated with CoNPs (50 μg/ml). Scale bar: 100 μm. Data represent means ± SD of triplicate independent experiments. *, # represent p < 0.05, **, ## represent p < 0.01
FIGURE 7
FIGURE 7
Oltipraz suppresses ferroptosis via activation of the Nrf2‐ARE signalling pathway. (A) Western blots performed after cells were incubated with sham, siControl, and siKeap1. (B) Western blots performed after MC3T3‐E1 cells were incubated with indicated treatment. (C) The quantification of the western blot bands shown in (B). (D) Cell survival was determined by CCK‐8. (E) Immunofluorescence of GPX4 expression in MC3T3‐E1 treated with PBS (Control), CoNPs, CoNPs + Olt, and CoNPs + Olt + Ferr‐1. Scale bar: 20 μm (before Zoom in); 2 μm (after Zoom in). (F) The lipid peroxide MDA level in each group. (G) The GSH level in each group. (H) ROS generation was demonstrated by flow cytometry with DCFH‐DA (10 mM) in each group. (I) Cell lipid peroxidation was detected by BODIPY 581/591 C11 staining in each group. *, # indicates p < 0.05, **, ## indicates p < 0.01, ns indicates not significant
FIGURE 8
FIGURE 8
Oltipraz and Ferrostatin‐1 attenuated CoNPs‐induced osteolysis in vivo. (A) 3‐Dimensinal reconstruction micro‐CT images from the outside of the calvaria after treatment. (a–e, representing the sham group, CoNPs group, CoNPs + Ferrostatin‐1 treatment group, CoNPs + Oltipraz treatment, and CoNPs + Ferrostatin‐1 + Oltipraz treatment group, respectively). Scale bar, 2 mm. (B) HE staining of calvaria of the five groups, Scale bar, 50 μm. (C) Quantification of SMI, BV/TV, BMD, Tb. Th, Tb. Sp, Tb.N. Data represent means ± SD of triplicate independent experiments. *, # represent p < 0.05, **, ## represent p < 0.01. *, ** vs. CoNPs; #, ## vs. CoNPs + Ferr‐1 + Olt; ns represents not significant
FIGURE 9
FIGURE 9
The schematic illustration of CoCrMo‐Nanoparticles induced peri‐implant osteolysis by promoting osteoblast ferroptosis via regulating Nrf2‐ARE signalling pathway

References

    1. Sheth NP, Rozell JC, Paprosky WG. Evaluation and treatment of patients with acetabular osteolysis after total hip arthroplasty. J Am Acad Orthop Surg. 2019;27(6):e258‐e267. - PubMed
    1. Pivec R, Johnson AJ, Mears SC, Mont MA. Hip arthroplasty. Lancet. 2012;380(9855):1768‐1777. - PubMed
    1. Rames RD, Hillen TJ, Pashos GE, Maloney WJ, Clohisy JC. Incidence and characteristics of osteolysis in HXLPE THA at 16‐year follow up in patients 50 years and less. J Arthroplasty. 2021;36(2):641‐646. - PubMed
    1. Hopper RH Jr, Ho H, Sritulanondha S, Williams AC, Engh CA Jr. Otto aufranc award: crosslinking reduces THA wear, osteolysis, and revision rates at 15‐year followup compared with noncrosslinked polyethylene. Clin Orthop Relat Res. 2018;476(2):279‐290. - PMC - PubMed
    1. Goodman SB, Ma T. Cellular chemotaxis induced by wear particles from joint replacements. Biomaterials. 2010;31(19):5045‐5050. - PMC - PubMed