

CCG•CGG interruptions in high-penetrance SCA8 families increase RAN translation and protein toxicity
- PMID: 34632710
- PMCID: PMC8573593
- DOI: 10.15252/emmm.202114095
CCG•CGG interruptions in high-penetrance SCA8 families increase RAN translation and protein toxicity
Abstract
Spinocerebellar ataxia type 8 (SCA8), a dominantly inherited neurodegenerative disorder caused by a CTG•CAG expansion, is unusual because most individuals that carry the mutation do not develop ataxia. To understand the variable penetrance of SCA8, we studied the molecular differences between highly penetrant families and more common sporadic cases (82%) using a large cohort of SCA8 families (n = 77). We show that repeat expansion mutations from individuals with multiple affected family members have CCG•CGG interruptions at a higher frequency than sporadic SCA8 cases and that the number of CCG•CGG interruptions correlates with age at onset. At the molecular level, CCG•CGG interruptions increase RNA hairpin stability, and in cell culture experiments, increase p-eIF2α and polyAla and polySer RAN protein levels. Additionally, CCG•CGG interruptions, which encode arginine interruptions in the polyGln frame, increase toxicity of the resulting proteins. In summary, SCA8 CCG•CGG interruptions increase polyAla and polySer RAN protein levels, polyGln protein toxicity, and disease penetrance and provide novel insight into the molecular differences between SCA8 families with high vs. low disease penetrance.
Keywords: RAN translation; cis-modifier; reduced penetrance; sequence interruptions; spinocerebellar ataxia type 8.
© 2021 The Authors. Published under the terms of the CC BY 4.0 license.
Conflict of interest statement
Tao Zu and Laura Ranum are inventors on patents and pending patents on RAN translation and/or SCA8.
Figures

- A
Summary of disease history in the 77 SCA8 families in our cohort.
- B
No correlation between length of combined repeats and age of onset in SCA8 patients, n = 85, P = 0.9847 or in the subset of SCA8 patients with CCG•CGG interruptions (Int.), n = 26, P = 0.2096, linear regression analyses. Open circles indicate SCA8 patients with pure CAG repeat expansions. Red squares show average expansion size for individuals with two expanded alleles, individual allele repeat lengths: 137/177,110/320, 104/130, 96/109. Red triangles show average expansion size for individuals with two expanded alleles and CCG•CGG interruptions: 84/114, 92/100. Gray triangles indicate individuals with CCG•CGG interruptions.
- C
Allele length distribution of affected (n = 111) and asymptomatic (n = 88) expansion carriers; box: 25th to 75th percentile; whiskers: minimum to maximum value; P = 0.0672, Mann–Whitney test.
- D–H
SCA8 family pedigrees: Squares represent males, circles represent females, and diamonds mask gender. Filled symbols represent affected individuals, symbols with dot represent asymptomatic expansion carriers, open symbols represent individuals with non‐expanded alleles, and diagonal line indicates a deceased individual. Combined repeat number, age (y—years) at onset (Onset) or age still asymptomatic, and interruption status (Pure or Int. [CCG•CGG‐interrupted]) are noted below the symbols. (G) Abbreviated pedigree, for additional details, see Koob et al (1999).
- I
SCA8 allele configurations in the CAG direction as determined by sequencing. Family or individual and affected status indicated on left: Sporadic 1—Fig 1F indicated by #, Family 1—Fig 1G, Family 2—Fig 1H; A—affected, AS—Asymptomatic; CGG interruptions represented by black boxes. Sequences used in Fig 5C are indicated by *. See Appendix Table S1 for allele configurations.
- J
Age of onset correlates with the number of CCG•CGG interruptions, n = 24, P = 0.0016, linear regression analyses. Gray triangles indicate individuals with CCG•CGG interruptions. Red triangles indicate the average expansion size for individuals with two expanded alleles and CCG•CGG interruptions, and individual allele repeat lengths are as follows: 84/114, 92/100.


- A
Schematic diagram of constructs used to express patient‐derived pure and interrupted SCA8 repeat tracts with predicted protein products and C‐terminal epitope tags. * Due to TAG encoded stop codons, polyGln proteins do not express an epitope tag. CGG interruptions and the encoded amino acid interruptions are indicated in red.
- B, C
Cell death measured by lactase dehydrogenase (LDH) (B) and cell viability measured by 3‐(4,5‐dimethyl‐thiazol‐. 2‐yl)‐2,5‐diphenyl tetrazolium bromide (MTT) (C) in T98 cells 42 hrs post‐transfection of pure and interrupted SCA8 repeat tracts; LDH n = 8, MTT n = 12, n = independent experiments, * P < 0.05, NT: not transfected, EV: empty vector; unpaired t‐test; mean ± SEM.
- D, E
RT–qPCR showing transcript levels of Pure 96 and Int.95 (D, n = 6; P = 0.0187), and Pure 104 and Int.102 (E, n = 6; **** P < 0.0001) repeats; n = independent experiments; unpaired t‐test; mean ± SEM.

- A
Alternative‐codon constructs for pure and interrupted polyGln assays.
- B, C
Cell death (B; LDH, n = 8) and viability (C; MTT, n = 6) assays in T98 cells 42 h post‐transfection. NT: not transfected; EV: empty vector; n = independent experiments; * P < 0.05; unpaired t‐test; mean ± SEM.
- D
RT–qPCR of Alt. polyGln and Alt. Int. polyGln construct transcript levels, n = 3 independent experiments; P = 0.9516, ns: not significant, unpaired t‐test, mean ± SEM.
- E–G
Protein blots (E) and quantification (F, G) of polyGln proteins expressed in transfected HEK293T cells with interrupted or pure polyGln repeats; EV: empty vector; n = 3 transfections, ** P < 0.01, *** P < 0.001, unpaired t‐test, mean ± SD.
- H
Immunofluorescence of polyGln expressed from Pure 104 and Int.102 constructs in HEK293T cells; scale bar: 20 μm; EV: empty vector.
- I, J
Immunofluorescence (I) and quantification (J) of intranuclear inclusions for polyGln expressed from Alt. polyGln and Alt. Int. polyGln constructs in HEK293T cells; scale bar: 50 μm; green arrowheads indicate cells positive for Alt. Int. polyGln intranuclear inclusions; dashed white box in merge panels indicates the region shown in the orthogonal (Ortho) zoomed images which show cross section and localization of diffuse polyGln staining and nuclear polyGln(Arg) inclusions with alpha‐tubulin as a cytoplasmic marker; n = 4 experiments with n > 55 cells per experiment, *P < 0.05, ****P < 0.0001, two‐way ANOVA, data presented as mean percentage of polyGln‐positive cells ± SD.
- K
PolyGln(Arg) proteins but not pure polyGln proteins colocalize with nucleophosmin in HEK293T cells; scale bars: 20 µm; dashed white box in merge panels indicates the region shown as an orthogonal projection in the Ortho zoom panels which show the co‐localization of polyGln inclusions and nucleophosmin in three dimensions.

- A
Protein blots of transfected HEK293T lysates show polyGln proteins expressed from constructs with interrupted or pure CAA repeat tracts; red arrows indicate pure polyGln and polyGln(Arg) proteins. * The low levels of recombinant protein expressed for toxicity studies allow for polyGln containing TATA‐binding protein to be detected by 1C2 antibody giving a background band at ~ 40 kDa.
- B
Constructs used to express pure and interrupted HA‐tagged polyGln proteins.
- C–E
Protein blot (C) and quantification (D, E) of insoluble protein fraction to detect polyGln proteins by HA epitope tag; EV: empty vector n = 3 transfections, ns: not significant, unpaired t‐test, mean ± SEM.
- F
PolyGln(Arg) proteins but not pure polyGln proteins colocalize with nucleophosmin in HeLa cells; scale bars: 20 µm.

- A–C
Protein blotting (A) and quantification (B, C) of polySer RAN proteins in HEK293T cells from interrupted (Int.95; Int.102) or pure (Pure 96; Pure 104) CAG repeats. EV: empty vector, n = 3 transfections, **P < 0.01, *P < 0.05, unpaired t‐test, mean ± SEM.
- D, E
Immunofluorescence (D) and quantification (E) of RAN polySer protein aggregates from CGG‐interrupted and pure CAG repeat tracts in HEK293T cells; scale bar: 10 μm. n > 20 cells per construct for each experiment (Exp.), **P < 0.01: Exp.1 P = 0.0073, Exp.2 P = 0.0017, Exp.3 P = 0.0041, Mann–Whitney test; data presented as individual points with median.
- F, G
Protein blot (F) and quantification (G) of polyAla RAN proteins expressed from pure or interrupted constructs; n = 3 transfections, ***P < 0.001, unpaired t‐test, mean ± SD.
- H
RT–qPCR of Pure 96 and Int.95 transcript levels; n = 3 transfections; P = 0.9942, unpaired t‐test, mean ± SEM.
- I, J
Protein blotting (I) and quantification (J) of phospho‐eIF2α (p‐eIF2α) relative to total eIF2α; n = 4 transfections, *P < 0.05, unpaired t‐test, mean ± SD.
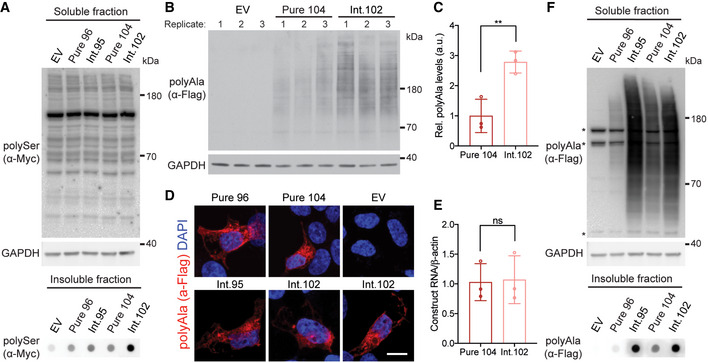
- A
Protein blot of soluble and dot blot of insoluble protein fractions for RAN polySer demonstrating that polySer RAN proteins are detectable in the insoluble fraction by dot blot but not the soluble fraction, as no signal above background is found in the soluble fractions; EV: empty vector.
- B, C
Protein blot (B) and quantification (C) of polyAla RAN proteins in HEK293T cells expressed from interrupted (Int.102) and pure (Pure 104) CAG repeat tracts; EV: empty vector; n = 3 transfections, **P < 0.01, unpaired t‐test, mean ± SD.
- D
Immunofluorescence of RAN polyAla proteins in HEK293T cells; scale bar 10 μm.
- E
RT–qPCR of transcripts expressed from Pure 104 and Int.102 constructs; n = 3 transfections; ns: not significant, unpaired t‐test, mean ± SEM.
- F
Protein blots of soluble and dot blots of insoluble RAN polyAla proteins expressed from interrupted alleles show increased levels of both soluble and insoluble RAN polyAla compared with those expressed from uninterrupted repeats; * indicates background bands; EV: empty vector.

Absorbance of each RNA substrate at 260 nm monitored between 25 and 95°C, recorded at 1°C intervals; n = 3 UV melting curves per RNA substrate (technical replicates), mean ± SD.
The m‐fold (Zuker, 2003) predicted folding free energy (ΔG) of hairpin structures of pure CAG and CGG‐interrupted repeat tracts with different configurations. Filled symbols show sequences also used for UV melting analyses. Gray dotted line indicates ΔG of pure (CAG)8.
The folding free energy (ΔG) of interrupted hairpin structures of repeat expansions found in SCA8 patients (Fig 1I) and pure repeat tracts of the same length, as predicted by m‐fold. Patient‐derived alleles are as follows: Sporadic 5–48 repeats in length—(CAG)7(CGGCAG)18(CAG)5; Family 7 A‐1–53 repeats in length—(CAG)8(CGGCAG)14(CAG)2CGG(CAG)5CGG(CAG)8; and Family 7 A‐2–52 repeats in length—(CAG)7(CGGCAG)16(CAG)4CGG(CAG)8. Each symbol represents a single predicted hairpin structure; multiple hairpin structures, including branched hairpins, are predicted for each SCA8 patient allele and for pure (CAG)53 (Zuker, 2003). Black dotted line shows ΔG = 0.


- A, B
Predicted RNA hairpin structures from m‐fold (Zuker, 2003) for pure and CGG‐interrupted CAG repeat tracts for Fig 5B (A) and Fig 5C (B). Red lines alongside the structures indicate positions of CGG interruptions. (B) Pure structures are shown in gray; for repeat tracts with multiple predicted hairpin structures, only the most stable structure is shown.
Similar articles
-
SCA8 RAN polySer protein preferentially accumulates in white matter regions and is regulated by eIF3F.EMBO J. 2018 Oct 1;37(19):e99023. doi: 10.15252/embj.201899023. Epub 2018 Sep 11. EMBO J. 2018. PMID: 30206144 Free PMC article.
-
SCA8 CTG repeat: en masse contractions in sperm and intergenerational sequence changes may play a role in reduced penetrance.Hum Mol Genet. 2000 Sep 1;9(14):2125-30. doi: 10.1093/hmg/9.14.2125. Hum Mol Genet. 2000. PMID: 10958651
-
Bidirectional expression of the SCA8 expansion mutation: one mutation, two genes.Cerebellum. 2008;7(2):150-8. doi: 10.1007/s12311-008-0010-7. Cerebellum. 2008. PMID: 18418692
-
Molecular genetics of spinocerebellar ataxia type 8 (SCA8).Cytogenet Genome Res. 2003;100(1-4):175-83. doi: 10.1159/000072852. Cytogenet Genome Res. 2003. PMID: 14526178 Review.
-
Friedreich Ataxia.1998 Dec 18 [updated 2025 Jun 26]. In: Adam MP, Feldman J, Mirzaa GM, Pagon RA, Wallace SE, Amemiya A, editors. GeneReviews® [Internet]. Seattle (WA): University of Washington, Seattle; 1993–2025. 1998 Dec 18 [updated 2025 Jun 26]. In: Adam MP, Feldman J, Mirzaa GM, Pagon RA, Wallace SE, Amemiya A, editors. GeneReviews® [Internet]. Seattle (WA): University of Washington, Seattle; 1993–2025. PMID: 20301458 Free Books & Documents. Review.
Cited by
-
Partners in crime: Proteins implicated in RNA repeat expansion diseases.Wiley Interdiscip Rev RNA. 2022 Jul;13(4):e1709. doi: 10.1002/wrna.1709. Epub 2022 Feb 28. Wiley Interdiscip Rev RNA. 2022. PMID: 35229468 Free PMC article. Review.
-
Rapid and comprehensive diagnostic method for repeat expansion diseases using nanopore sequencing.NPJ Genom Med. 2022 Oct 26;7(1):62. doi: 10.1038/s41525-022-00331-y. NPJ Genom Med. 2022. PMID: 36289212 Free PMC article.
-
CASP8 intronic expansion identified by poly-glycine-arginine pathology increases Alzheimer's disease risk.Proc Natl Acad Sci U S A. 2025 Feb 18;122(7):e2416885122. doi: 10.1073/pnas.2416885122. Epub 2025 Feb 12. Proc Natl Acad Sci U S A. 2025. PMID: 39937857 Free PMC article.
-
Incomplete Penetrance and Variable Expressivity: From Clinical Studies to Population Cohorts.Front Genet. 2022 Jul 25;13:920390. doi: 10.3389/fgene.2022.920390. eCollection 2022. Front Genet. 2022. PMID: 35983412 Free PMC article. Review.
-
Molecular and Clinical Implications of Variant Repeats in Myotonic Dystrophy Type 1.Int J Mol Sci. 2021 Dec 29;23(1):354. doi: 10.3390/ijms23010354. Int J Mol Sci. 2021. PMID: 35008780 Free PMC article. Review.
References
-
- Braida C, Stefanatos RKA, Adam B, Mahajan N, Smeets HJM, Niel F, Goizet C, Arveiler B, Koenig M, Lagier‐Tourenne C et al (2010) Variant CCG and GGC repeats within the CTG expansion dramatically modify mutational dynamics and likely contribute toward unusual symptoms in some myotonic dystrophy type 1 patients. Hum Mol Genet 19: 1399–1412 - PubMed
Publication types
MeSH terms
Substances
Grants and funding
LinkOut - more resources
Full Text Sources
Other Literature Sources
Miscellaneous
