

Comparative transcriptomic analysis of THP-1-derived macrophages infected with Mycobacterium tuberculosis H37Rv, H37Ra and BCG
- PMID: 34632719
- PMCID: PMC8581329
- DOI: 10.1111/jcmm.16980
Comparative transcriptomic analysis of THP-1-derived macrophages infected with Mycobacterium tuberculosis H37Rv, H37Ra and BCG
Abstract
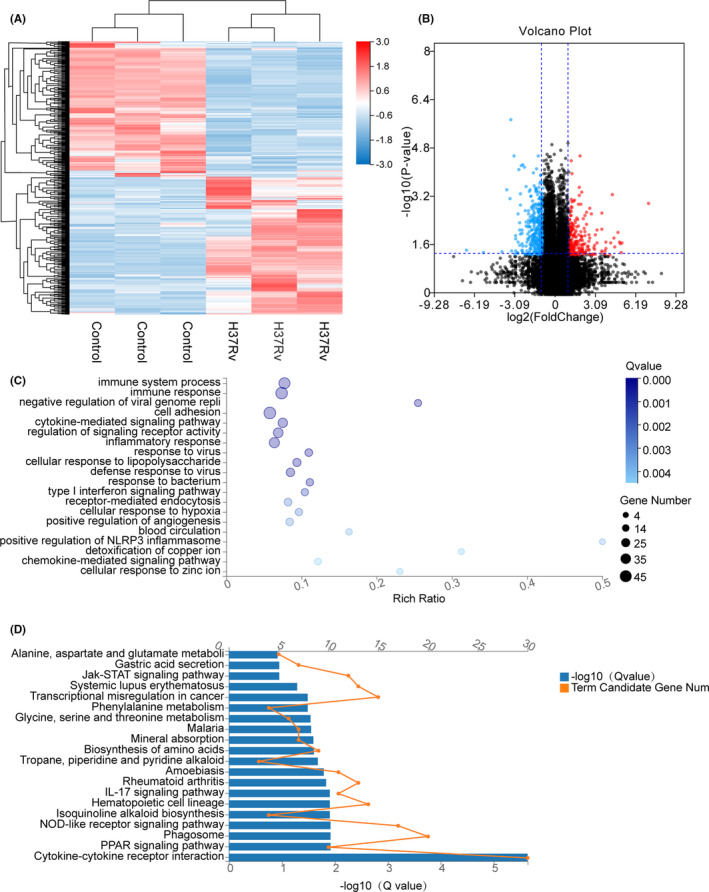
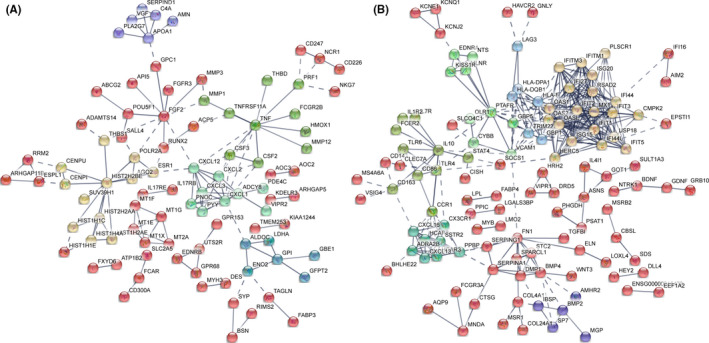
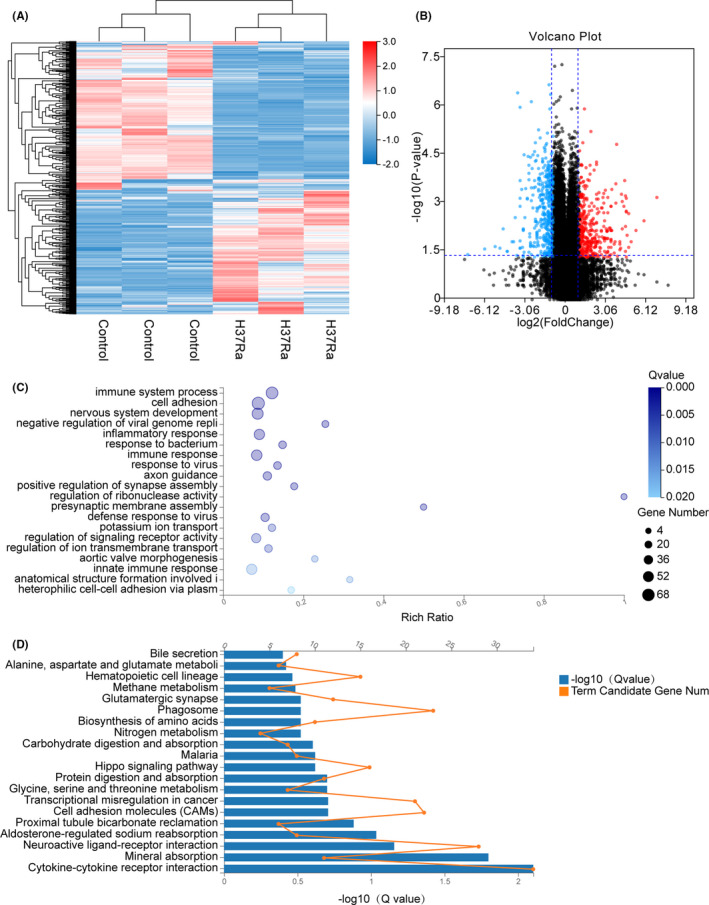
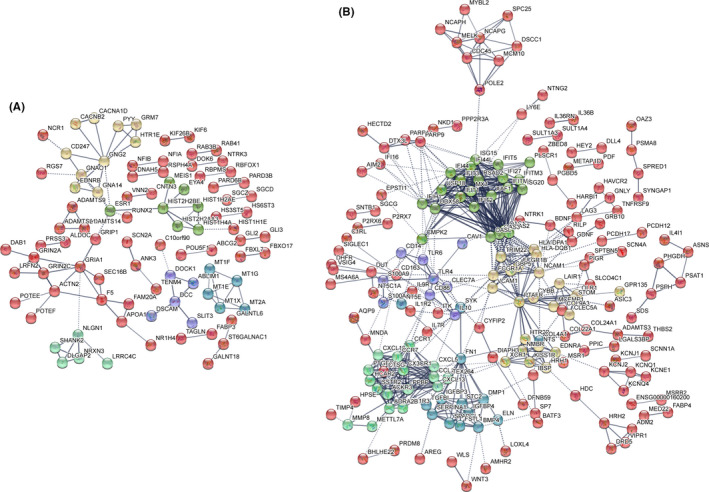
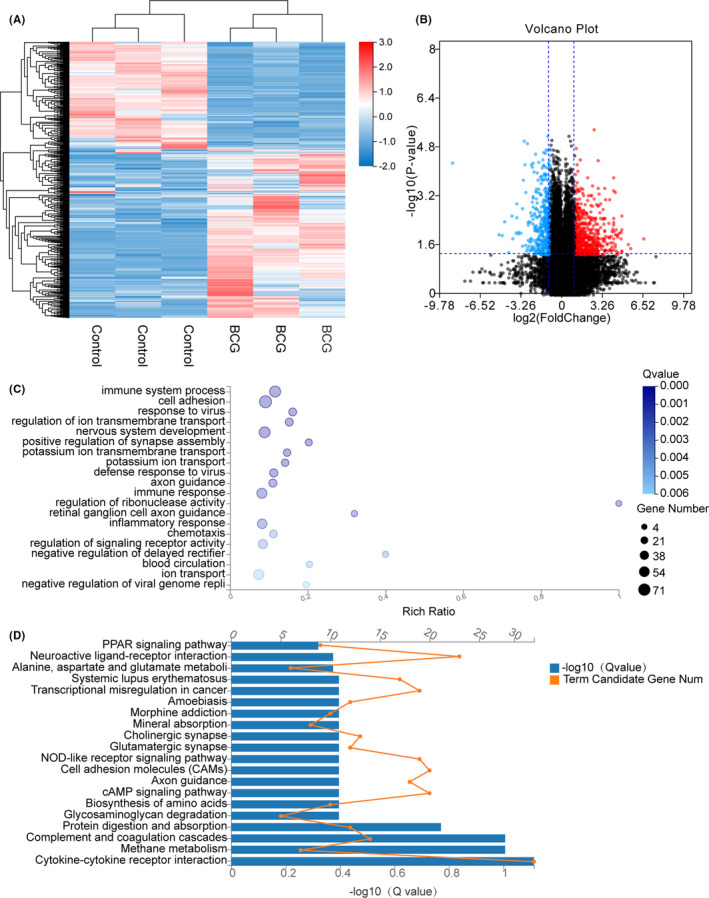
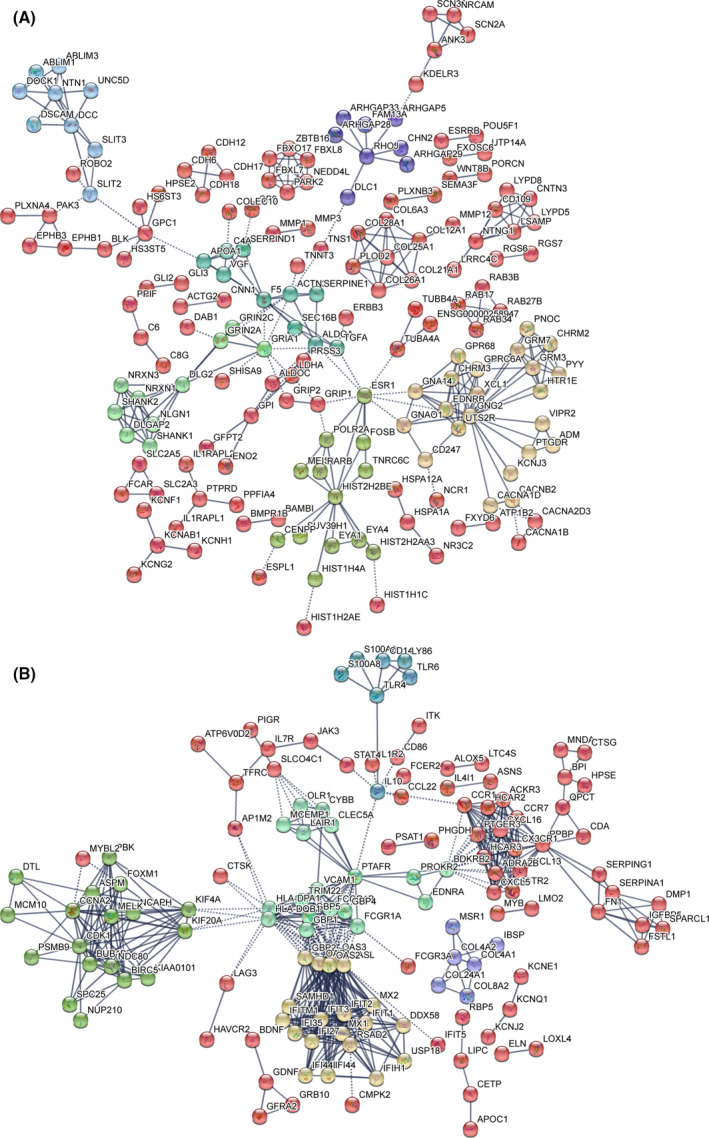
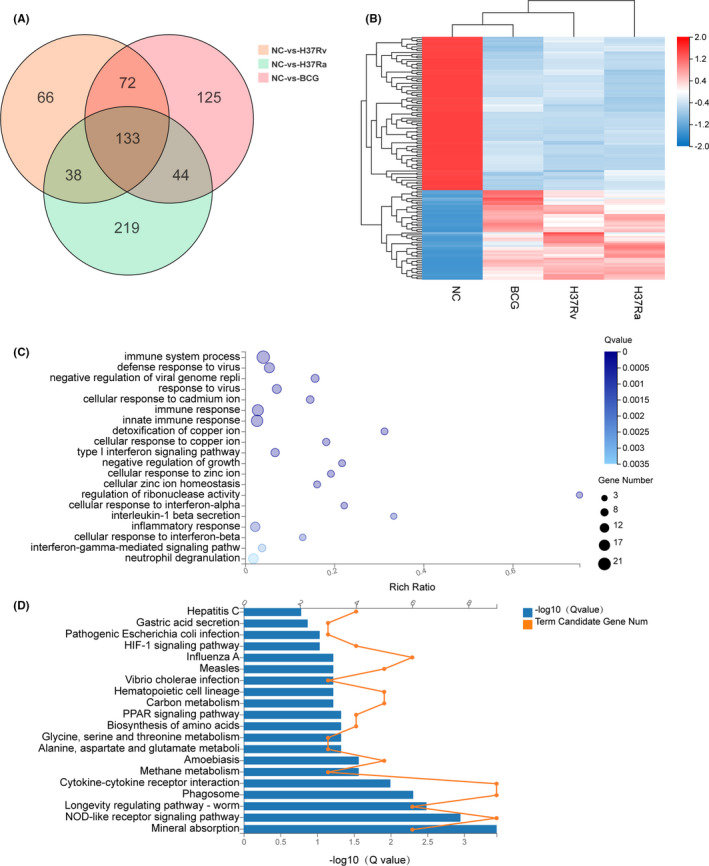
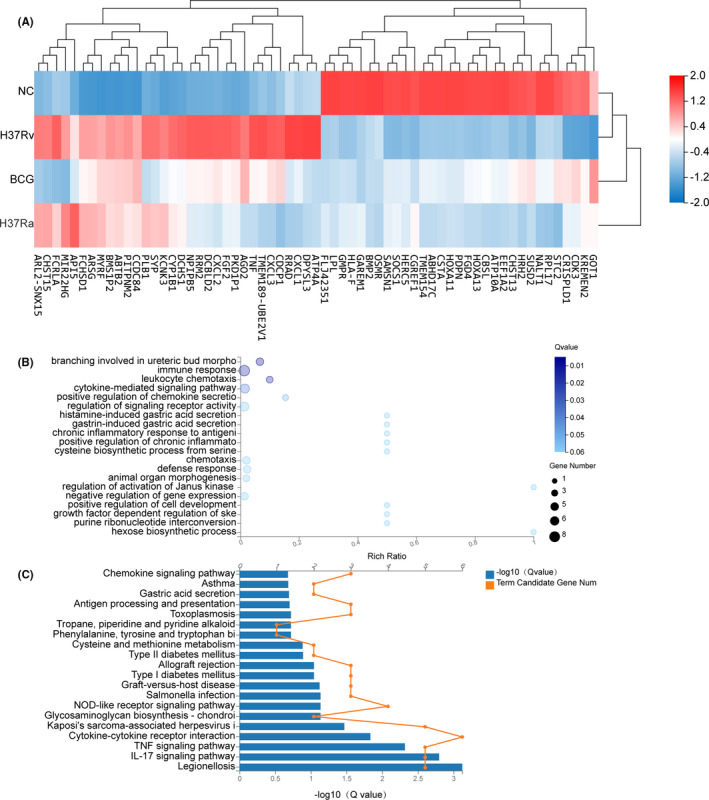
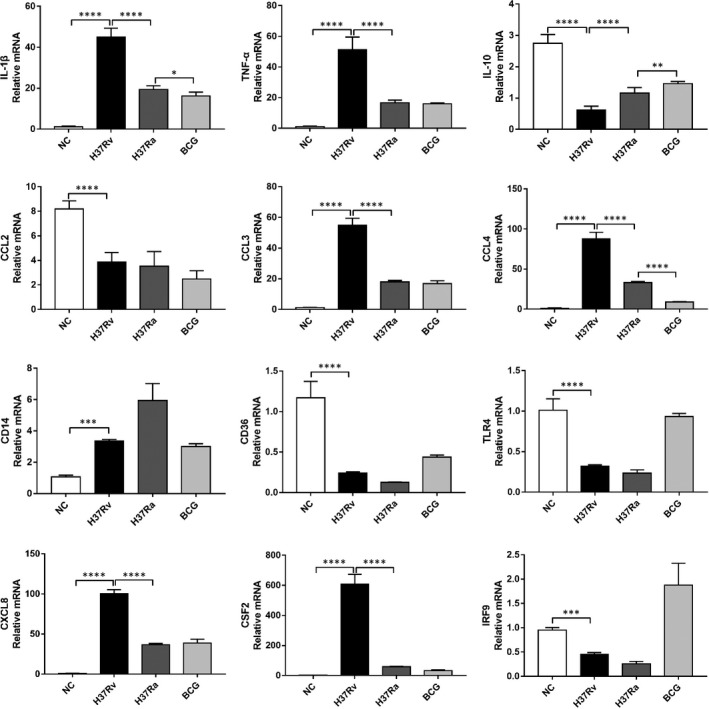
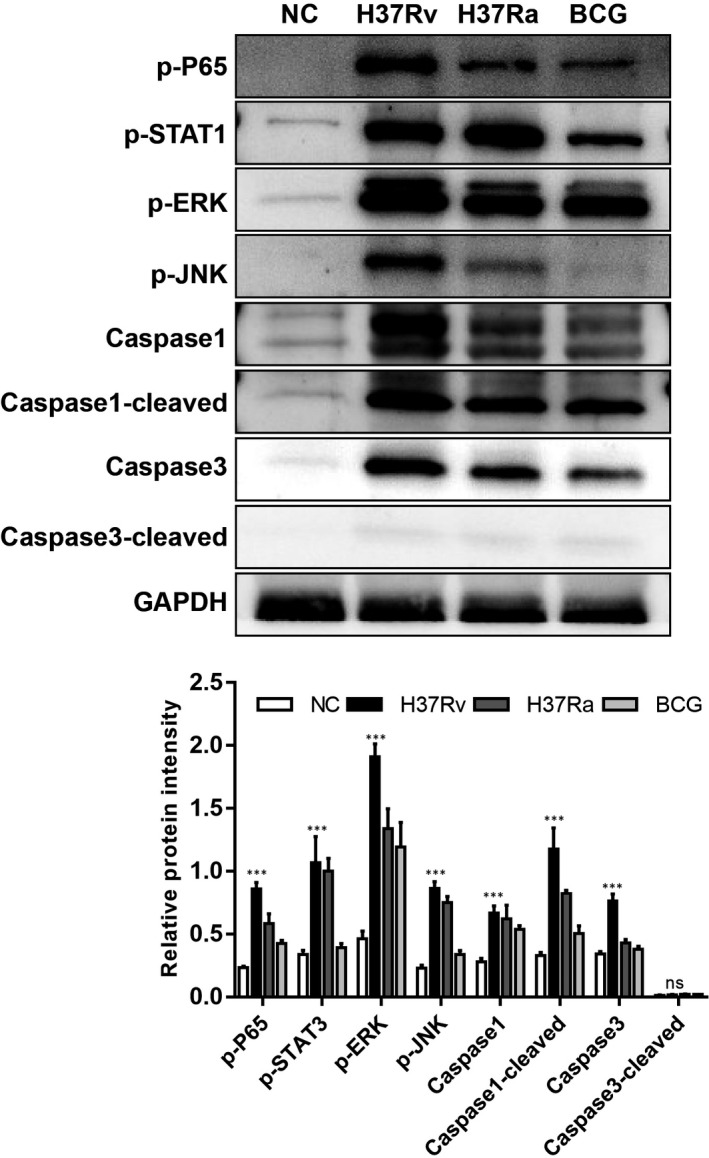
Tuberculosis (TB) remains a worldwide healthcare concern, and the exploration of the host-pathogen interaction is essential to develop therapeutic modalities and strategies to control Mycobacterium tuberculosis (M.tb). In this study, RNA sequencing (transcriptome sequencing) was employed to investigate the global transcriptome changes in the macrophages during the different strains of M.tb infection. THP-1 cells derived from macrophages were exposed to the virulent M.tb strain H37Rv (Rv) or the avirulent M.tb strain H37Ra (Ra), and the M.tb BCG vaccine strain was used as a control. The cDNA libraries were prepared from M.tb-infected macrophages and then sequenced. To assess the transcriptional differences between the expressed genes, the bioinformatics analysis was performed using a standard pipeline of quality control, reference mapping, differential expression analysis, protein-protein interaction (PPI) networks, gene ontology (GO) and Kyoto Encyclopedia of Genes and Genomes (KEGG) pathway enrichment analysis. Q-PCR and Western blot assays were also performed to validate the data. Our findings indicated that, when compared to BCG or M.tb H37Ra infection, the transcriptome analysis identified 66 differentially expressed genes in the M.tb H37Rv-infected macrophages, out of which 36 genes were up-regulated, and 30 genes were down-regulated. The up-regulated genes were associated with immune response regulation, chemokine secretion, and leucocyte chemotaxis. In contrast, the down-regulated genes were associated with amino acid biosynthetic and energy metabolism, connective tissue development and extracellular matrix organization. The Q-PCR and Western blot assays confirmed increased expression of pro-inflammatory factors, altered energy metabolic processes, enhanced activation of pro-inflammatory signalling pathways and increased pyroptosis in H37Rv-infected macrophage. Overall, our RNA sequencing-based transcriptome study successfully identified a comprehensive, in-depth gene expression/regulation profile in M.tb-infected macrophages. The results demonstrated that virulent M.tb strain H37Rv infection triggers a more severe inflammatory immune response associated with increased tissue damage, which helps in understanding the host-pathogen interaction dynamics and pathogenesis features in different strains of M.tb infection.
Keywords: Mycobacterium tuberculosis; infection; macrophage; regulation; transcriptome.
© 2021 The Authors. Journal of Cellular and Molecular Medicine published by Foundation for Cellular and Molecular Medicine and John Wiley & Sons Ltd.
Conflict of interest statement
The authors declare no conflict of interest.
Figures
Similar articles
-
Untargeted metabolomics analysis reveals Mycobacterium tuberculosis strain H37Rv specifically induces tryptophan metabolism in human macrophages.BMC Microbiol. 2022 Oct 17;22(1):249. doi: 10.1186/s12866-022-02659-y. BMC Microbiol. 2022. PMID: 36253713 Free PMC article.
-
Characteristic genes in THP‑1 derived macrophages infected with Mycobacterium tuberculosis H37Rv strain identified by integrating bioinformatics methods.Int J Mol Med. 2019 Oct;44(4):1243-1254. doi: 10.3892/ijmm.2019.4293. Epub 2019 Jul 30. Int J Mol Med. 2019. PMID: 31364746 Free PMC article.
-
Comparative transcriptomic analysis of mouse macrophages infected with live attenuated vaccine strains of Mycobacterium tuberculosis.Front Immunol. 2025 Jul 11;16:1583439. doi: 10.3389/fimmu.2025.1583439. eCollection 2025. Front Immunol. 2025. PMID: 40718493 Free PMC article.
-
Natural and trained innate immunity against Mycobacterium tuberculosis.Immunobiology. 2020 May;225(3):151951. doi: 10.1016/j.imbio.2020.151951. Epub 2020 Apr 27. Immunobiology. 2020. PMID: 32423788 Review.
-
Mycobacterium tuberculosis Primary Infection and Dissemination: A Critical Role for Alveolar Epithelial Cells.Front Cell Infect Microbiol. 2019 Aug 21;9:299. doi: 10.3389/fcimb.2019.00299. eCollection 2019. Front Cell Infect Microbiol. 2019. PMID: 31497538 Free PMC article. Review.
Cited by
-
Macrophage NFATC2 mediates angiogenic signaling during mycobacterial infection.Cell Rep. 2022 Dec 13;41(11):111817. doi: 10.1016/j.celrep.2022.111817. Cell Rep. 2022. PMID: 36516756 Free PMC article.
-
Untargeted metabolomics analysis reveals Mycobacterium tuberculosis strain H37Rv specifically induces tryptophan metabolism in human macrophages.BMC Microbiol. 2022 Oct 17;22(1):249. doi: 10.1186/s12866-022-02659-y. BMC Microbiol. 2022. PMID: 36253713 Free PMC article.
-
A bovine pulmosphere model and multiomics reveal early host response signature in tuberculosis.Commun Biol. 2025 Apr 4;8(1):559. doi: 10.1038/s42003-025-07883-6. Commun Biol. 2025. PMID: 40186000 Free PMC article.
-
Establishment of an in vitro model of monocyte-like THP-1 cells for trained immunity induced by bacillus Calmette-Guérin.BMC Microbiol. 2024 Apr 20;24(1):130. doi: 10.1186/s12866-024-03191-x. BMC Microbiol. 2024. PMID: 38643095 Free PMC article.
-
Baicalein Suppresses NLRP3 and AIM2 Inflammasome-Mediated Pyroptosis in Macrophages Infected by Mycobacterium tuberculosis via Induced Autophagy.Microbiol Spectr. 2023 Jun 15;11(3):e0471122. doi: 10.1128/spectrum.04711-22. Epub 2023 May 1. Microbiol Spectr. 2023. PMID: 37125940 Free PMC article.
References
-
- Wu X, Lu W, Shao Y, et al. pncA gene mutations in reporting pyrazinamide resistance among the MDR‐TB suspects. Infect Genet Evol. 2018;65:147‐150. - PubMed
-
- Danjuma L, Ling MP, Hamat RA, et al. Genomic plasticity between human and mycobacterial DNA: a review. Tuberculosis. 2017;107:38‐47. - PubMed
-
- Tarashi S, Badi SA, Moshiri A, et al. The inter‐talk between Mycobacterium tuberculosis and the epigenetic mechanisms. Epigenomics. 2020;12(5):455‐469. - PubMed
Publication types
MeSH terms
Substances
LinkOut - more resources
Full Text Sources
