

Probing Multicellular Tissue Fusion of Cocultured Spheroids-A 3D-Bioassembly Model
- PMID: 34632729
- PMCID: PMC8596109
- DOI: 10.1002/advs.202103320
Probing Multicellular Tissue Fusion of Cocultured Spheroids-A 3D-Bioassembly Model
Abstract
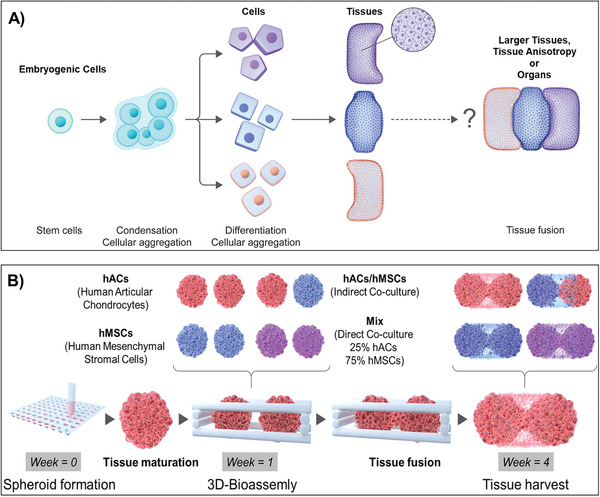
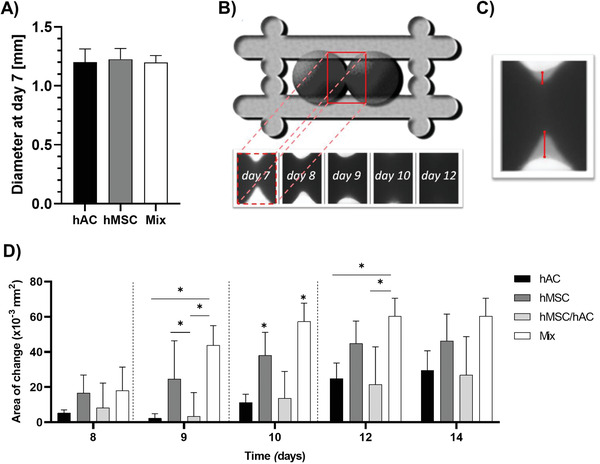
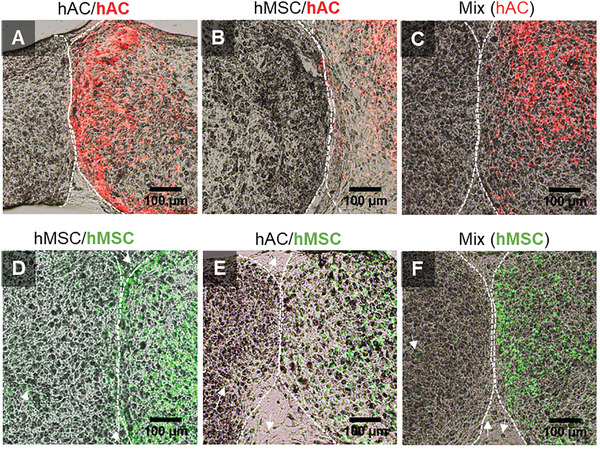
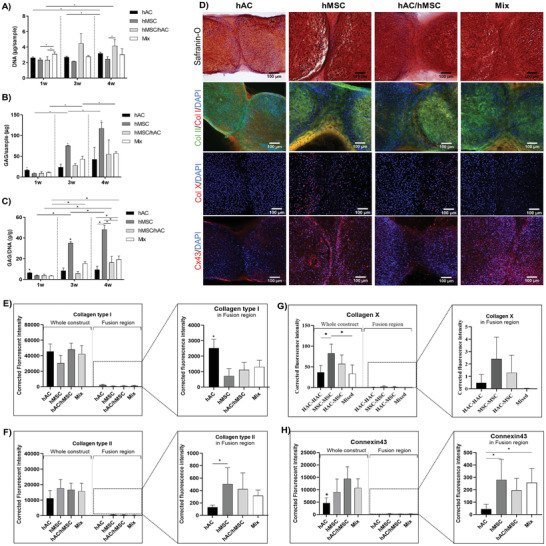
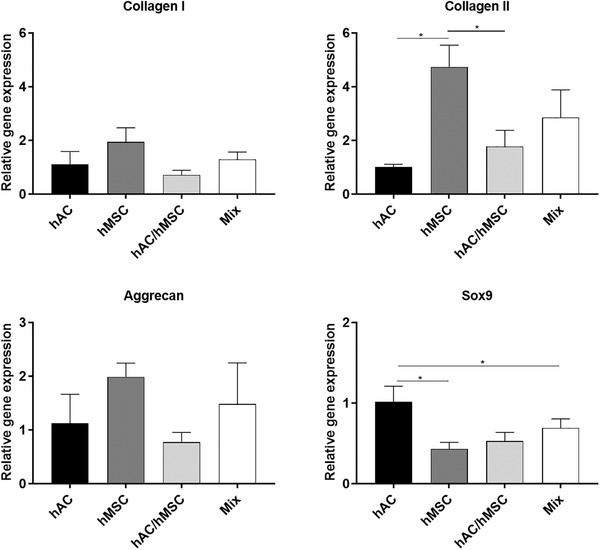
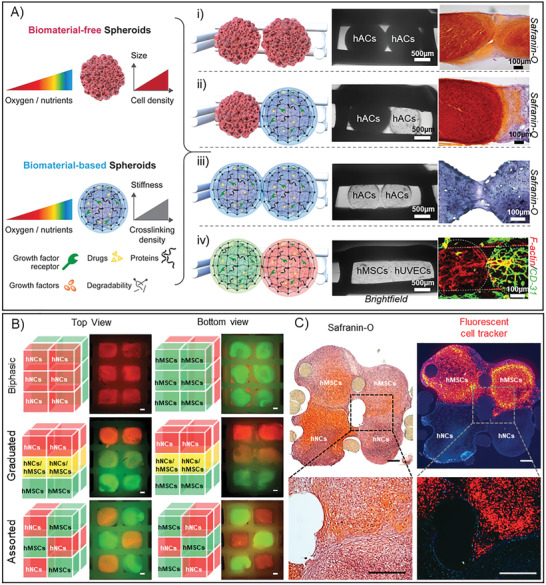
While decades of research have enriched the knowledge of how to grow cells into mature tissues, little is yet known about the next phase: fusing of these engineered tissues into larger functional structures. The specific effect of multicellular interfaces on tissue fusion remains largely unexplored. Here, a facile 3D-bioassembly platform is introduced to primarily study fusion of cartilage-cartilage interfaces using spheroids formed from human mesenchymal stromal cells (hMSCs) and articular chondrocytes (hACs). 3D-bioassembly of two adjacent hMSCs spheroids displays coordinated migration and noteworthy matrix deposition while the interface between two hAC tissues lacks both cells and type-II collagen. Cocultures contribute to increased phenotypic stability in the fusion region while close initial contact between hMSCs and hACs (mixed) yields superior hyaline differentiation over more distant, indirect cocultures. This reduced ability of potent hMSCs to fuse with mature hAC tissue further underlines the major clinical challenge that is integration. Together, this data offer the first proof of an in vitro 3D-model to reliably study lateral fusion mechanisms between multicellular spheroids and mature cartilage tissues. Ultimately, this high-throughput 3D-bioassembly model provides a bridge between understanding cellular differentiation and tissue fusion and offers the potential to probe fundamental biological mechanisms that underpin organogenesis.
Keywords: 3D-bioassembly; cartilage tissues; cocultured spheroids; high throughput; microtissues; spheroid fusion; tissue fusion.
© 2021 The Authors. Advanced Science published by Wiley-VCH GmbH.
Conflict of interest statement
The authors declare no conflict of interest.
Figures
Similar articles
-
Articular Cartilage Regeneration through Bioassembling Spherical Micro-Cartilage Building Blocks.Cells. 2022 Oct 16;11(20):3244. doi: 10.3390/cells11203244. Cells. 2022. PMID: 36291114 Free PMC article. Review.
-
Automated 3D bioassembly of micro-tissues for biofabrication of hybrid tissue engineered constructs.Biofabrication. 2018 Jan 12;10(2):024103. doi: 10.1088/1758-5090/aa9ef1. Biofabrication. 2018. PMID: 29199637
-
Scaffolded spheroids as building blocks for bottom-up cartilage tissue engineering show enhanced bioassembly dynamics.Acta Biomater. 2024 Jan 15;174:163-176. doi: 10.1016/j.actbio.2023.12.001. Epub 2023 Dec 7. Acta Biomater. 2024. PMID: 38065247
-
The hypertrophic cartilage induction influences the building-block capacity of human adipose stem/stromal cell spheroids for biofabrication.Artif Organs. 2021 Oct;45(10):1208-1218. doi: 10.1111/aor.14000. Epub 2021 Jun 15. Artif Organs. 2021. PMID: 34036603
-
Life is 3D: Boosting Spheroid Function for Tissue Engineering.Trends Biotechnol. 2017 Feb;35(2):133-144. doi: 10.1016/j.tibtech.2016.08.004. Epub 2016 Sep 12. Trends Biotechnol. 2017. PMID: 27634310 Review.
Cited by
-
Articular Cartilage Regeneration through Bioassembling Spherical Micro-Cartilage Building Blocks.Cells. 2022 Oct 16;11(20):3244. doi: 10.3390/cells11203244. Cells. 2022. PMID: 36291114 Free PMC article. Review.
-
Biomanufacturing human tissues via organ building blocks.Cell Stem Cell. 2022 May 5;29(5):667-677. doi: 10.1016/j.stem.2022.04.012. Cell Stem Cell. 2022. PMID: 35523137 Free PMC article. Review.
-
Recapitulating the Drifting and Fusion of Two-Generation Spheroids on Concave Agarose Microwells.Int J Mol Sci. 2023 Jul 26;24(15):11967. doi: 10.3390/ijms241511967. Int J Mol Sci. 2023. PMID: 37569343 Free PMC article.
-
Engineering three-dimensional bone macro-tissues by guided fusion of cell spheroids.Front Endocrinol (Lausanne). 2023 Dec 19;14:1308604. doi: 10.3389/fendo.2023.1308604. eCollection 2023. Front Endocrinol (Lausanne). 2023. PMID: 38169965 Free PMC article.
-
Co-Culture of Mesenchymal Stem Cells and Ligamentocytes on Triphasic Embroidered Poly(L-lactide-co-ε-caprolactone) and Polylactic Acid Scaffolds for Anterior Cruciate Ligament Enthesis Tissue Engineering.Int J Mol Sci. 2023 Apr 4;24(7):6714. doi: 10.3390/ijms24076714. Int J Mol Sci. 2023. PMID: 37047686 Free PMC article.
References
-
- Arthritis Foundation , Arthritis by the numbers, 2019, v3, 4100.17.10445.
-
- Hooper G., Lee A. J., Rothwell A., Frampton C., N. Z. M. J. 2014, 127, 82. - PubMed
Publication types
MeSH terms
Grants and funding
LinkOut - more resources
Full Text Sources
Other Literature Sources