. 2022 Jun;18(6):1385-1400.
doi: 10.1080/15548627.2021.1985338. Epub 2021 Oct 10.

FLT4/VEGFR3 activates AMPK to coordinate glycometabolic reprogramming with autophagy and inflammasome activation for bacterial elimination

Affiliations

FLT4/VEGFR3 activates AMPK to coordinate glycometabolic reprogramming with autophagy and inflammasome activation for bacterial elimination

Li Ma et al. Autophagy. 2022 Jun.

Abstract

Macrophages rapidly undergo glycolytic reprogramming in response to macroautophagy/autophagy, inflammasome activation and pyroptosis for the clearance of bacteria. Identification the key molecules involved in these three events will provide critical potential therapeutic applications. Upon S. typhimurium infection, FLT4/VEGFR3 and its ligand VEGFC were inducibly expressed in macrophages, and FLT4 signaling inhibited CASP1 (caspase 1)-dependent inflammasome activation and pyroptosis but enhanced MAP1LC3/LC3 activation for elimination of the bacteria. Consistently, FLT4 mutants lacking the extracellular ligand-binding domain increased production of the proinflammatory metabolites such as succinate and lactate, and reduced antimicrobial metabolites including citrate and NAD(P)H in macrophages and liver upon infection. Mechanistically, FLT4 recruited AMP-activated protein kinase (AMPK) and phosphorylated Y247 and Y441/442 in the PRKAA/alpha subunit for AMPK activation. The AMPK agonist AICAR could rescue glycolytic reprogramming and inflammasome activation in macrophages expressing the mutant FLT4, which has potential translational application in patients carrying Flt4 mutations to prevent recurrent infections. Collectively, we have elucidated that the FLT4-AMPK module in macrophages coordinates glycolytic reprogramming, autophagy, inflammasome activation and pyroptosis to eliminate invading bacteria.Abbreviations: 3-MA: 3-methyladenine; AICAR: 5-aminoimidazole-4-carboxamide1-β-D-ribofuranoside; AMP: adenosine monophosphate; AMPK: AMP-activated protein kinase; ATP: adenosine triphosphate; BMDM: bone marrow-derived macrophage; CASP1: caspase 1; CFUs: colony-forming units; FLT4/VEGFR3: FMS-like tyrosine kinase 4; GFP: green fluorescent protein; LDH: lactate dehydrogenase; LPS: lipopolysaccharide; MAP1LC3/LC3: microtubule-associated protein 1 light chain 3; PEM: peritoneal exudate macrophage; PRKAA1/AMPKα1: protein kinase, AMP-activated, alpha 1 catalytic subunit; PYCARD/ASC: PYD and CARD domain containing; ROS: reactive oxygen species; SQSTM1/p62: sequestosome 1; TLR4: toll-like receptor 4; ULK1: unc-51 like autophagy activating kinase 1; VEGFC: vascular endothelial growth factor C; WT: wild type.

Keywords: AMPK; FLT4/VEGFR3; glycolytic reprogramming; inflammasome; pyroptosis.


Conflict of interest statement

The authors declare no competing financial interests.

Figures
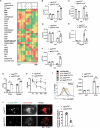
Figure 1.
Figure 1.
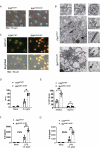
Glycolytic reprogramming and bacteria clearance are controlled by macrophage surface receptor FLT4. (A) S. typhimurium was injected into the tail veins of Flt4WT/WT and flt4LBD/LBD mice. The glucometabolites profile in livers by LC-MS metabolomics assay. (B-F) Statistical analyses of specific metabolite across treatment groups. *p < 0.05, **p < 0.01 (G) Flt4WT/WT and flt4LBD/LBD mice were injected in the tail vein with S. typhimurium. bacterial colony-forming units (CFU) in livers and spleens on day 4 were assessed. Data represents 4 mice per group. *p < 0.05, **p < 0.01. (H) Flt4WT/WT and flt4LBD/LBD PEMs were infected with S. typhimurium for 24 h to determine bacterial CFU. Data are presented as the mean ± SEM of triplicate experiments. *p < 0.05, **p < 0.01. (I) Flt4WT/WT and flt4LBD/LBD PEMs were infected for 30 min with GFP-E. coli to measure phagocytosis by FACS. Histogram plots of one representative experiment. Quantification of phagocytosis was done by comparing the geometric mean fluorescence intensity (MFI). Data are presented as the mean ± SEM of triplicate experiments. *p < 0.05, **p < 0.01 (J) Flt4WT/WT and flt4LBD/LBD BMDMs loaded with LysoTracker Red were infected with S. typhimurium-GFP for 1 h, and imaged by confocal microscopy, the percentages of LysoTracker-positive phagosomes were quantified at least 200 cells, Data are presented as the mean ± SEM *p < 0.05, **p < 0.01. 2,3 GP, 2,3-bisphosphoglycerate; 3PG, 3-phosphoglycerate; acetyl-coa, acetyl coenzyme A; AKG, a-ketoglutarate; ATP/ADP, adenosine triphosphate/adenosine diphosphate; CIT, citrate; D5P, D-ribose 5-phosphate; E4P, erythrose 4-phosphate; F6P, fructose-6-phosphate; FBP, fructose 1,6-bisphosphatase; FUM, fumarate; GAP/DHAP, glyceraldehyde-3-phosphate-dihydroxyacetone phosphate; Gln, glutamine; Glu, glucose; GSH:GSSG, The reduced glutathione:oxidized glutathione ratio; LAC, lactate; MAL, malate; NAD, nicotinamide adenine dinucleotide; NADP, nicotinamide adenine dinucleotide phosphate; PEP, phosphoenolpyruvate; PYR, pyruvate; S7P, 7-phosphate sedoheptulose; SUC, succinate; succinyl-coa, succinyl coenzyme A.
Figure 2.
Figure 2.
FLT4 protects macrophages from pyroptosis during clearance of S. typhimurium. (A and B) Representative images of S. typhimurium-RFP infected Flt4WT/WT and flt4LBD/LBD PEMs for 2 h by live-cell spinning disk confocal laser microscopy (A) or by electron microscopy analysis (B), numerous phago-lysosomal vacuoles with membrane containing bacteria remnants were highlighted by white arrows. The intact bacteria in flt4LBD/LBD PEMs were highlighted by black arrows. Representative images from three independent experiments. Scale bar: 500 nm. (C and D) Flt4WT/WT and flt4LBD/LBD PEMs were infected with S. typhimurium-GFP for 1 h, followed by staining with PI. The percentages of PI+ cell was analyzed from at least 200 cells. Data are the mean ± SEM Representative images were shown. *p < 0.05, **p < 0.01. (E) Flt4WT/WT and flt4LBD/LBD PEMs were infected with S. typhimurium in the presence of the medium control or glycine that nonspecifically inhibits ion fluxes. LDH released by dying cells was quantified at least 200 cells. Data are presented as the mean ± SEM *p < 0.05, **p < 0.01 (F and G) Flt4WT/WT and flt4LBD/LBD PEMs (F) or BMDM (G) were treated with LPS (1 μg/ml, 4 h) followed by S. typhimurium infection for 30 min. IL1B concentrations in supernatants were examined by ELISA. Data are presented as the mean ± SEM *p < 0.05, **p < 0.01.
Figure 3.
Figure 3.
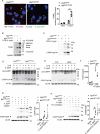
FLT4 inhibits inflammasome and CASP1 activation in S. typhimurium infected macrophages. (A) Flt4WT/WT and flt4LBD/LBD PEMs were pretreated with LPS followed by S. typhimurium infection, and immunostained for PYCARD (red) and Hoechst (blue). Images are representative of three independent experiments (scale bar: 10 μm). The percentages of macrophages containing PYCARD foci were analyzed from at least 200 cells in each experiment and data are presented as the mean ± SEM **p < 0.01(B) Flt4WT/WT and flt4LBD/LBD PEMs were pretreated with LPS followed by S. typhimurium infection to assess PYCARD oligomerization by immunoblotting. Flt4WT/WT and flt4LBD/LBD PEMs (C), in the presence or absence of exogenous VEGFC (G) or the FLT4 inhibitor MAZ51 (10 μM) (H), or Flt4WT/WTand Flt4WT/TKmut BMDMs (D), or the control and Flt4 siRNA transfected PEMs (E) were pretreated with LPS followed by S. typhimurium infection for the indicated times. The levels of pro-CASP1 (inactive CASP1), CASP1/p10 (active CASP1) in cell lysates (D, E) or CASP1/p20 in supernatants (C, G, H) were examined by immunoblotting. The immunoblots were statistically quantified by densitometry. Representative data from three independent experiments were shown. (F) Flt4WT/WT and flt4LBD/LBD PEMs were primed with 1 μg/ml LPS followed by S. typhimurium infection. VEGFC concentrations in supernatants were examined by ELISA. Data are presented as the mean ± SEM *p < 0.05, **p < 0.01.
Figure 4.
Figure 4.
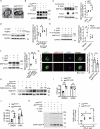
FLT4 enhances bacteria elimination and prevents inflammasome activation in an autophagy-dependent manner. (A) S. typhimurium infected Flt4WT/WT and flt4LBD/LBD BMDMs were prepared for electron microscopy analysis. Representative images are from three independent experiments (Scale bar 500 nm). (B-F) Flt4WT/WT and flt4LBD/LBD PEMs (B), or iBMDM cells overexpressing GFP and FLT4 (C), or exogenous VEGFC-treated PEMs (D), or the FLT4 inhibitor MAZ51 (10 μM)-treated PEMs (E), or 3-MA (5 mM)-treated PEMs (F) were primed with LPS (1 μg/ml) followed by S. typhimurium infection. MAP1LC3-I and MAP1LC3-II levels were examined by immunoblotting. The immunoblots were statistically quantified by densitometry. (G) Flt4WT/WT and flt4LBD/LBD PEMs were pretreated with LPS followed by S. typhimurium infection, and immunostained for LAMP1 (green), MAP1LC3 (red) and DAPI (blue). The percentages of MAP1LC3 and LAMP1 colocalization were analyzed from at least 200 cells. Data were the mean ± SEM Representative images were shown. *p < 0.05, **p < 0.01.(H) Flt4WT/WT and flt4LBD/LBD PEMs were pretreated with LPS followed by S. typhimurium infection in the absence or presence of bafilomycin. The levels of SQSTM1 were examined by immunoblotting. (I) Flt4WT/WT and flt4LBD/LBD PEMs were infected with S. typhimurium in the absence or presence of 3-MA (5 mM), CFUs were enumerated. Data are presented as the mean ± SEM *p < 0.05, **p < 0.01(J-K) Flt4WT/WT and flt4LBD/LBD PEMs were primed with LPS (1 μg/ml) followed by S. typhimurium infection in the absence or presence of 3-MA (5 mM), IL1B concentrations in supernatants were examined by ELISA, Data are presented as the mean ± SEM *p < 0.05, **p < 0.01(J), and the levels of CASP1/p20 in supernatants (K) were examined by immunoblotting. The immunoblots were statistically quantified by densitometry.
Figure 5.
Figure 5.
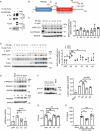
FLT4 interacts with AMPK to coordinate glycometabolic reprogramming, autophagy and inflammasome activation. (A) HEK293T cells were transfected with plasmids encoding FLAG-IRF3 and HA-PRKAA1 and prepared for immunoprecipitation and immunoblotting assays with the indicated antibodies. (B) RAW264.7 cells overexpressing FLAG-FLT4 or the FLAG control were infected with S. typhimurium to assess the endogenous binding of FLT4 to PRKAA1. The immunoblots were statistically quantified by densitometry. (C-E) The FLT4 inhibitor MAZ51 (10 μM)-treated (C), the AMPK agonist AICAR (100 µM)-treated (D), or Prkaa siRNA-treated (E) Flt4WT/WT and flt4LBD/LBD PEMs were primed with LPS (1 μg/ml) followed by S. typhimurium infection. The levels of PRKAA1 phosphorylation, ULK1 phosphorylation, CASP1/p20 in supernatants and MAP1LC3 lipidation were examined by immunoblotting. The immunoblots were statistically quantified by densitometry. (F-H) Flt4WT/WT and flt4LBD/LBD PEMs were primed with LPS (1 μg/ml) followed by S. typhimurium infection in the absence or presence of the AMPK agonist AICAR (100 µM). IL1B concentrations in supernatants by ELISA (F), bacterial CFUs (G), and the glucometabolites profile (H) by LC-MS were checked. Data are presented as the mean ± SEM *p < 0.05, **p < 0.01.
Figure 6.
Figure 6.
FLT4-induced PRKAA1 tyrosine phosphorylation is indispensable for autophagy and inflammasome activation. (A) HEK293T cells were transfected with FLAG-IRF3 and HA-PRKAA1 and prepared for immunoprecipitation and immunoblotting. (B) The diagram of PRKAA1 domains and tyrosine sites. (C and D) HeLa cells overexpressing wild-type PRKAA1 (A0) or the PRKAA1 mutants (A1, A2, A3, A4, A5) (C), or together with FLAG-FLT4 (D) were infected with S. typhimurium to check the levels of MAP1LC3-I and MAP1LC3-II. The immunoblots were statistically quantified by densitometry. (E-H) iBMDMs stably overexpressing the GFP control, wild-type PRKAA1 (A0) or the mutants (A1 or A3) were primed with LPS (1 μg/ml) followed by S. typhimurium infection. The PRKAA1-ULK1 phosphorylation levels by immunoblotting (E and F), bacterial CFUs (G) or IL1B concentrations in supernatants by ELISA (H), were examined. The immunoblots were statistically quantified by densitometry. Data are presented as the mean ± SEM *p < 0.05, **p < 0.01.
Figure 7.
Figure 7.
The model: The FLT4-AMPK module regulates macrophage glycolytic metabolism to coordinate autophagy, pyroptosis, and inflammasome activation during bacterial infection. Upon infection, TLR4 recognizes bacterial LPS and enhance the expression levels of FLT4 and the ligand VEGFC. Activated FLT4 via binding to VEGFC could recruit PRKAA1 and phosphorylates its Y247 and Y441/442 to activate AMPK. This signaling pathway regulates macrophage glycolytic metabolism (center), which coordinates autophagy (left) as well as inflammasome activation and pyroptosis (right), resulting in better protection against bacterial infection.

Similar articles

Cited by

References

    1. Kawai T, Akira S.. The role of pattern-recognition receptors in innate immunity: update on Toll-like receptors. Nat Immunol. 2010. May;11(5):373–384. - PubMed
    1. Kono H, Rock KL.. How dying cells alert the immune system to danger. Nat Rev Immunol. 2008. Apr;8(4):279–289. - PMC - PubMed
    1. Van den Bossche J, O’Neill LA, Menon D. Macrophage immunometabolism: where are we (going)? Trends Immunol. 2017. June;38(6):395–406. - PubMed
    1. Nagy C, Haschemi A. Time and demand are two critical dimensions of immunometabolism: the process of macrophage activation and the pentose phosphate pathway. Front Immunol. 2015;6:164. - PMC - PubMed
    1. O’Neill LA. A critical role for citrate metabolism in LPS signalling. Biochem J. 2011. Sep;438(3):e5–6. - PubMed

Publication types