

Long non-coding RNA growth arrest specific transcript 5 acting as a sponge of MicroRNA-188-5p to regulate SMAD family member 2 expression promotes myocardial ischemia-reperfusion injury
- PMID: 34632932
- PMCID: PMC8806717
- DOI: 10.1080/21655979.2021.1957524
Long non-coding RNA growth arrest specific transcript 5 acting as a sponge of MicroRNA-188-5p to regulate SMAD family member 2 expression promotes myocardial ischemia-reperfusion injury
Abstract
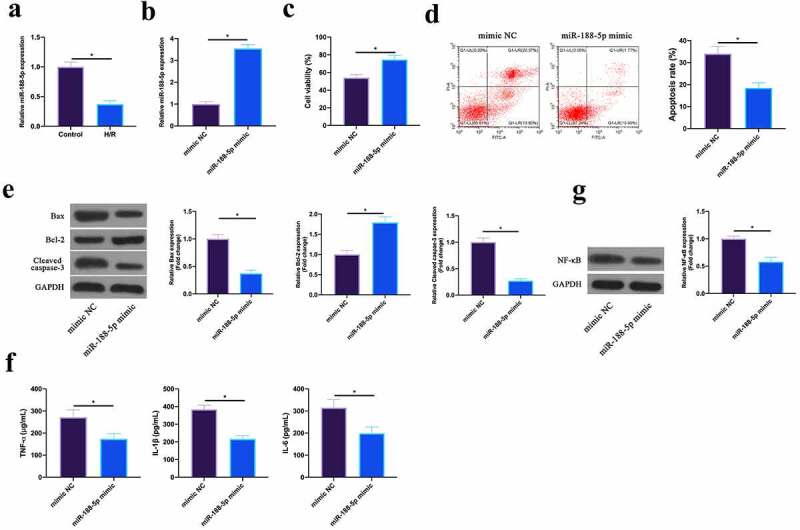
The purpose of this work is to probe into the potential role of long non-coding RNA growth arrest specific transcript 5 (lncGAS5)/ microRNA (miR)-188-5p/SMAD2 axis in MIRI. Through ligating the left anterior descending (LAD) coronary artery, MIRI animal model and hypoxia/reoxygenation (H/R) myocardial injury model in vitro were established. Via adenovirus or plasmid transfection, lncGAS5/MiR-188-5p/SMAD2 expression was up-regulated or down-regulated in the study. RT-qPCR was applied to check LncGAS5/MiR-188-5p/SMAD2 mRNA expression, HE staining for histopathological staining, TUNEL staining and flow cytometry to examine cardiomyocyte apoptotic rate, CCK-8 to check cell viability, ELISA to detect inflammatory factor levels, Western blot to examine Bax, Bcl-2, cleaved caspase-3, NF-κB and SMAD2 expression, and dual luciferase reporter experiment to examine the targeting relationship of miR-188-5p with LncGAS5 and SMAD2. The results indicated that LncGAS5 and SMAD2 were highly expressed in MIRI and miR-188-5p was under-expressed. Silencing LncGAS5 and SMAD2 or overexpressing miR-188-5p could reduce MIRI in myocardial tissue, cardiomyocyte apoptosis, inhibit Bax, cleaved caspase-3 and NF-κB expressions and promote Bcl-2 expression, while reducing inflammatory factors TNF -α, IL-1β and IL-6 levels. Overexpressing LncGAS5 promoted MIRI. Additionally, the impact of silencing LncGAS5 on MIRI could be reversed through inhibiting miR-188-5p. LncGAS5 acted as a sponge of miR-188-5p to target SMAD2 expression. In conclusion, Silencing LncGAS5 is available to improve MIRI through regulating miR-188-5p/SMAD2 axis, and may be used as a potential target for treating MIRI in the future.
Keywords: Long non-coding RNA growth arrest specific transcript 5; NF-ΚB; microRNA-188-p; myocardial ischemia-reperfusion injury; smad2.
Conflict of interest statement
No potential conflict of interest was reported by the author(s).
Figures


Similar articles
-
LncRNA Rian reduces cardiomyocyte pyroptosis and alleviates myocardial ischemia-reperfusion injury by regulating by the miR-17-5p/CCND1 axis.Hypertens Res. 2022 Jun;45(6):976-989. doi: 10.1038/s41440-022-00884-6. Epub 2022 Mar 9. Hypertens Res. 2022. PMID: 35264782
-
LncRNA ZFAS1/miR-186-5p axis is involved in oxidative stress inhibition of myocardial ischemia-reperfusion injury by targeting BTG2.Expert Rev Clin Immunol. 2025 Feb;21(2):227-238. doi: 10.1080/1744666X.2024.2411999. Epub 2024 Oct 4. Expert Rev Clin Immunol. 2025. PMID: 39365123
-
microRNA-130a-5p suppresses myocardial ischemia reperfusion injury by downregulating the HMGB2/NF-κB axis.BMC Cardiovasc Disord. 2021 Mar 3;21(1):121. doi: 10.1186/s12872-020-01742-4. BMC Cardiovasc Disord. 2021. PMID: 33658008 Free PMC article.
-
MicroRNA-specific therapeutic targets and biomarkers of apoptosis following myocardial ischemia-reperfusion injury.Mol Cell Biochem. 2024 Oct;479(10):2499-2521. doi: 10.1007/s11010-023-04876-z. Epub 2023 Oct 25. Mol Cell Biochem. 2024. PMID: 37878166 Review.
-
Mesenchymal Stem Cell-Derived Exosomal Noncoding RNAs as Alternative Treatments for Myocardial Ischemia-Reperfusion Injury: Current Status and Future Perspectives.J Cardiovasc Transl Res. 2023 Oct;16(5):1085-1098. doi: 10.1007/s12265-023-10401-w. Epub 2023 Jun 7. J Cardiovasc Transl Res. 2023. PMID: 37286924 Free PMC article. Review.
Cited by
-
LncRNA SNHG1 alleviates myocardial ischaemia-reperfusion injury by regulating the miR-137-3p/KLF4/TRPV1 axis.ESC Heart Fail. 2024 Apr;11(2):1009-1021. doi: 10.1002/ehf2.14660. Epub 2024 Jan 17. ESC Heart Fail. 2024. PMID: 38234046 Free PMC article.
-
Berberine represses Wnt/β-catenin pathway activation via modulating the microRNA-103a-3p/Bromodomain-containing protein 4 axis, thereby refraining pyroptosis and reducing the intestinal mucosal barrier defect induced via colitis.Bioengineered. 2022 Mar;13(3):7392-7409. doi: 10.1080/21655979.2022.2047405. Bioengineered. 2022. PMID: 35259053 Free PMC article.
-
MicroRNA miR-188-5p enhances SUMO2/3 conjugation by targeting SENP3 and alleviates focal cerebral ischemia/reperfusion injury in rats.Iran J Basic Med Sci. 2024;27(10):1260-1267. doi: 10.22038/ijbms.2024.76165.16485. Iran J Basic Med Sci. 2024. PMID: 39229582 Free PMC article.
References
-
- Betgem R, de Waard G, Nijveldt R, et al. Intramyocardial haemorrhage after acute myocardial infarction. Nature Reviews Cardiology. 2015;12:156–167. - PubMed
-
- Masoudi F, Ponirakis A, Yeh R, et al. Cardiovascular care facts: a report from the national cardiovascular data registry. Journal of the American College of Cardiology. 2011;2013(62):1931–1947. - PubMed
-
- Davidson S, Ferdinandy P, Andreadou I, et al. Multitarget strategies to reduce myocardial ischemia/reperfusion injury: JACC review topic of the week. Journal of the American College of Cardiology. 2019;73:89–99. - PubMed
-
- Sharma P, Wang X, Ming C, et al. Considerations for the bioengineering of advanced cardiac in vitro models of myocardial infarction. Small (Weinheim an der Bergstrasse, Germany). 2021;17:e2003765. - PubMed
Publication types
MeSH terms
Substances
LinkOut - more resources
Full Text Sources
Other Literature Sources
Research Materials