

A microRNA signature that correlates with cognition and is a target against cognitive decline
- PMID: 34633146
- PMCID: PMC8573587
- DOI: 10.15252/emmm.202013659
A microRNA signature that correlates with cognition and is a target against cognitive decline
Abstract
While some individuals age without pathological memory impairments, others develop age-associated cognitive diseases. Since changes in cognitive function develop slowly over time in these patients, they are often diagnosed at an advanced stage of molecular pathology, a time point when causative treatments fail. Thus, there is great need for the identification of inexpensive and minimal invasive approaches that could be used for screening with the aim to identify individuals at risk for cognitive decline that can then undergo further diagnostics and eventually stratified therapies. In this study, we use an integrative approach combining the analysis of human data and mechanistic studies in model systems to identify a circulating 3-microRNA signature that reflects key processes linked to neural homeostasis and inform about cognitive status. We furthermore provide evidence that expression changes in this signature represent multiple mechanisms deregulated in the aging and diseased brain and are a suitable target for RNA therapeutics.
Keywords: Alzheimer; RNA therapeutics; biomarker; cognitive impairment; microRNA.
© 2021 The Authors. Published under the terms of the CC BY 4.0 license.
Conflict of interest statement
The authors M.R.I, F. Sa, and A.F are co‐inventors on a pending patent application (EP20217509.7) entitled “Methods and kits for detecting a risk for developing neurological or neurophysiological disorders”. The other authors declare no conflict of interest.
Figures
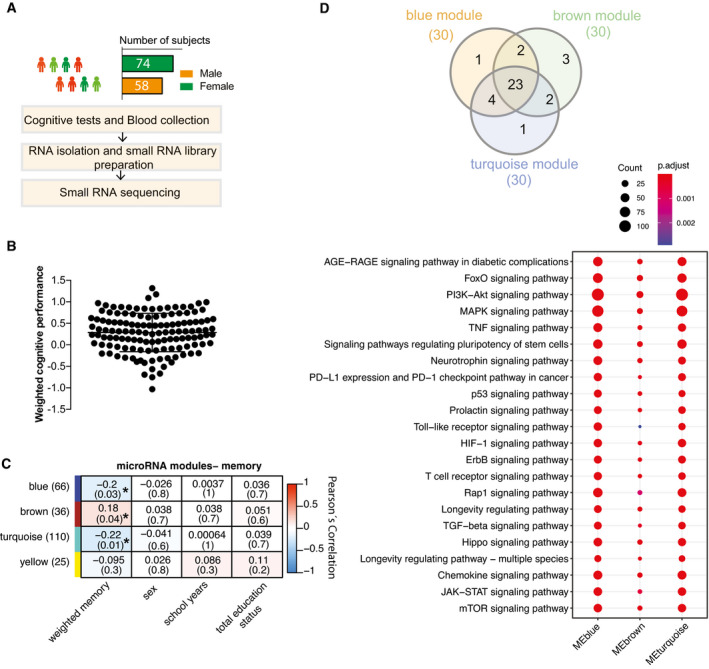
Experimental approach for the detection of blood microRNAs that correlate with memory function in healthy humans. This cohort includes 132 healthy and young individuals (74 males and 58 females, age: 25.95 ± 5.1 years). Participants took part in cognitive tests and donated blood samples (PAXgene tubes).
Weighted cognitive score of the 132 individuals shows the expected variability. Bar and error bars indicate mean ± SD.
MicroRNAs having at least 5 reads in 50% of the samples were considered for downstream co‐expression analysis. Co‐expression analysis revealed 3 microRNA clusters that were significantly linked to weighted cognitive performance. Number of microRNAs in each module is given in parentheses next to module name. Co‐expression modules are represented in rows, while each column refers to a phenotypic trait. Each cell contains the corresponding correlation coefficient and P‐value (denoted inside parentheses). Color code represents Pearson’s correlation. Expressions of the modules are not correlated with sex, number of years at school, or status of total education.
The analysis of the experimentally validated mRNA targets of the microRNAs belonging to 3 clusters identified in (C). Downstream analyses on those genes reveal that they control pathways related to aging and age‐related functions known to play a role in cognition. Venn diagram displays 23 of the top 30 significant pathways are common among three modules. Dot plot represents the top 23 common significant pathways across three modules. Size of the dot represents number of genes belonging to each pathway term while the color represents the statistical significance.
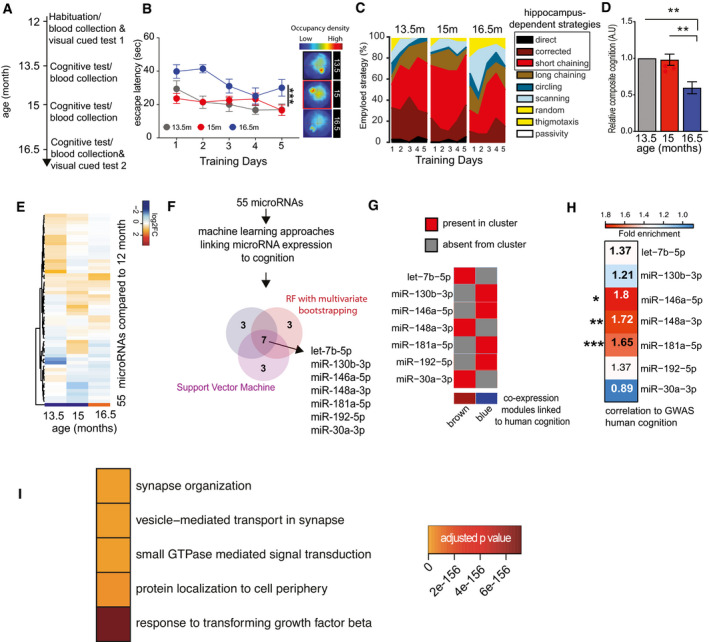
Experimental design of the water maze experiment. At 12 months of age, male mice were subjected to the water maze training protocol in order to habituate the animals to the procedure. Subsequently, mice were subjected to water maze training followed by a probe test at 13.5, 15, and 16.5 months of age. The platform position was altered during each training procedure. Blood was collected upon completion of each water maze procedure. A visual cued test was performed after the first and after the last blood collection when mice were 12 and 16.5 months of age, respectively.
Escape latency during water maze training when mice were 13.5, 15, or 16.5 months of age (n = 10 each group). Two‐way ANOVA followed by Tukey´s multiple comparisons test revealed significant effects of training trials (P‐value < 0.0001) and age (***P‐value 0.0004) on the performance. On days 1 and 2, there was a significant (P‐value < 0.05) difference between mice at 13.5 versus 16.5 months and 15 versus 16.5 months of age (n = 10 each group). On the 5th day of training, there was a significant difference observed between 15 and 16.5 months of age. Density plot (Right) shows the occupancy pattern of mice at different time points of aging. Occupancy signal on the platform was the least at 16.5 months, suggesting mice at the given age failed to locate the platform.
Analysis of the different search strategies during the water training sessions. Note that especially at 16.5 months of age mice adopt hippocampal independent search strategies indicative of impaired cognitive function.
The cumulative cognitive score calculated for each day on the basis of hippocampal‐dependent strategies was significantly impaired when comparing mice at 16.5 months of age to their performance at 15 or 13.5 months of age. Data are normalized to 13.5‐month group (ordinary one‐way ANOVA, Tukey`s multiple comparison test). N = 10 mice/group, **P < 0.01.
Heat map showing the expression pattern of 55 aging responsive microRNAs significantly deregulated during the course of aging. All data are shown in comparison with the expression level at 12 months of age. All microRNAs having at least 100 reads in 50% of the samples were filtered prior to differential expression analysis.
Expressions of these 55 microRNAs and cognitive performances along aging were used to identify microRNA features linked to cognition. Three independent approaches [e.g., random forests (RF) with leave‐one‐out cross‐validation, RF with multivariate bootstrapping, and support vector machine (SVM)] find seven common microRNAs that explain cognitive variability assayed in the water maze test.
Color map showing that the 7 microRNAs identified in (F) are present in the co‐expression modules significantly linked to cognition in healthy humans as described in Fig 1.
Heat map showing the enrichment of mRNA targets of the 7 microRNAs shown in (G) with a gene set identified by GWAS studies linking genes to cognition in healthy humans (Davies & Harris, 2018). Note that target genes of miR‐181a‐5p, miR‐148a‐3p, and miR‐146a‐5p are significantly overlapped in a hypergeometric test (fold enrichment > 1.5 and FDR <0.05). *P = 0.02, **P = 0.0008, ***P = 2.267e‐05.
Gene ontology analyses of miR‐181a‐5p, miR‐148a‐3p, and miR‐146a‐5p predicted targets reveal top significant processes linked to neuronal function and inflammation. Heatmap represents the top 5 significant biological processes. Color code represents adjusted P‐value.
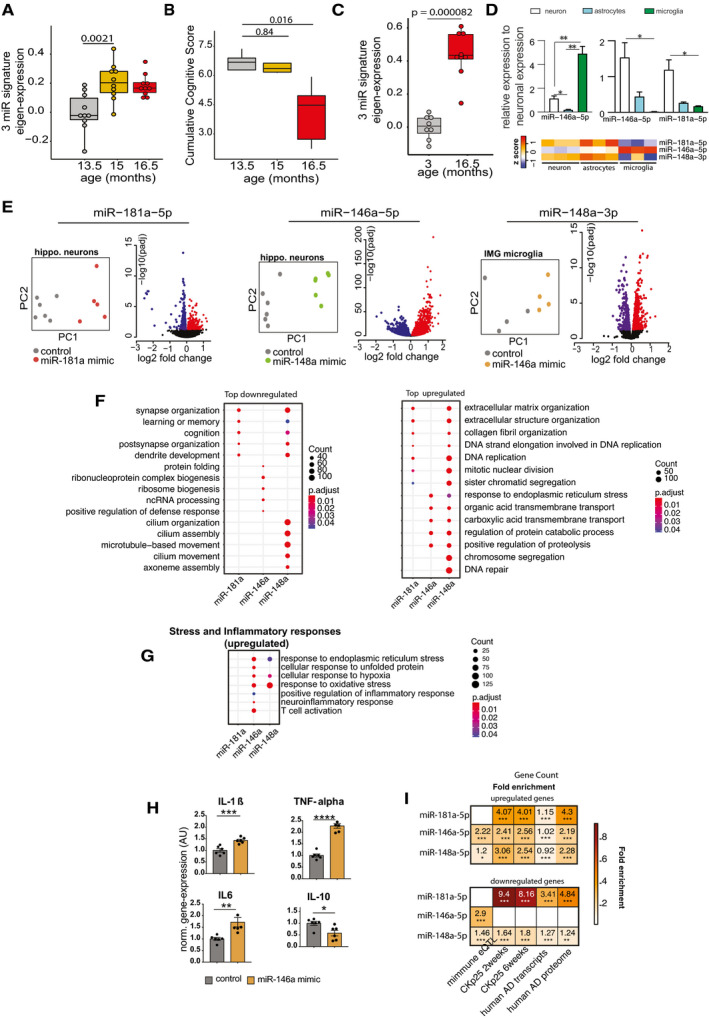
Eigenvalue of the 3‐microRNA signature measured in the mice that performed longitudinal water maze training. Note the significantly increased expression of the signature already at 15 months of age, suggesting that increased expression levels precede detectable cognitive impairment. Number of biological replicates = 10/group, unpaired two‐sided Wilcoxon rank test.
Cognitive score measured in the same mice reveals cognitive decline between 15 and 16,5 months of age (P‐value 0.0079). Number of biological replicates = 10/group, unpaired two‐sided Wilcoxon rank test.
Eigenvalue showing the expression of the 3‐microRNA signature in the hippocampus of 3 and cognitively impaired 16.5‐month‐old mice. Number of biological replicates (3 months = 8, 16.5 months = 9), unpaired two‐sided Wilcoxon rank test.
(Top) Relative enrichment of the three microRNAs across different cell types. Quantitative expression of microRNAs in primary hippocampal neurons, primary astrocytes, and primary microglia. miR‐146a‐5p is significantly enriched in microglia, while miR‐148a‐3p and miR‐181a‐5p are significantly enriched in neurons. N = 5/group, Two‐way ANOVA, Tukey's multiple comparisons test, *P < 0.05, **P < 0.01. Bars and error bar indicate mean ± SEM. (Bottom) miRNA expression in different cell types of mouse brain stem. The data were retrieved from Hoye et al (2017).
Overexpression of microRNAs in relevant cell types for 48 h followed by genome wide RNA‐seq analysis. miR‐181a‐5p was overexpressed in primary hippocampal neurons, while miR‐146a‐5p was overexpressed in microglia culture. Immortalized microglial cell line was used for this purpose. Given that miR‐148a‐3p was highly enriched in neurons (D), primary hippocampal neurons were treated with the corresponding miR‐148a‐3p mimic. PCA plot shows that the mimic‐ and control‐treated samples cluster distinguishingly separate from one another. Volcano plot displays the genes significantly deregulated in mimic‐treated samples compared with control samples (FDR < 0.05). Red color indicates the upregulated genes while the blue color represents the genes those were downregulated.
Gene ontology analyses for up‐ and downregulated genes. Panel F summarizes top significant up‐ and down‐regulated biological processes corresponding to each microRNA and comparison among them. Overexpression of miR‐181a‐5p and miR‐148a‐3p led to downregulation of genes related to cognition and synaptic functions, while downregulated genes due to increased expression of miR‐146a‐5p represent ncRNA processing, defense response, and protein folding mechanisms. The upregulated genes due to overexpression of these microRNAs represent several processes including extracellular matrix, endoplasmic reticulum stress.
Comparison of increased stress and inflammatory responses related significant biological processes among microRNAs. Interestingly, miR‐146a‐5p overexpression in microglia led to increased expression of inflammatory‐related genes. Overexpression of both miR‐146a‐5p and miR‐148a‐3p can increase stress‐related responses. Size of the dot represents the number of genes belonging to the given process, and the color represents the P‐value after multiple corrections.
qPCR analysis confirms the overexpression of pro‐inflammation‐related genes (IL‐1β, IL‐6, TNF‐alpha) due to overexpression of miR‐146a‐5p. Expression of anti‐inflammatory gene, IL‐10 was downregulated in mimic‐treated cells compared with the controls. Unpaired t‐tests, two‐tailed, ****P < 0.0001, ***P < 0.001, **P < 0.01, *P < 0.05. Bars and error bar indicate mean ± SEM. Number of biological replicates: 5–6/group.
Hypergeometric overlap of the up‐ and downregulated genes (E) with gene sets from different datasets. We calculated enrichment of the deregulated genes relative to those gene sets and used a Fisher's exact test P‐value after multiple adjustments to estimate the significance of the overlap. Immune‐related genes based on expression quantitative loci (eQTL) were retrieved from a previous study. RNA‐seq data from CK‐p25 mice at 2 and 6 weeks after induction were retrieved from GSE65159, and up‐ and downregulated genes compared with littermate controls were determined after differential expression (significant genes; adjusted P‐value<0.05). Up‐ and downregulated transcripts in human AD patients compared with control subjects were determined by analysis of the available data (GSE44770). Proteins those are over‐ and reduced‐expressed in AD patients compared with controls were retrieved from a previous study. Overlap analysis for the up‐ and downregulated genes due to overexpression of microRNAs was performed to those separately from the disease conditions. Human orthologs of the mouse deregulated genes were used to perform the overlap analysis in human datasets. Color code represents fold enrichment. *FDR < 0.05, **FDR < 0.01, ***FDR < 0.001.
- A
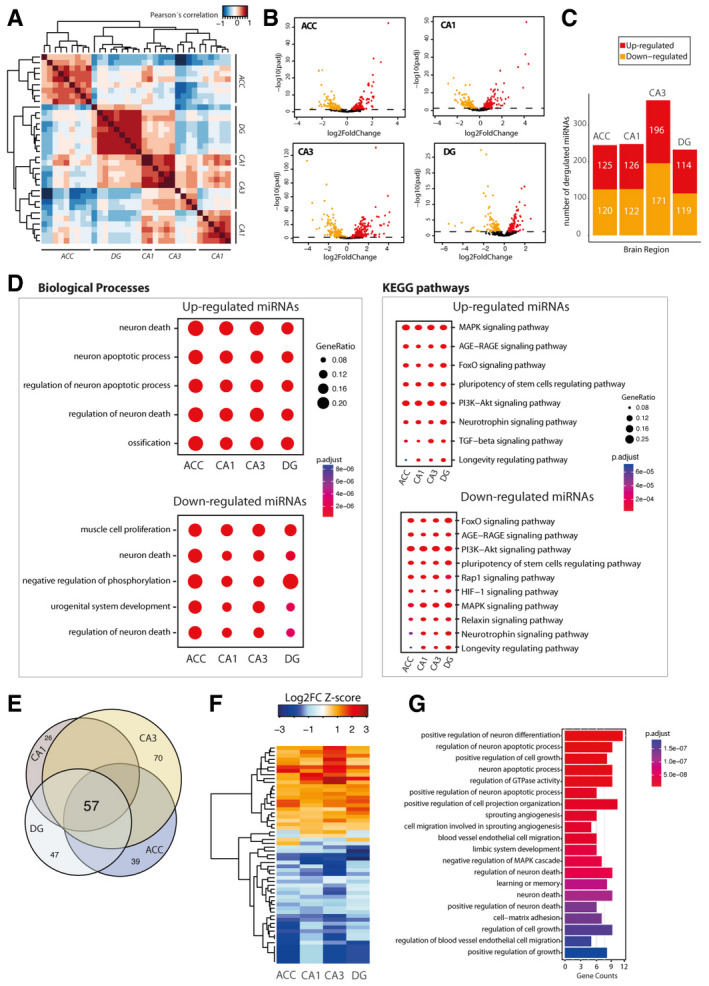
Pearson’s coefficient‐based correlation followed by unsupervised clustering of all small RNA‐seq data from different brain regions (ACC; CA1; CA3; DG) in young mice reveals brain region‐specific expression of the microRNAs that were particularly obvious for the ACC versus the hippocampal sub‐regions and the DG versus CA1 and CA3. These region‐specific differences were, however, mainly attributed to different expression values since the majority of the microRNAs, namely 176 microRNAs, could be detected at reliable levels in all investigated brain regions.
- B
Volcano plots showing differential expression of microRNAs in the different brain regions when comparing young versus old mice.
- C
Bar plots showing the number of up and downregulated microRNAs in the investigated brain regions.
- D
Comparison of gene ontology and functional pathways of experimentally confirmed target genes of the deregulated microRNAs in the investigated brain regions. Pathway is generally linked to neuronal death and longevity pathways.
- E
Venn diagram showing that 57 microRNAs are commonly deregulated in the aging brain.
- F
Heat map showing hierarchical clustering of the 57 commonly deregulated microRNAs based on Log2 fold change Z‐score.
- G
Top 20 biological processes affected by the confirmed target genes of the 57 commonly deregulated microRNAs in the aging brain.
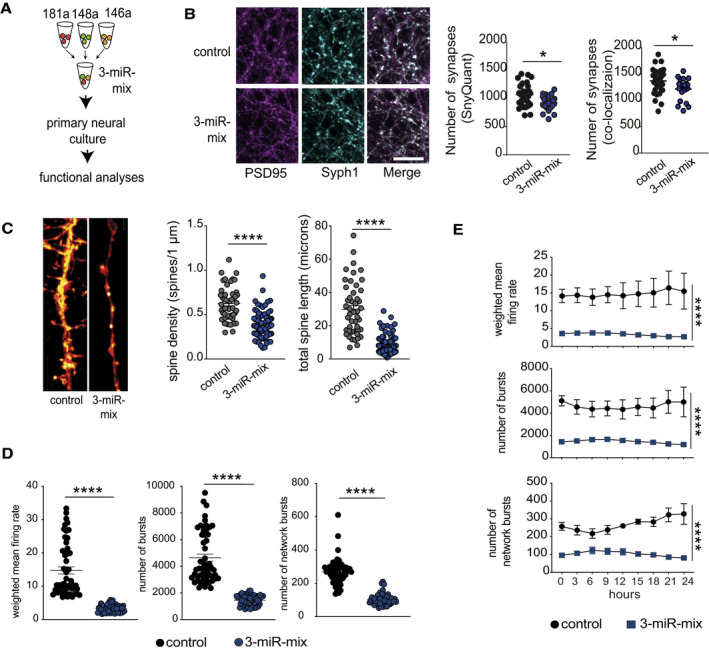
Primary hippocampal neurons were treated with a mixture of 3‐miR mimic or control oligonucleotides, and follow‐up analyses (imaging, electrical recordings) were performed.
Functional mature synapses were quantified via co‐localizations of pre‐ (synaptophysin 1) and the postsynaptic (PSD‐95) markers and compared between 3‐miR‐mix and control groups. Scale bar: 10 μm. Two independent methods (SynQuant and Colocalization) were used for quantification. 3‐miR‐mix reduced the number of functional synapses compared with controls (n = 24–30 images)
Dendrite labeling and quantification. Dendritic spines were stained with Dil. Scale bar: 10 μm. Spine density and total spine length are substantially reduced in 3‐miR‐mix‐treated primary neurons compared to those treated with scrambled RNA (n = 49–97 images)
Hippocampal neurons were cultured in a multielectrode array (MEA) plate equipped with sixteen electrodes. Spontaneous activity of the neurons was recorded at every 3 h (10 min/session) for 24 h. Weighted mean firing rate, number of bursts, and network bursts are significantly decreased in neurons treated with 3‐miR‐mix compared with control.
The aberrant neuronal firing activity (weighted mean firing rate) and reduced number of bursts and network bursts were observed across the 24 h of time period.
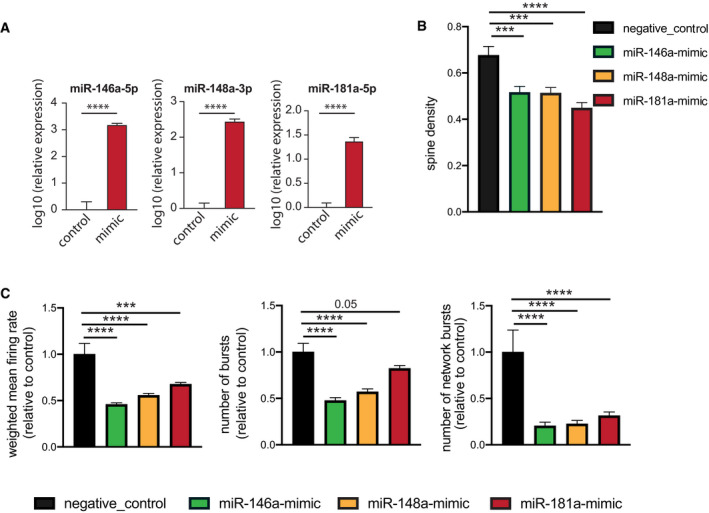
3‐miR‐mix containing (miR‐146a‐5p, miR‐181a‐5p, miR‐148a‐3p mimics) was applied on primary hippocampal neurons at DIV10, and its effect was compared to neurons treated with a scrambled control RNA. After 48 h, cells were prepared for RNA Isolation. qPCR data from isolated RNA reveal increased expression of miR‐146a‐5p (left), miR‐148a‐3p (middle), and miR‐181a‐5p (right). Unpaired t‐test, two‐tailed, n = 5/group. ****P < 0.0001. Data are normalized to control and log10 scaled. Error bar indicates mean ± SEM.
Primary hippocampal neurons were transfected with scrambled/individual microRNA mimics at DIV7, and dendritic spines were stained with Dil at DIV10 for dendrite labeling and quantification. Spine density is substantially reduced for mimic‐treated primary neurons compared to those treated with scrambled RNA. Barplots showing spine density among groups. N = 20 dendritic segments/group, one‐way ANOVA, Dunnett's multiple comparisons test, ***P < 0.001, ****P < 0.0001.
Hippocampal neurons were cultured in a multielectrode array (MEA) plate equipped with sixteen electrodes. Individual microRNA mimic was applied at DIV7, and a downstream neuronal activity was measured at DIV10 and compared to scrambled control‐treated neurons. Weighted mean firing rate, number of bursts, number of network bursts. 6 replicates/group recorded 8× in every 3 h, each record lasting for 10 min. N = 48, one‐way ANOVA, Dunnett's multiple comparisons test, ***P < 0.001, ****P < 0.0001. Error bars indicate mean ± SEM.
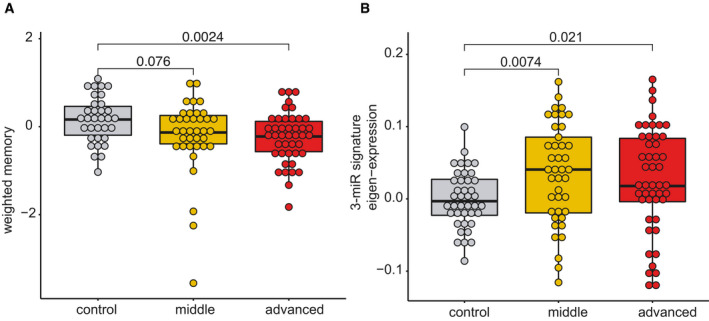
Although care has to be taken when comparing data from mice to humans, previous work suggests that 12‐month‐old mice are comparable to 40‐year‐old humans and that 1.5 months in a mouse’s lifetime approximately reflect 5 years of lifetime in humans (Dutta, 2016). Thus, our longitudinal experiment in mice (see Figs 2 and 3A and B) could be compared best to humans from 40 to 55 years of age. This is in line with previous cross‐sectional and longitudinal studies in humans, reporting that impairments of certain cognitive abilities become evident from 40 years of age while after 54 years of age, most cognitive domains significantly decline (Schaie, ; Park et al, ; Hedden & Gabrieli, ; Park & Reuter‐Lorenz, ; Salthouse, ; Singh‐Manoux et al, 2012). Therefore, we recruited healthy individuals aged between 30 and 77 years of age that were subjected to blood collection and the same cognitive phenotyping as in our discovery cohort (See Fig 1). Based on previous data (Schaie, ; Park et al, ; Hedden & Gabrieli, ; Park & Reuter‐Lorenz, ; Salthouse, ; Singh‐Manoux et al, 2012), we divided the individuals into a “control group” that is expected to exhibit full cognitive functioning (30–40 years of age), a “middle‐age group” (41–53 years of age) that is expected to show very mild signs of cognitive decline, and an “advanced age group” (54–77 years of age) that are expected to display significant cognitive decline. Despite the fact that older individuals exhibit cognitive impairments, we like to reiterate that all of these individuals were healthy and none of them suffered from mild cognitive impairment or dementia. We confirmed a non‐significant trend for reduced cognition in the “middle‐age group” that became significant in the “advanced age group”.
Next, we performed small RNA sequencing from all collected samples and analyzed the microRNA expression. Similar to the data obtained in mice, co‐expression of the 3‐miR signature was significantly increased already in the “middle‐age group” and plateaued in “advanced age group” when compared to individuals 30–40 years of age. Although these data are cross‐sectional, they are in line with our observation from the longitudinal study in mice and suggest that also in humans, expression of the 3‐microRNA signature might increase in blood prior to the detection of significant cognitive impairment, at least in the employed experimental design. Kruskal–Wallis test, n = 40–47 human subjects.
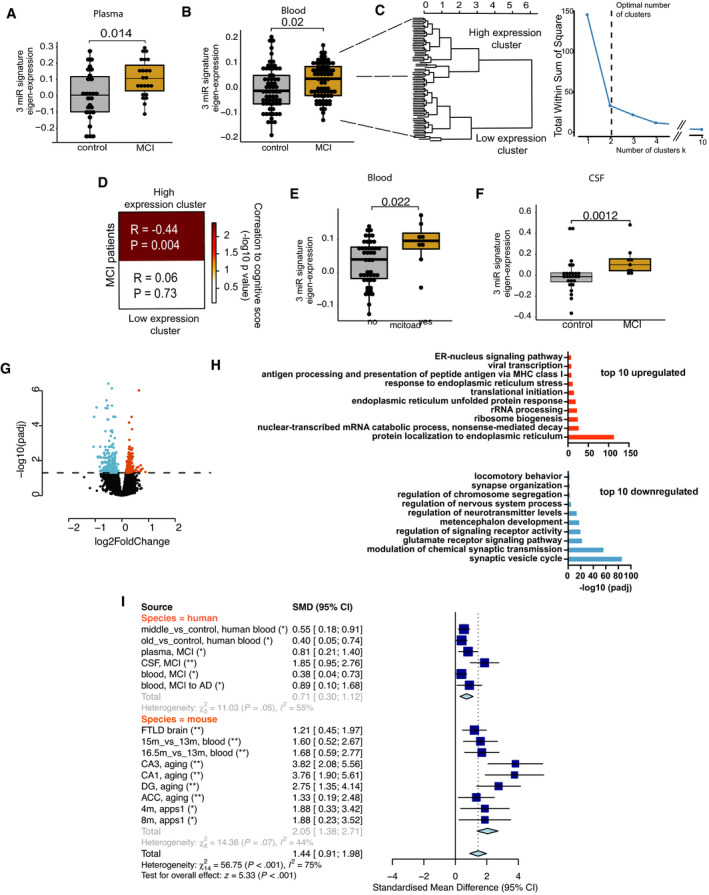
- A–F
All data have been adjusted for age, gender, and other latent covariates for downstream eigenvalue calculation. (A) Eigenvalue showing the increased expression of the 3‐microRNA signature in blood plasma samples of age‐matched MCI (n = 23) patients compared with controls (n = 27). (B) Expression of 3‐microRNA signature is increased in PAXgene blood samples of MCI patients (n = 71) compared with controls (n = 65) from the DELCODE cohort. (C) Clustering of eigen expression identifies two expression clusters in MCI patients based on elbow method of detecting optimum number of clusters. (D) Patients representing the cluster with higher expression of 3‐miR eigenvalue show negative correlation with their weighted cognitive score (cor = 0.444, P = 0.004). In contrast, patients with low expression of 3‐miR signature did not show significant correlation with the cognitive score (P = 0.73). (E) Eigenvalue showing the expression of the 3‐microRNA signature in MCI patients for those the follow‐up diagnostic data assessed 2 years after was available. 15% of these MCI patients developed Alzheimer´s disease (AD), while the rest 85% patients remained with MCI (stable MCI). The boxplot depicts the increased expression levels of 3‐miR signature in patients who converted to AD (n = 8) compared with those that had stable MCI (n = 47). (F) Increased expression of 3‐microRNA signature in cerebrospinal fluid (CSF) of MCI patients (n = 9) compared with controls (n = 26). Wilcoxon rank test, P‐value is given on the corresponding panel. In the boxplots in (A, B, E, F), the centerline indicates the median, while the upper and lower lines represent the 75th and 25th percentiles, respectively. The whiskers represent the smallest and largest values in the 1.5× interquartile range.
- G
Human bioengineered neuronal organoids (BENOs) were treated at DIV 60 with the 3‐miR‐mix or corresponding controls for 24 h, and RNA‐seq was performed from prepared RNA. Volcano plot displays the significant deregulated genes in BENOs after over‐expressing the 3‐miR‐mix (FDR < 0.05).
- H
Gene ontology shows top 10 significant up‐ and downregulated processes based on the differentially expressed genes. X‐axis represents the ‐log10 of adjusted P‐value.
- I
A meta‐analysis for 3‐microRNA signature was performed across different datasets. The upper part shows the human datasets, while the lower part shows the investigated mouse datasets. In addition to the datasets presented in our study, we also employed cortical small RNAome data (GSE8998) from a fronto‐temporal dementia (FTLD) mouse model at a presymptomatic state (Swarup et al, 2018). Standardized mean difference (SMD) of zero indicates no effect. Deviation from zero would indicate either an increase or a decrease in the eigen expression for the 3‐microRNA signature. Asterisks represent the adjusted P‐value across studies (length = 15). *P < 0.05, **P < 0.01. Standardized mean difference (SMD) of 3‐microRNA signature is given along with the corresponding lower and upper intervals. A large pooled standardized mean difference (1.44) for 3‐microRNA signature was observed across species, and the overall effect in both species (Z = 5.33) was highly significant (P < 0.001).
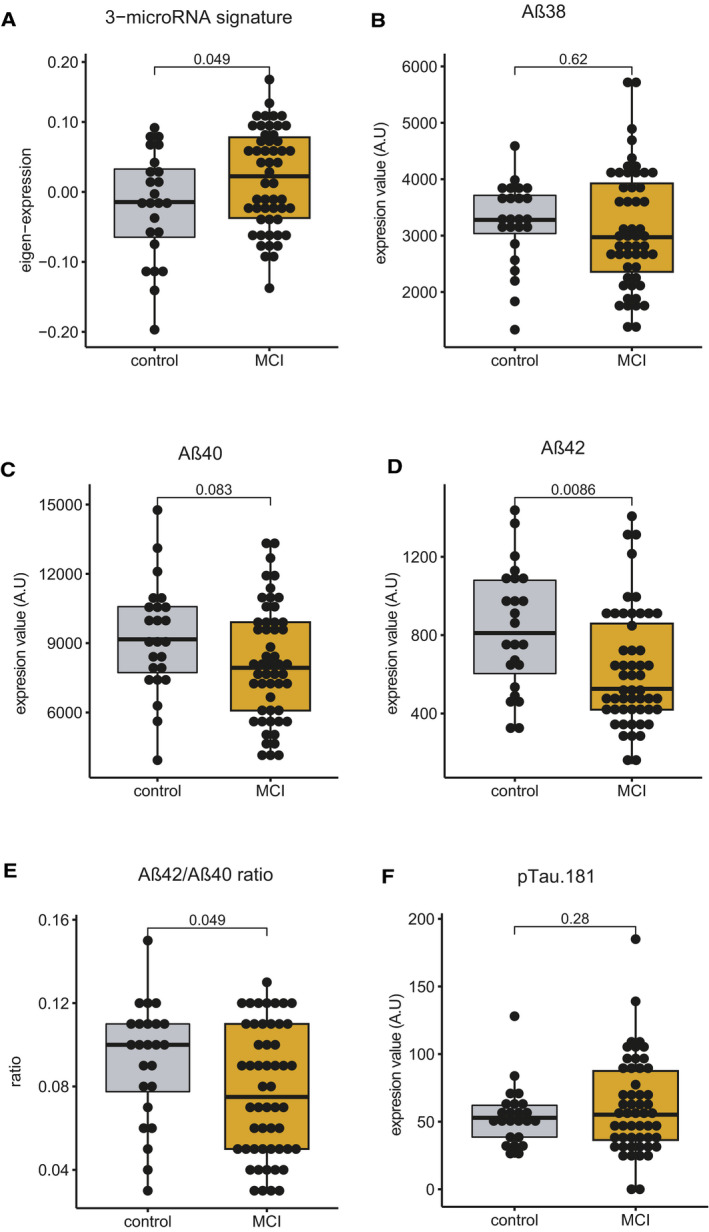
- A–E
Eigenvalue of 3‐microRNA signature in blood is significantly increased in MCI patients compared with controls. Levels of (B) Aβ38 and (C) Aβ40 did not change significantly between patients and control subjects. Both (D) Aβ42 alone and (E) Aβ42/40 ratio were significantly different between control and MCI patients.
- F
There was no statistically significant difference in the levels of phosphorylated Tau 181 when comparing MCI patient versus controls. Since Tau could be considered a marker for neurodegeneration, it is not unexpected that changes in Aβ precede changes in Tau pathology. Unpaired t‐tests, two‐tailed. These data suggest that the 3‐microRNA signature is comparable to more invasive established AD biomarker.
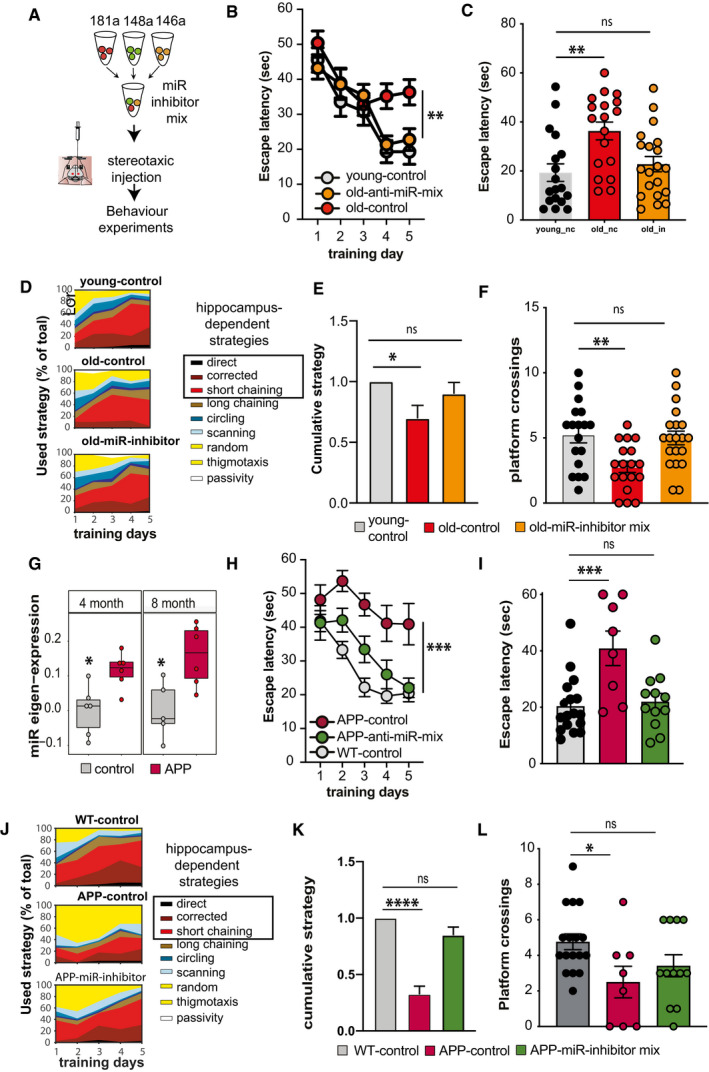
Experimental design. Inhibitor mixture for 3 microRNAs (anti‐miR‐mix), namely miR‐181a‐5p, miR‐148‐3p, and miR‐146a‐5p was injected into the hippocampal CA of male wild‐type mice prior to behavioral testing. As control, scrambled siRNAs were injected as described above. Experiments were performed in two mouse models representing aging and Alzheimer´s disease (AD).
Escape latency during the water maze training comparing 3‐month‐old (young‐control, n = 18) mice and 16,5‐month‐old (old‐control, n = 18) mice injected with scrambled control oligonucleotides and 16,5‐month‐old mice injected with microRNA inhibitors (old miR‐inhibitor mix, n = 20). Bars and error bars indicate mean ± SEM.
Escape latency on final day of water maze training was impaired improved in old mice treated with the microRNA inhibitors mix. Young‐control (n = 18, 19.3 ± 15.23, mean ± SD); old‐control (n = 18, 36.31 ± 15.38, mean ± SD); old‐inhibitor (n = 20, 22.78 ± 13.85, mean ± SD).
Depiction of the search strategies during the water maze training.
The cumulative cognitive score calculated for each day on the basis of hippocampal‐dependent strategies was significantly impaired when comparing mice old‐control mice to young‐control mice. Data are normalized to young‐control group. Bars and error bars indicate mean ± SEM. Number of mice: young‐control, n = 18; old‐control, n = 18; old miR‐inhibitor mix, n = 20.
Number of visits to the platform during the probe test. young‐control (5.2 ± 2.5, mean ± SD); old‐control (2.7 ± 1.83, mean ± SD); old‐inhibitor (5.0 ± 2.3, mean ± SD). All mice were male. Number of mice: young‐control, n = 18; old‐control, n = 18; old miR‐inhibitor mix, n = 20.
Eigenvalue showing the expression of the 3‐microRNA signature in the hippocampus of 4‐ and 8‐month‐old APPPS1‐21 mice. The centerline indicates the median, while the upper and lower lines represent the 75th and 25th percentiles, respectively. The whiskers represent the smallest and largest values in the 1.5× interquartile range. Number of mice: 5–6/group.
Escape latency during the water maze training comparing 7‐month‐old wild‐type mice (WT control, n = 17, male: 9, female: 8) and APPPS‐21 mice (APP‐control, n = 8, male: 6, female: 2) injected with scrambled control oligonucleotides and APPPS1‐21 mice injected with microRNA inhibitors (APP miR‐inhibitor mix, n = 12, male: 8, female: 4). Bars and error bars indicate mean ± SEM.
Escape latency measured on the last day of water maze training was reduced in APP‐control mice. However, learning performance was rescued in APP miR‐inhibitor mix mice. WT control: 20.43 ± 10.33 (mean ± SD), APP‐control: 40.92 ± 17.33 (mean ± SD), and APP miR‐inhibitor mix: 22.04 ± 9.96 (mean ± SD). Sex did not affect the data. Number of mice: WT control, n = 17, male: 9, female: 8; APP‐control, n = 8, male: 6, female: 2; APP miR‐inhibitor mix, n = 12, male: 8, female: 4.
Depiction of the search strategies during the water maze training in experimental groups.
The cumulative cognitive score calculated for each day on the basis of hippocampal‐dependent strategies was significantly impaired when comparing WT control mice to APP‐control mice. Data are normalized to WT control group. Bars and error bars indicate mean ± SEM. Number of mice: WT control, n = 17, male: 9, female: 8; APP‐control, n = 8, male: 6, female: 2; APP miR‐inhibitor mix, n = 12, male: 8, female: 4.
Comparison of the number of visits to the platform during probe test. WT control: 4.76 ± 1.82 (mean ± SD), APP‐control: 2.5 ± 2.5 (mean ± SD), and APP miR‐inhibitor mix: 3.41 ± 2.15 (mean ± SD). Bars and error bars indicate mean ± SEM. Number of mice: WT control, n = 17, male: 9, female: 8; APP‐control, n = 8, male: 6, female: 2; APP miR‐inhibitor mix, n = 12, male: 8, female: 4.
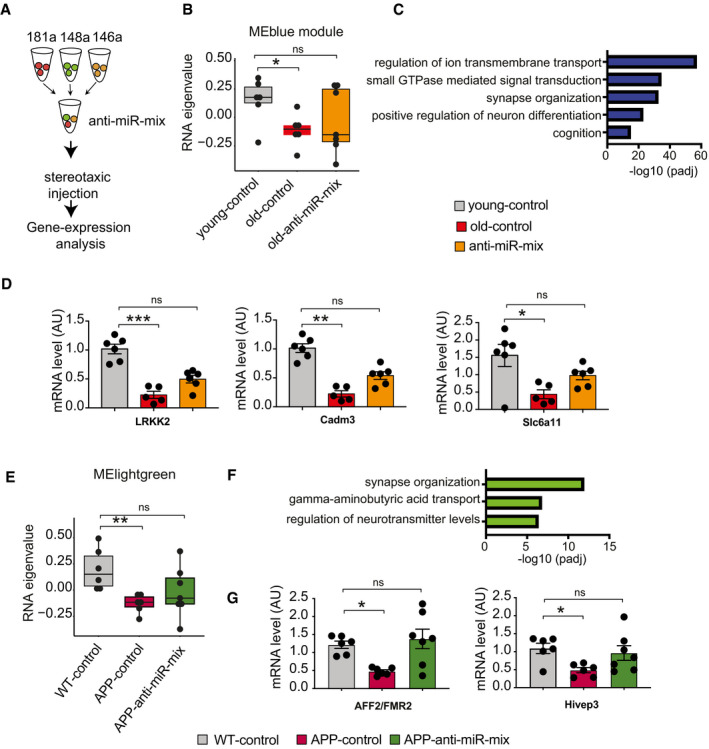
Experimental outline. Anti‐miR‐mix of the 3 microRNAs was injected into the dorsal hippocampus of the mice as previously described. RNA‐seq data were generated from dorsal hippocampal tissues and compared to those treated with control scrambled oligonucleotides.
Weighted gene co‐expression analysis of hippocampal RNA‐seq data identified the MEblue gene cluster that is decreased when comparing 3‐month‐old mice (young‐control) to cognitively impaired 16.5‐month‐old mice (old‐control) with a scramble control oligonucleotide injected. Treating old mice with the miR‐inhibitor mix (old miR‐inhibitor mix) reinstated gene expression of this cluster, at least in part (n = 6–7, Kruskal–Wallis test).
Gene ontology reveals that the MEblue cluster is linked to cognition and synapse organization.
qPCR assay for several synaptic genes (LRKK2, Cadm3, and Slc6a11) confirms reinstatement of gene expression with anti‐miR‐mix (n = 5–7, Kruskal–Wallis test).
Weighted gene co‐expression analysis of hippocampal RNA‐seq data identified a MElightgreen gene cluster that is decreased when comparing wild‐type control (WT control) to APPPS1‐21 mice (APP‐control) and was reinstated in APPPS1‐21 mice‐treated miR‐inhibitor mix (n = 6–7, Kruskal–Wallis test).
Gene ontology reveals that the MElightgreen cluster is linked to cognition and synapse organization.
qPCR data show rescue of AFF2/FMR2 and Hivep3 expression in APP/PS1 mice treated with inhibitor cocktail (n = 6–7, Kruskal–Wallis test).
Comment in
-
microRNAs trip down memory lane.EMBO Mol Med. 2021 Nov 8;13(11):e14997. doi: 10.15252/emmm.202114997. Epub 2021 Oct 20. EMBO Mol Med. 2021. PMID: 34672084 Free PMC article.
References
-
- Abbott A, Dolgin E (2016) Leading Alzheimer’s theory survives drug failure. Nature 540: 15–16 - PubMed
-
- Ansari A, Maffioletti E, Milanesi E, Marizzoni M, Frisoni GB, Blin O, Richardson JC, Bordet R, Forloni G, Gennarelli M et al (2019) miR‐146a and miR‐181a are involved in the progression of mild cognitive impairment to Alzheimer's disease. Neurobiol Aging 82: 102–109 - PubMed
Publication types
MeSH terms
Substances
LinkOut - more resources
Full Text Sources
Other Literature Sources
Medical
Molecular Biology Databases
