

A data-driven disease progression model of fluid biomarkers in genetic frontotemporal dementia
- PMID: 34633446
- PMCID: PMC9166533
- DOI: 10.1093/brain/awab382
A data-driven disease progression model of fluid biomarkers in genetic frontotemporal dementia
Abstract
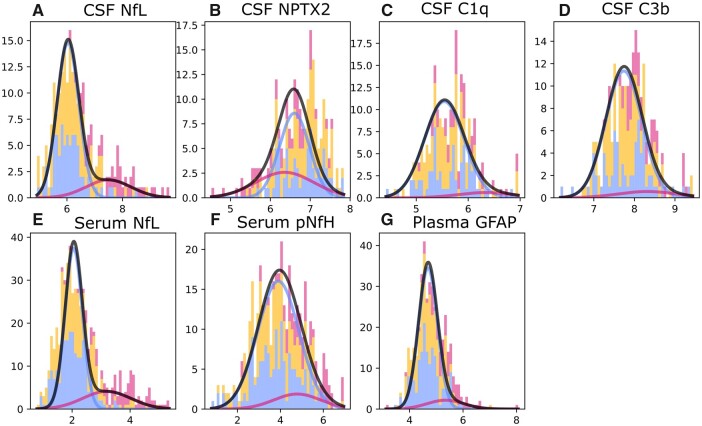
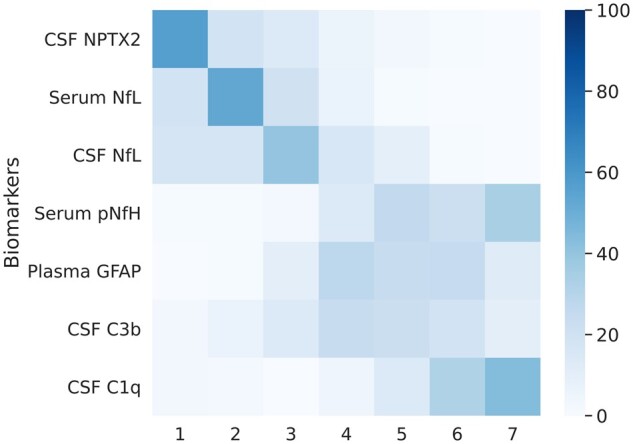
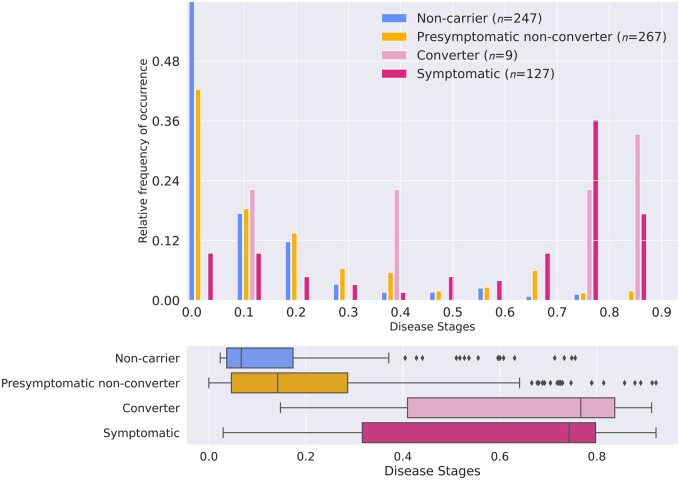
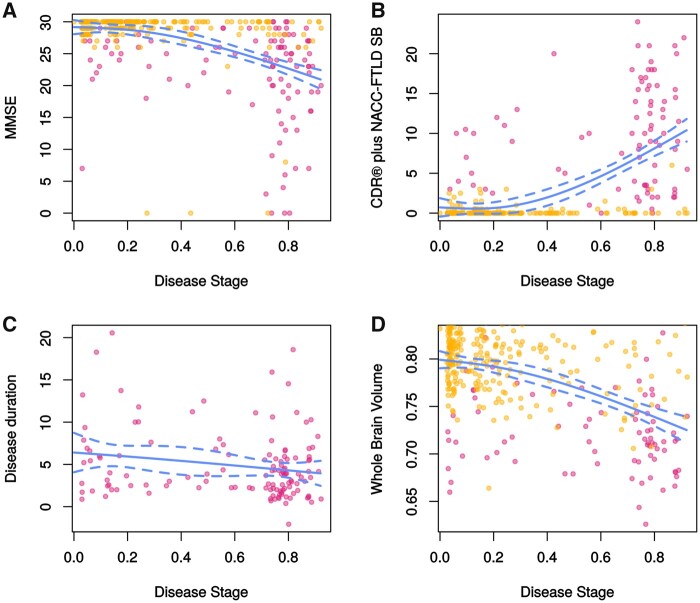
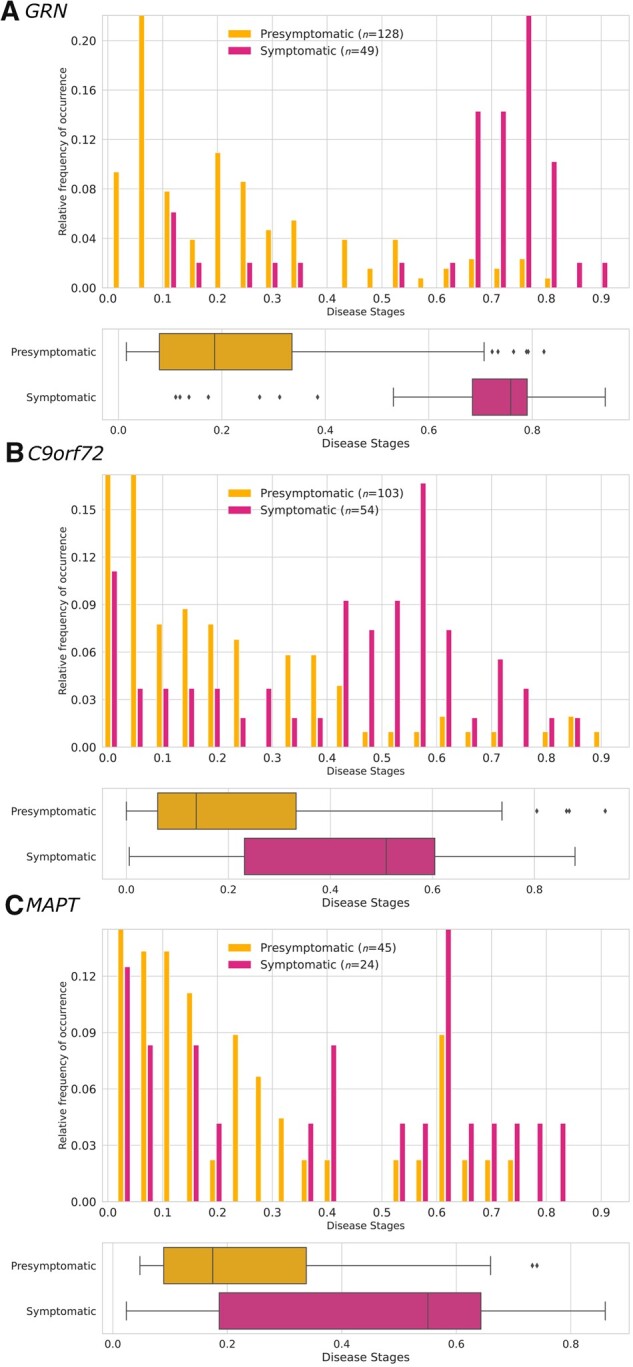
Several CSF and blood biomarkers for genetic frontotemporal dementia have been proposed, including those reflecting neuroaxonal loss (neurofilament light chain and phosphorylated neurofilament heavy chain), synapse dysfunction [neuronal pentraxin 2 (NPTX2)], astrogliosis (glial fibrillary acidic protein) and complement activation (C1q, C3b). Determining the sequence in which biomarkers become abnormal over the course of disease could facilitate disease staging and help identify mutation carriers with prodromal or early-stage frontotemporal dementia, which is especially important as pharmaceutical trials emerge. We aimed to model the sequence of biomarker abnormalities in presymptomatic and symptomatic genetic frontotemporal dementia using cross-sectional data from the Genetic Frontotemporal dementia Initiative (GENFI), a longitudinal cohort study. Two-hundred and seventy-five presymptomatic and 127 symptomatic carriers of mutations in GRN, C9orf72 or MAPT, as well as 247 non-carriers, were selected from the GENFI cohort based on availability of one or more of the aforementioned biomarkers. Nine presymptomatic carriers developed symptoms within 18 months of sample collection ('converters'). Sequences of biomarker abnormalities were modelled for the entire group using discriminative event-based modelling (DEBM) and for each genetic subgroup using co-initialized DEBM. These models estimate probabilistic biomarker abnormalities in a data-driven way and do not rely on previous diagnostic information or biomarker cut-off points. Using cross-validation, subjects were subsequently assigned a disease stage based on their position along the disease progression timeline. CSF NPTX2 was the first biomarker to become abnormal, followed by blood and CSF neurofilament light chain, blood phosphorylated neurofilament heavy chain, blood glial fibrillary acidic protein and finally CSF C3b and C1q. Biomarker orderings did not differ significantly between genetic subgroups, but more uncertainty was noted in the C9orf72 and MAPT groups than for GRN. Estimated disease stages could distinguish symptomatic from presymptomatic carriers and non-carriers with areas under the curve of 0.84 (95% confidence interval 0.80-0.89) and 0.90 (0.86-0.94) respectively. The areas under the curve to distinguish converters from non-converting presymptomatic carriers was 0.85 (0.75-0.95). Our data-driven model of genetic frontotemporal dementia revealed that NPTX2 and neurofilament light chain are the earliest to change among the selected biomarkers. Further research should investigate their utility as candidate selection tools for pharmaceutical trials. The model's ability to accurately estimate individual disease stages could improve patient stratification and track the efficacy of therapeutic interventions.
Keywords: biomarker; disease progression model; event-based modelling; frontotemporal dementia; neurofilament light chain.
© The Author(s) (2021). Published by Oxford University Press on behalf of the Guarantors of Brain.
Figures
References
-
- Lashley T, Rohrer JD, Mead S, Revesz T.. Review: An update on clinical, genetic and pathological aspects of frontotemporal lobar degenerations. Neuropathol Appl Neurobiol. 2015;41(7):858–881. - PubMed
-
- Seelaar H, Rohrer JD, Pijnenburg YA, Fox NC, van Swieten JC.. Clinical, genetic and pathological heterogeneity of frontotemporal dementia: A review. J Neurol Neurosurg Psychiatry. 2011;82(5):476–486. - PubMed
-
- Desmarais P, Rohrer JD, Nguyen QD, et al. . Therapeutic trial design for frontotemporal dementia and related disorders. J Neurol Neurosurg Psychiatry. 2019;90(4):412–423. - PubMed
