. 2022 Apr;75(4):955-967.
doi: 10.1002/hep.32197. Epub 2021 Dec 13.

Gut microbiome features associated with liver fibrosis in Hispanics, a population at high risk for fatty liver disease

Affiliations

Gut microbiome features associated with liver fibrosis in Hispanics, a population at high risk for fatty liver disease

Suet-Ying Kwan et al. Hepatology. 2022 Apr.

Abstract

Background and aims: Hispanics are disproportionately affected by NAFLD, liver fibrosis, cirrhosis, and HCC. Preventive strategies and noninvasive means to identify those in this population at high risk for liver fibrosis, are urgently needed. We aimed to characterize the gut microbiome signatures and related biological functions associated with liver fibrosis in Hispanics and identify environmental and genetic factors affecting them.

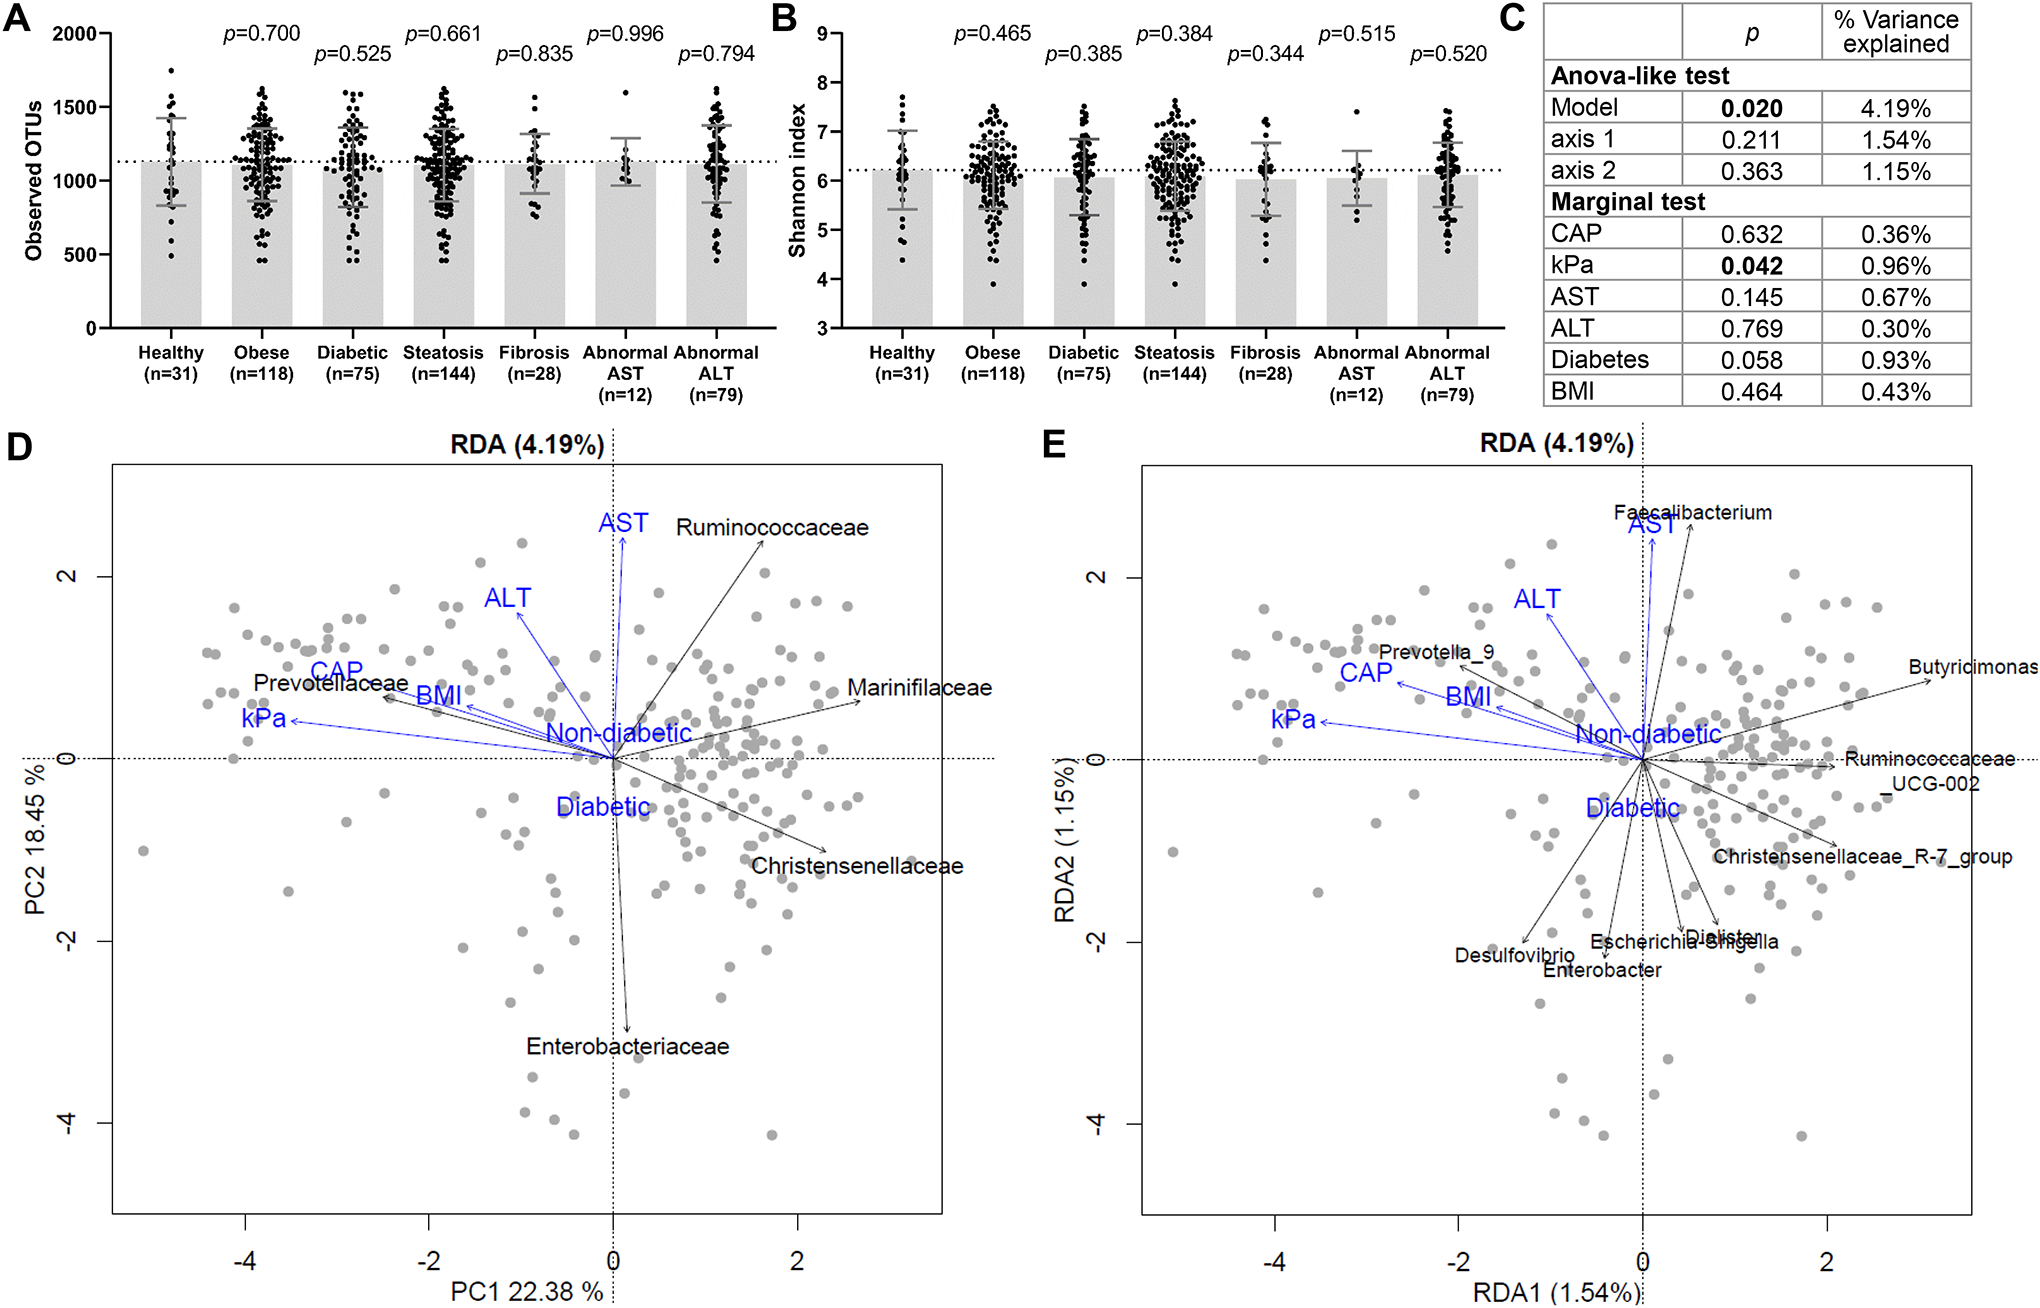
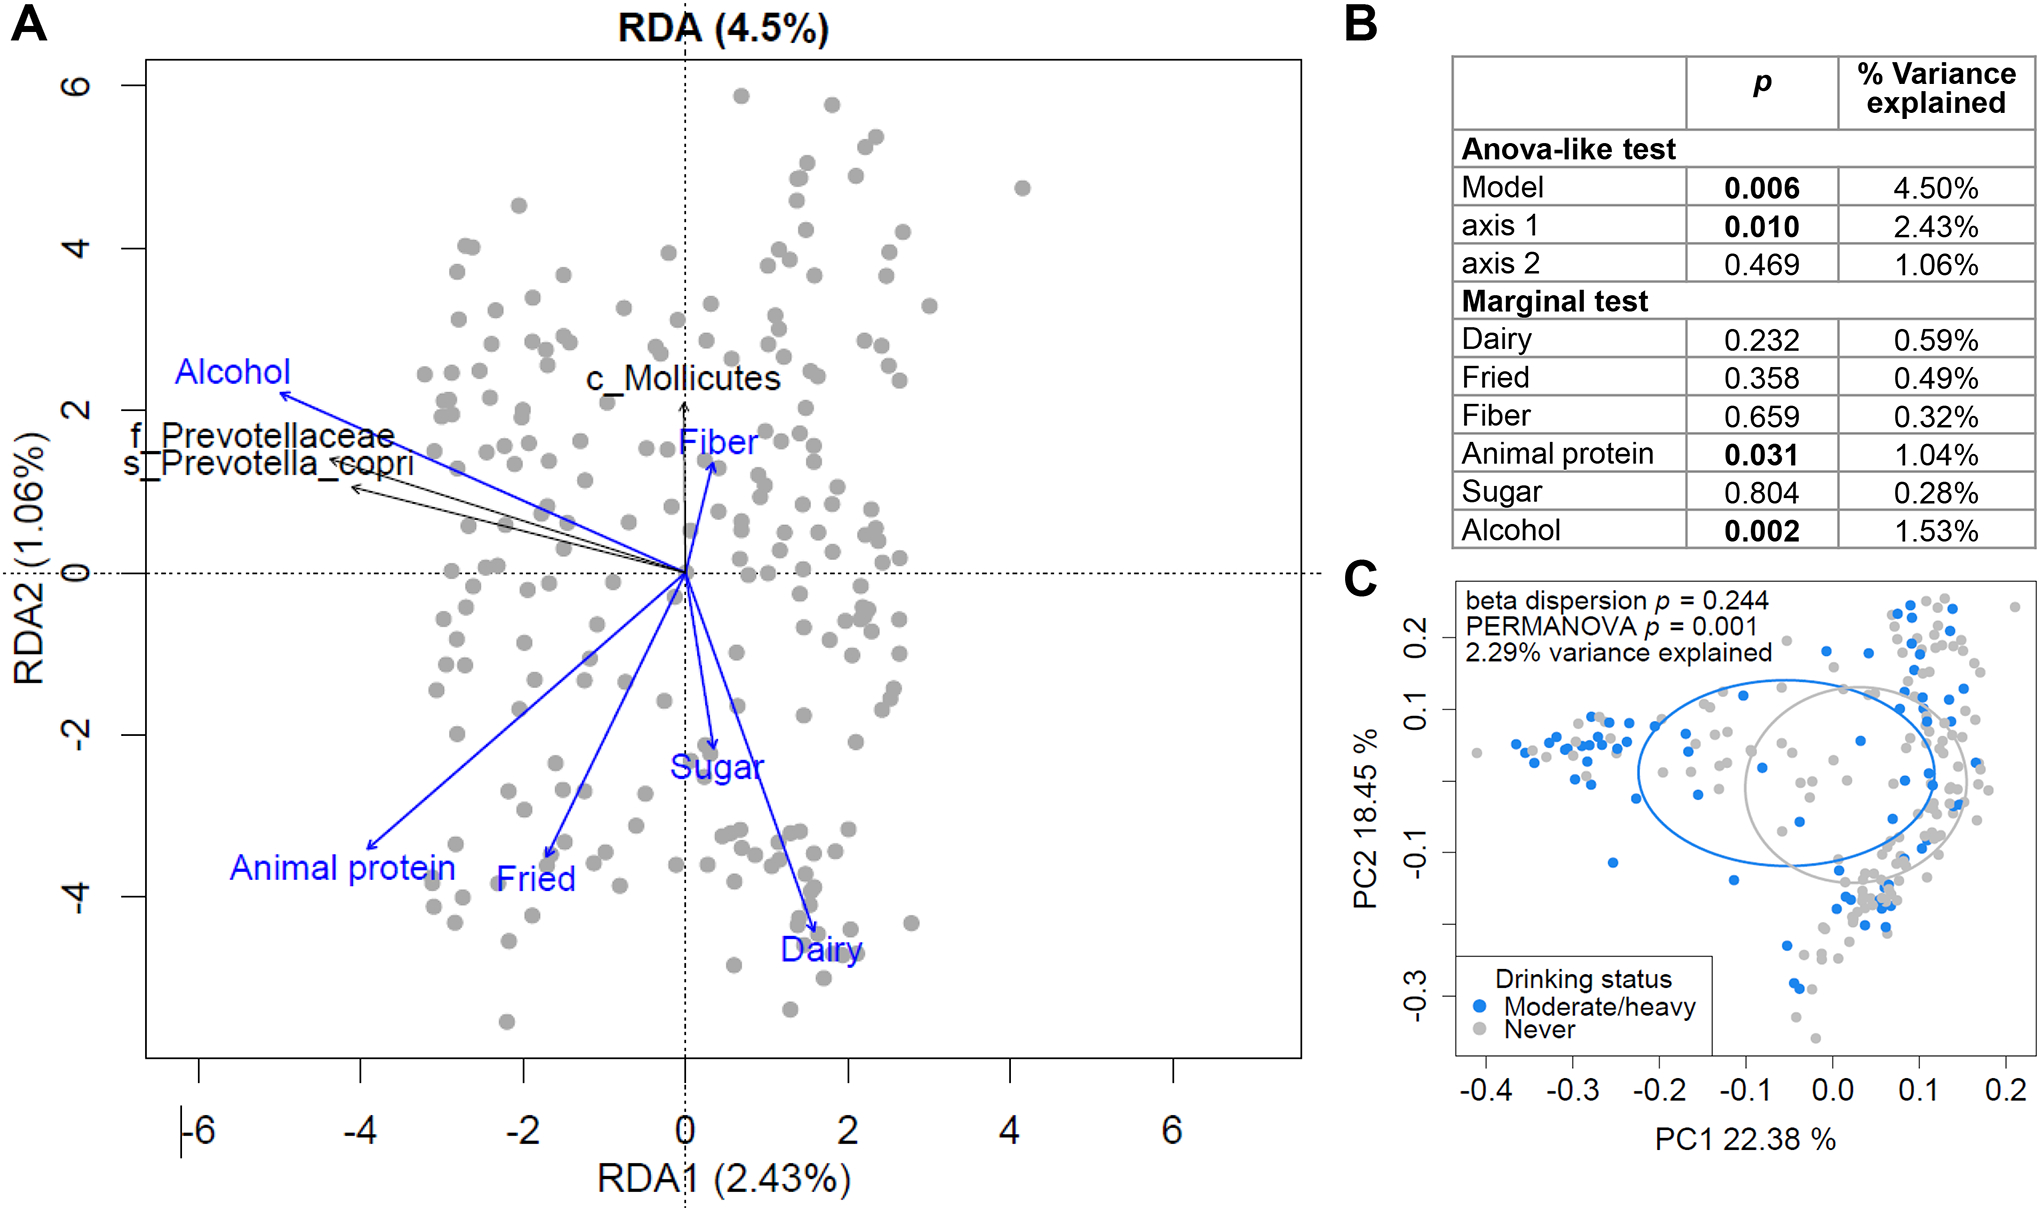
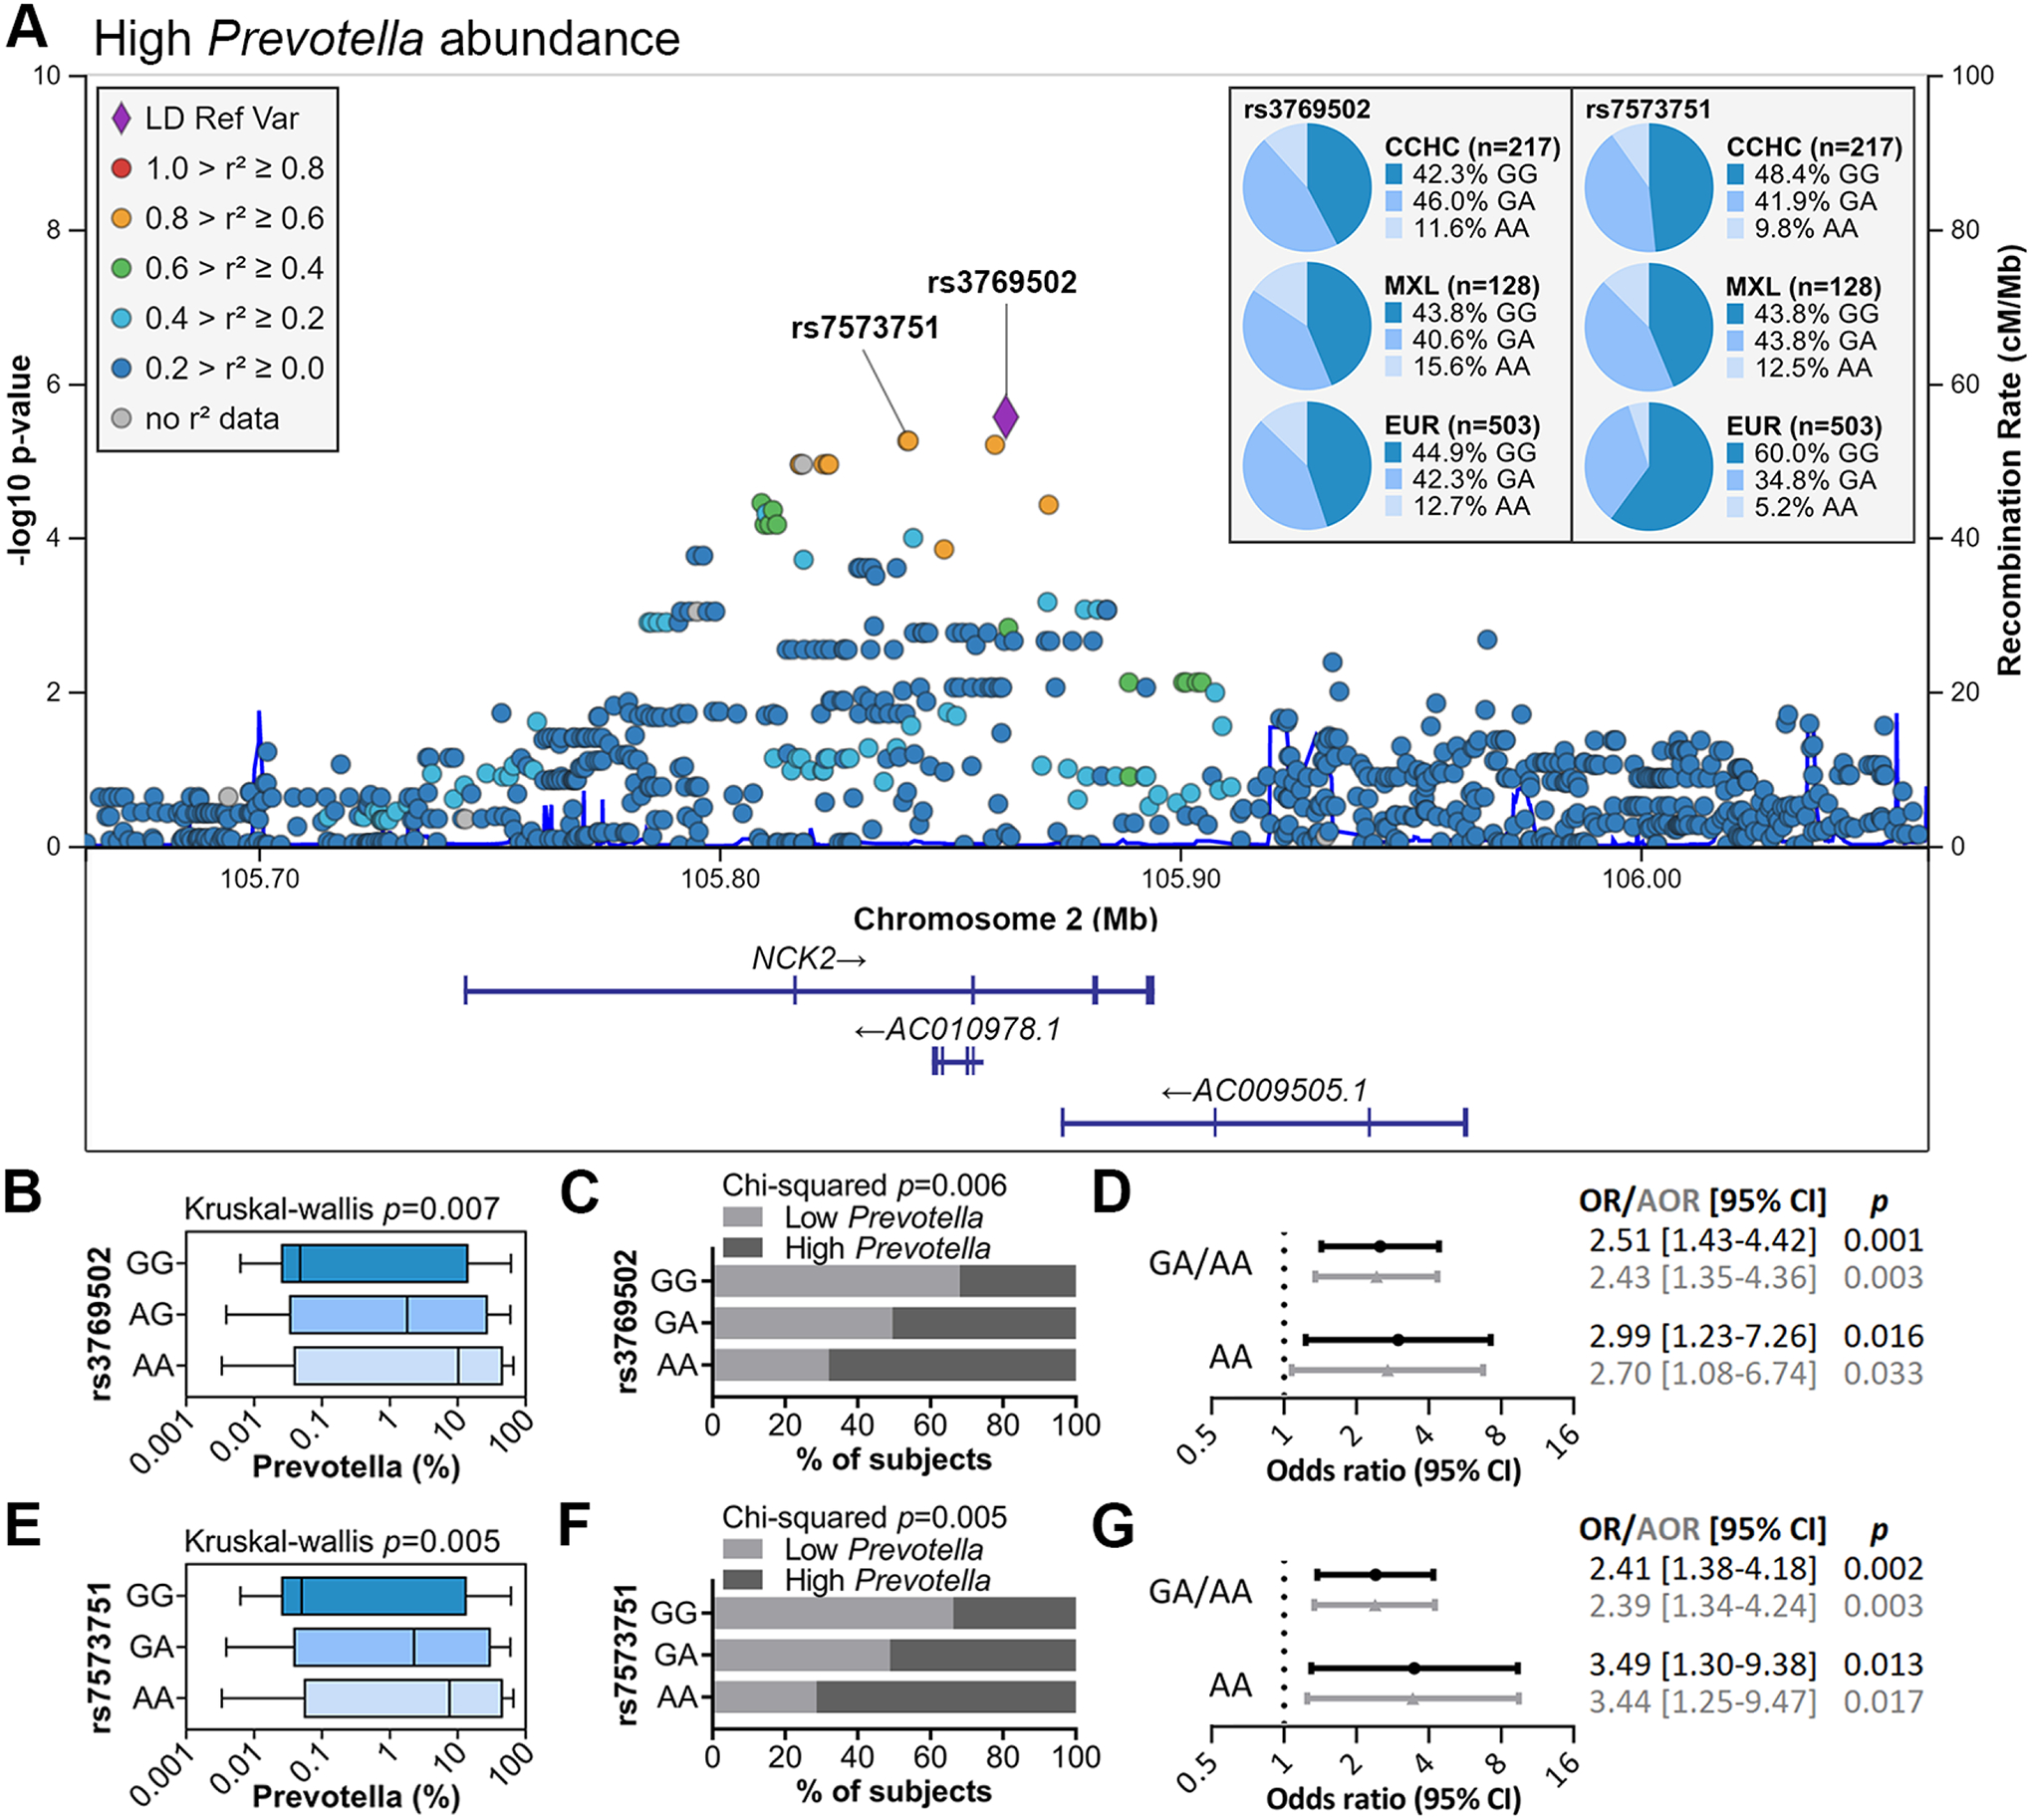
Approach and results: Subjects of the population-based Cameron County Hispanic Cohort (CCHC; n = 217) were screened by vibration-controlled transient elastography (FibroScan). Among them, 144 (66.7%) had steatosis and 28 (13.0%) had liver fibrosis. The gut microbiome of subjects with liver fibrosis was enriched with immunogenic commensals (e.g., Prevotella copri, Holdemanella, Clostridiaceae 1) and depleted of Bacteroides caccae, Parabacteroides distasonis, Enterobacter, and Marinifilaceae. The liver fibrosis-associated metagenome was characterized by changes in the urea cycle, L-citrulline biosynthesis and creatinine degradation pathways, and altered synthesis of B vitamins and lipoic acid. These metagenomic changes strongly correlated with the depletion of Parabacteroides distasonis and enrichment of Prevotella and Holdemanella. Liver fibrosis was also associated with depletion of bacterial pathways related to L-fucose biosynthesis. Alcohol consumption, even moderate, was associated with high Prevotella abundance. The single-nucleotide polymorphisms rs3769502 and rs7573751 in the NCK adaptor protein 2 (NCK2) gene positively associated with high Prevotella abundance.

Conclusion: Hispanics with liver fibrosis display microbiome profiles and associated functional changes that may promote oxidative stress and a proinflammatory environment. These microbiome signatures, together with NCK2 polymorphisms, may have utility in risk modeling and disease prevention in this high-risk population.


Conflict of interest statement

Disclosures: The authors have declared that no conflict of interest exists.

Figures

Fig. 1.
Fig. 1.
Sample clustering and taxa contribution to differences between clusters. (A) PCoA plot based on weighted UniFrac distances. Samples were grouped by PAM clustering. Heatmap of (B) families and (C) genera (log10 abundance) with significantly different abundance across clusters, as determined by Kruskal-Wallis test. Taxa are grouped depending on which cluster has the highest median abundance. Within each group, taxa are ordered by descending mean abundance. Color key represents row Z-scores.
Fig. 2.
Fig. 2.
Alpha and beta diversity of stool samples in CCHC subjects. Number of (A) observed OTUs and (B) Shannon index scores, in healthy CCHC subjects versus those with disease. Bars and error bars represent mean and standard deviation. Significance compared to the healthy group was determined by unpaired t-test. (C) Weighted UniFrac distance-based RDA was performed to evaluate the relationship between selected clinical parameters and stool microbiome. ANOVA-like significance test of the model, axes and explanatory variables (clinical parameters) are shown. Triplots of the weighted Unifrac distance-based RDA with explanatory variables shown in blue and the abundance of (D) families and (E) genera shown in black. Only taxa significant by envfit permutation test (p<0.05) are shown.
Fig. 3.
Fig. 3.
Bacterial taxa with altered abundance in subjects with liver fibrosis. (A) Cladogram showing taxa with significantly different bacterial abundance between subjects with and without liver fibrosis, as assessed by the linear discriminant analysis (LDA) effect size (LEfSe) algorithm. (B) Volcano plots of ANCOM analysis showing all bacterial taxa with ≥0.1% abundance in at least 25% of samples, with significant taxa labelled as in panel (A). Significance was determined using FDR <0.2 and W statistic above the 60th percentile). The x-axis represents effect size, based on the centered log ratio (CLR)-transformed mean difference in abundance between subjects with and without liver fibrosis. Labels sharing a dot indicate taxa at different taxonomic levels, where all reads from the higher level are assigned to the taxa at the lower level. (C) Median relative abundance of significant taxa (as determined by ANCOM) in subjects with and without liver fibrosis. (D) Forest plot of significant taxa from panels (B-C), which also showed a significant association with liver fibrosis after adjusting for covariates. Adjusted odds ratios (AORs) for liver fibrosis are shown for high bacterial abundance, after adjusting for age, gender, diabetes status, BMI and alcohol intake (g/day). *Prevotella abundance is merged from all genus subgroups. Classifications at the family (f_), genus (g_), and species (s_) levels are shown.
Fig. 4.
Fig. 4.
Dietary factors affecting liver fibrosis-associated microbiome profiles. (A-B) RDA to evaluate the relationship between dietary intake and the abundance profiles of taxa significantly associated with liver fibrosis. (A) Triplots of redundancy analysis. Explanatory variables (dietary groups) are shown in blue. Abundance of liver fibrosis-associated bacteria are shown in black as response variables and overlaid using the envfit function in the R vegan package on the linear constraints. Only taxa significant by envfit permutation test (p<0.05) are shown. Classifications at the class (c_), family (f_) and species (s_) levels are shown. (B) ANOVA-like significance test of the RDA model, axes and explanatory variables. (C) PCoA plot of overall gut microbiome profiles, based on weighted UniFrac distances, with samples grouped by drinking status.
Fig. 5.
Fig. 5.
Host genetics associated with high Prevotella abundance. (A) Regional association plot for the GWAS of high Prevotella abundance. Linkage disequilibrium (LD) was based on the admixed American population from 1000 Genomes. Genotype frequencies for rs3769502 and rs7573751 are shown [MXL: subjects with Mexican ancestry in Los Angeles, California; EUR: Europeans, from 1000 Genomes]. (B,E) Prevotella abundance by rs3769502 and rs7573751 genotypes. Bars represent the median and interquartile range; error bars show the minimum and maximum abundances. (C,F) % of subjects with high and low Prevotella abundance by rs3769502 and rs7573751 genotypes. (D,G) Forest plots showing the association between rs3769502 and rs7573751 GA/AA and AA genotypes and high Prevotella abundance. OR: odds ratio; AOR: OR adjusted for age, gender and presence of liver fibrosis.
Fig. 6.
Fig. 6.
MetaCyc pathways and enzymes significantly altered in stool metagenome of subjects with liver fibrosis. (A-B) Significant differences in gene abundance of MetaCyc pathways (A) and enzymes (B) were identified between subjects with and without liver fibrosis. Significance was determined by ANCOM analysis (FDR <0.2). Mean abundances for the differentially abundant pathways and enzymes performing the reactions are shown. (C) Spearman’s correlation matrix between all pathways and enzymes from (A-B). P-values were corrected for multiple tests by the Benjamini-Hochberg method. +: p<0.05 and Spearman’s correlation coefficient |rs|≥0.3. (D) Partial Spearman’s correlation matrix of MetaCyc pathways and enzymes against bacterial taxa with significantly altered abundance in liver fibrosis, as determined by ANCOM analysis. Correlation was adjusted for FibroScan liver stiffness measurement (kPa). P-values were corrected for multiple tests by the Benjamini-Hochberg method. Columns represent pathways and enzymes; rows represent taxa. Only pathways, enzymes and taxa with significant positive correlation (p<0.05 and rs≥0.3, indicated with +) are shown. Bacterial classifications at the family (f_), genus (g_), and species (s_) levels are shown.

References

    1. Younossi ZM, Marchesini G, Pinto-Cortez H, Petta S. Epidemiology of Nonalcoholic Fatty Liver Disease and Nonalcoholic Steatohepatitis: Implications for Liver Transplantation. Transplantation. 2019;103:22–27. - PubMed
    1. Estes C, Anstee QM, Arias-Loste MT, Bantel H, Bellentani S, Caballeria J et al. Modeling NAFLD disease burden in China, France, Germany, Italy, Japan, Spain, United Kingdom, and United States for the period 2016–2030. J Hepatol. 2018;69:896–904. - PubMed
    1. Siegel RL, Miller KD, Jemal A. Cancer statistics, 2019. CA Cancer J Clin. 2019;69:7–34. - PubMed
    1. Rich NE, Oji S, Mufti AR, Browning JD, Parikh ND, Odewole M et al. Racial and Ethnic Disparities in Nonalcoholic Fatty Liver Disease Prevalence, Severity, and Outcomes in the United States: A Systematic Review and Meta-analysis. Clin Gastroenterol Hepatol. 2018;16:198–210 e192. - PMC - PubMed
    1. Ramirez AG, Munoz E, Holden AE, Adeigbe RT, Suarez L. Incidence of hepatocellular carcinoma in Texas Latinos, 1995–2010: an update. PLoS One. 2014;9:e99365. - PMC - PubMed

Publication types

MeSH terms

Supplementary concepts