. 2021 Oct 11;19(10):e3001410.
doi: 10.1371/journal.pbio.3001410. eCollection 2021 Oct.

Dynamic large-scale connectivity of intrinsic cortical oscillations supports adaptive listening in challenging conditions

Affiliations

Dynamic large-scale connectivity of intrinsic cortical oscillations supports adaptive listening in challenging conditions

Mohsen Alavash et al. PLoS Biol. .

Abstract

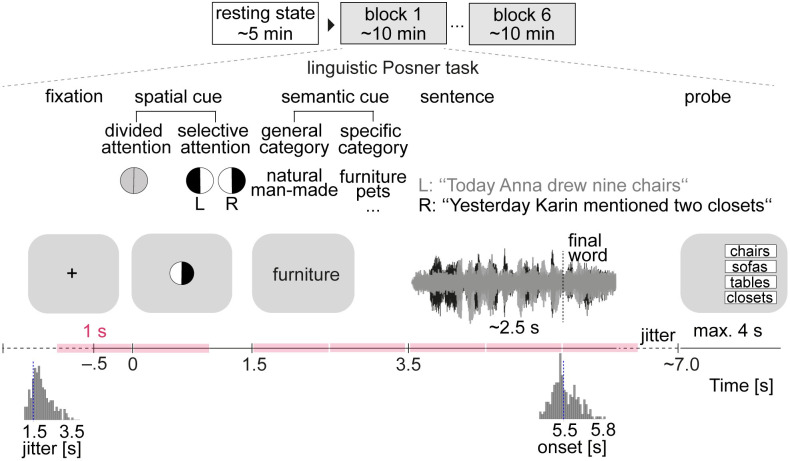
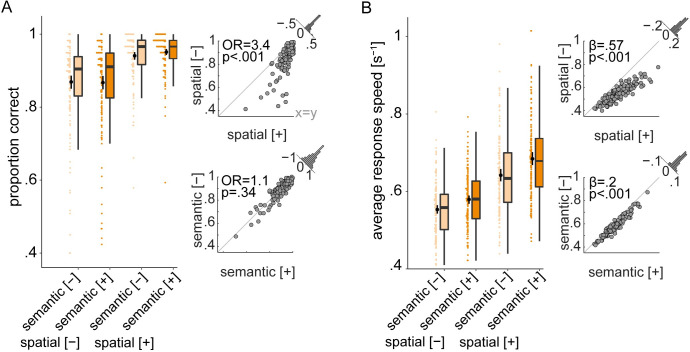
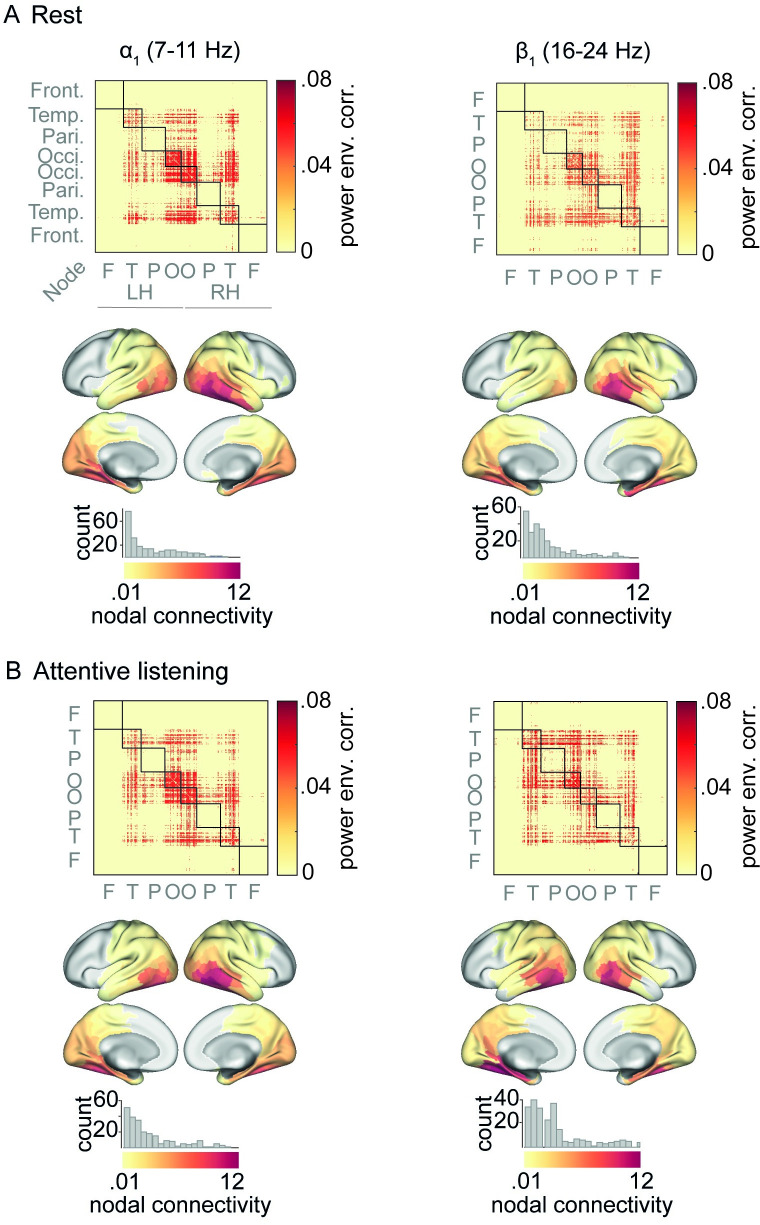
In multi-talker situations, individuals adapt behaviorally to this listening challenge mostly with ease, but how do brain neural networks shape this adaptation? We here establish a long-sought link between large-scale neural communications in electrophysiology and behavioral success in the control of attention in difficult listening situations. In an age-varying sample of N = 154 individuals, we find that connectivity between intrinsic neural oscillations extracted from source-reconstructed electroencephalography is regulated according to the listener's goal during a challenging dual-talker task. These dynamics occur as spatially organized modulations in power-envelope correlations of alpha and low-beta neural oscillations during approximately 2-s intervals most critical for listening behavior relative to resting-state baseline. First, left frontoparietal low-beta connectivity (16 to 24 Hz) increased during anticipation and processing of a spatial-attention cue before speech presentation. Second, posterior alpha connectivity (7 to 11 Hz) decreased during comprehension of competing speech, particularly around target-word presentation. Connectivity dynamics of these networks were predictive of individual differences in the speed and accuracy of target-word identification, respectively, but proved unconfounded by changes in neural oscillatory activity strength. Successful adaptation to a listening challenge thus latches onto two distinct yet complementary neural systems: a beta-tuned frontoparietal network enabling the flexible adaptation to attentive listening state and an alpha-tuned posterior network supporting attention to speech.


Conflict of interest statement

The authors have declared that no competing interests exist.

Figures

Fig 1
Fig 1. Experimental procedure and the listening task.
EEG of N = 154 participants was recorded during a 5-min eyes-open resting state and 6 blocks of a linguistic Posner task with concurrent speech [5]. Participants listened to 2 competing, dichotically presented sentences. Each trial started with the visual presentation of a spatial cue. An informative cue provided information about the side (left ear vs. right ear) of the to-be-probed final word. An uninformative cue did not provide information about the side of the to-be-probed final word. A semantic cue was visually presented indicating a general or a specific semantic category for both final words. The 2 sentences were presented dichotically along with a visual fixation cross. At the end of each trial, a visual response array appeared on the side of the probed ear with 4 word choices, asking participants to identify the final word of the sentence presented to the respective ear. To capture amplitude-coupling between frequency-specific neural oscillations throughout the listening task, power-envelope correlations between narrow-band EEG source signals were estimated for 1-s time windows of interest (colored intervals) and compared with resting state connectivity at the same frequency. The stimulus materials can be found at https://osf.io/nfv9e/. EEG, electroencephalography.
Fig 2
Fig 2. Individual behavioral benefit from informative listening cues.
(A) Proportion of correct final word identifications averaged over trials per cue condition (B) The same as (A) but for average response speed. Box plots: Colored data points represent trial-averaged performance scores of N = 154 individuals per cue–cue combination. Black bars show mean ± bootstrapped 95% CI. Scatter plots: Individual cue benefits shown separately for each cue and performance score. Black data points represent individuals’ trial-averaged scores under informative [+] and uninformative [−] cue conditions. Gray diagonal corresponds to 45-degree line. Histograms show the distribution of the cue benefit (informative minus uninformative) across all participants. OR: odds ratio parameter estimate resulting from generalized linear mixed-effects models; β: slope parameter estimate resulting from general linear mixed-effects models. The data underlying this figure can be found at https://osf.io/ge2cq/.
Fig 3
Fig 3. Spectral profile of source EEG power-envelope correlations and their relationship with fMRI connectivity.
(A) Frequency-specific whole-brain mean connectivity during rest and listening task. At each frequency and per individual, mean connectivity was estimated as the upper-diagonal average of power-envelope correlation matrix thresholded at 10% of network density. Each line graph represents mean ± SEM of mean connectivity across all N = 154 participants. (B) Thirty participants have had performed the same task in fMRI [5]. Across these participants, we tested the correlation between whole-brain mean connectivity derived from brain hemodynamics (i.e., mean Pearson correlation between fMRI band-passed filtered [0.06–0.12 Hz] BOLD signals) and whole-brain mean connectivity derived from EEG oscillatory source activity (i.e., mean power-envelope correlation at frequencies ranging from 2–32 Hz). Power-envelope correlations between EEG oscillatory sources show strongest positive correlation with fMRI connectivity within alpha and low-beta frequency range (gray frequency intervals). The data underlying this figure can be found at https://osf.io/ge2cq/. EEG, electroencephalography; fMRI, functional magnetic resonance imaging.
Fig 4
Fig 4. Connectivity maps of α/β oscillations under rest and attentive listening.
(A) For each frequency band, power-envelope correlations between EEG oscillatory sources were estimated using 5-min eyes-open resting state data. (B) The same procedure as in (A) was applied to task data after concatenating whole-trial signals across 30 random trials of each block (5-min data in total as in rest), and then averaging the correlation matrices across all 6 blocks of task. Correlation matrices were averaged across N = 154 individuals and thresholded at 10% of network density. Nodes having zero connectivity strength are masked in gray. Histograms illustrate distribution of nodal connectivity strength with high-connectivity nodes overlapping with occipital and posterior temporal regions. Note that in this analysis, task connectivity is not specific to a particular time window within trials or cue condition, and thus illustrate the overall spatial profile of α/β connectivity under listening task. Nodes correspond to cortical parcels as in [46] and are grouped according to their cortical lobes. The data underlying this figure can be found at https://osf.io/ge2cq/. EEG, electroencephalography; LH, left hemisphere; RH, right hemisphere.
Fig 5
Fig 5. Cortical connectivity dynamics of α/β oscillations during the listening task.
(A) To assess whether and how intrinsic alpha and low-beta oscillations regulate their cortical connectivity during attentive listening, connectivity difference maps (i.e., task minus rest) were derived per frequency band. Task connectivity was estimated by concatenating 1-s windowed signals across all 240 trials (4-min data). In anticipation of and during the spatial cue presentation, β1 connectivity was increased relative to its intrinsic connectivity mainly within the left hemisphere (first panel). This hyperconnectivity was significant across frontoparietal regions (brain surfaces; significant nodes are outlined in black). The same analysis revealed a significant α1 hypoconnectivity during final-word presentation (second panel). Nodes correspond to cortical parcels as in [46] and are grouped according to their cortical lobes. (B) To assess the degree and direction of change in connectivity per individual listener, nodal connectivity was averaged across significant nodes and compared between rest and task using permutation tests. Data points represent individuals’ mean connectivity (N = 154). Gray diagonal corresponds to 45-degree line. Histograms show the distribution of the connectivity change (task minus rest) across all participants. The data underlying this figure can be found at https://osf.io/ge2cq/. dlPFC, dorsolateral prefrontal cortex; FEF, frontal eye field; IFG, inferior frontal gyrus; IPL, inferior parietal lobule; LH, left hemisphere; PSL, perisylvian language area; RH, right hemisphere; STS, superior temporal sulcus.
Fig 6
Fig 6. Prediction of individual listening behavior from α/β connectivity dynamics.
(A) Interaction between mean frontoparietal β1 connectivity derived from resting state and connectivity of the same network during spatial cue presentation predicted how fast listeners identified the final word in the ensuing sentence presentation (β = 0.019, p < 0.01, log-BF = 2.32). For visualization purpose only, individuals were grouped according to their standardized mean frontoparietal β1 resting state connectivity. Each scatter plot corresponds to one group of individuals. Distribution of mean connectivity for each group is highlighted in black within the top histograms. Black data points represent the same individuals’ trial-average response speed regressed on their standardized mean frontoparietal β1 connectivity during spatial cueing. Solid blue lines indicate linear regression fit to the data when β1 resting state connectivity held constant at the group mean (dashed blue line in histograms). (B) Interaction between mean posterior α1 connectivity derived from resting state and connectivity of the same network during final word presentation predicted listeners’ word identification accuracy (OR = 0.94, p < 0.05, log-BF = 1.17). Data visualization is the same as in (A), but, here, the grouping variable is mean posterior α1 resting state connectivity and the predictor is the mean connectivity of the same network during final word period. Individuals’ age and hearing thresholds have been accounted for in the models. Shaded area shows two-sided parametric 95% CI. β: Slope parameter estimates from linear mixed-effects model. OR: odds ratio parameter estimates from generalized linear mixed-effects models. The data underlying this figure can be found at https://osf.io/ge2cq/. BF, Bayes factor; OR, odds ratio.

References

    1. Peelle JE. Listening Effort: How the Cognitive Consequences of Acoustic Challenge Are Reflected in Brain and Behavior. Ear Hear. 2017. - PMC - PubMed
    1. Shinn-Cunningham BG, Best V. Selective Attention in Normal and Impaired Hearing. Trends Amplif. 2008;12(4):283–99. doi: 10.1177/1084713808325306 - DOI - PMC - PubMed
    1. Lin FR, Yaffe K, Xia J, Xue QL, Harris TB, Purchase-Helzner E, et al.. Hearing loss and cognitive decline in older adults. JAMA Intern Med. 2013;173(4):293–9. doi: 10.1001/jamainternmed.2013.1868 - DOI - PMC - PubMed
    1. Deal JA, Betz J, Yaffe K, Harris T, Purchase-Helzner E, Satterfield S, et al.. Hearing Impairment and Incident Dementia and Cognitive Decline in Older Adults: The Health ABC Study. J Gerontol A Biol Sci Med Sci. 2017;72(5):703–9. doi: 10.1093/gerona/glw069 - DOI - PMC - PubMed
    1. Alavash M, Tune S, Obleser J. Modular reconfiguration of an auditory control brain network supports adaptive listening behavior. Proc Natl Acad Sci U S A. 2019;116(2):660–9. doi: 10.1073/pnas.1815321116 - DOI - PMC - PubMed

Publication types