. 2021 Oct 11;19(10):e3001425.
doi: 10.1371/journal.pbio.3001425. eCollection 2021 Oct.

SARS-CoV-2 nucleocapsid protein forms condensates with viral genomic RNA

Affiliations

SARS-CoV-2 nucleocapsid protein forms condensates with viral genomic RNA

Amanda Jack et al. PLoS Biol. .

Abstract

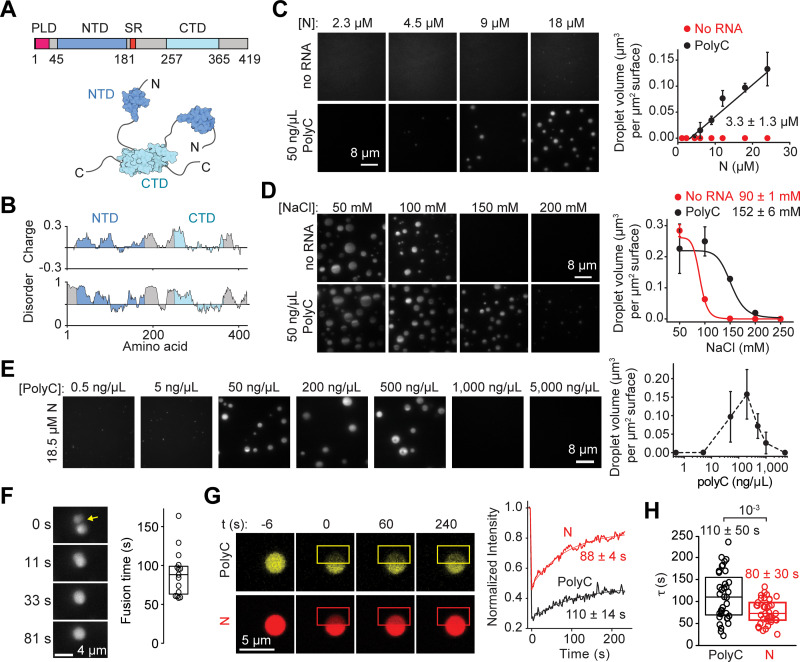
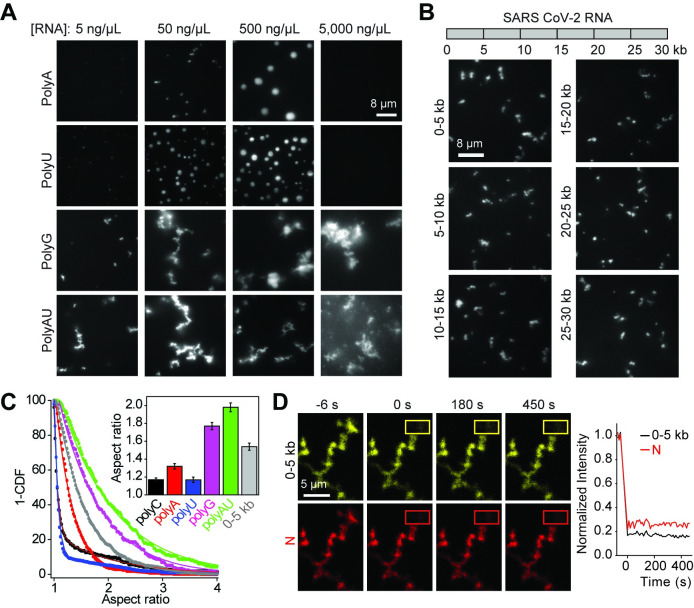
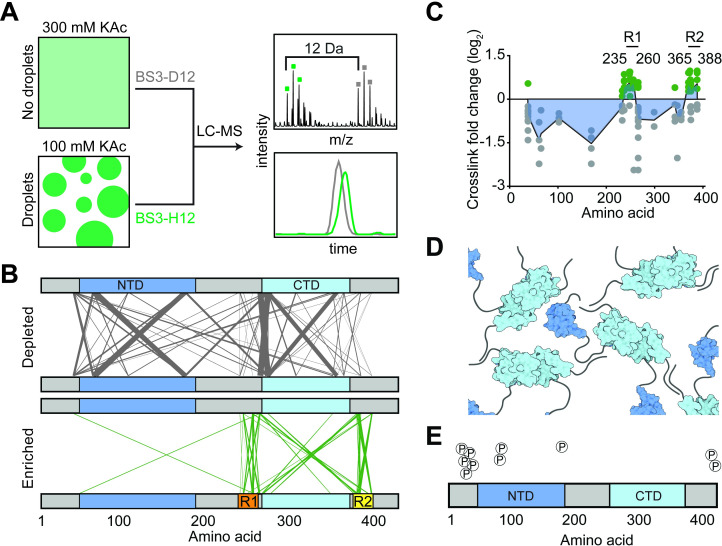
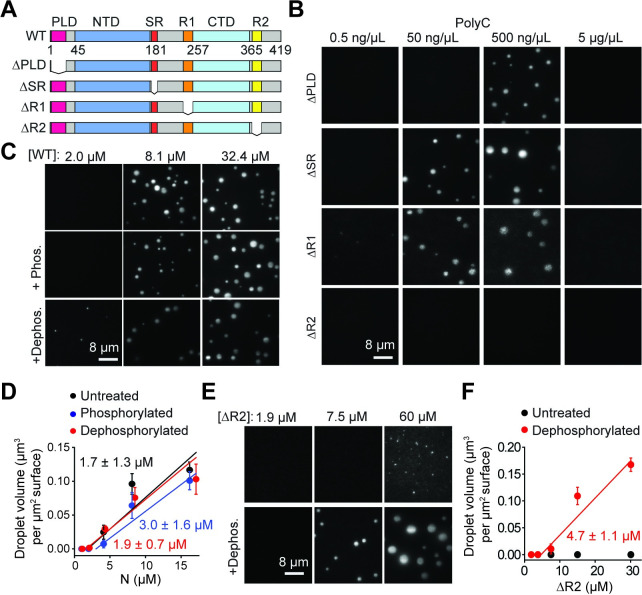
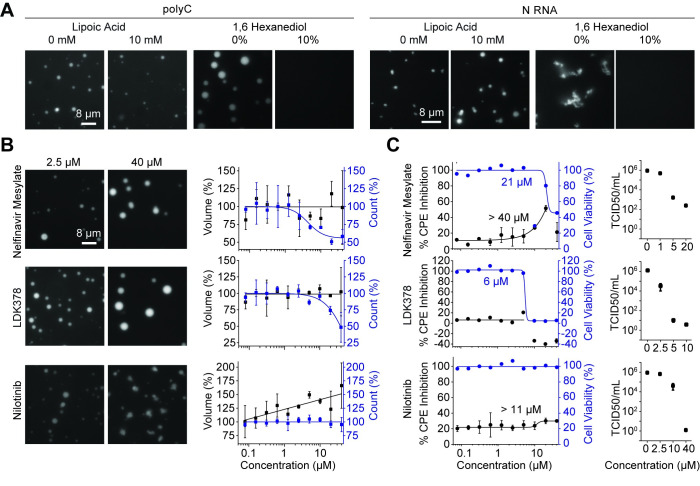
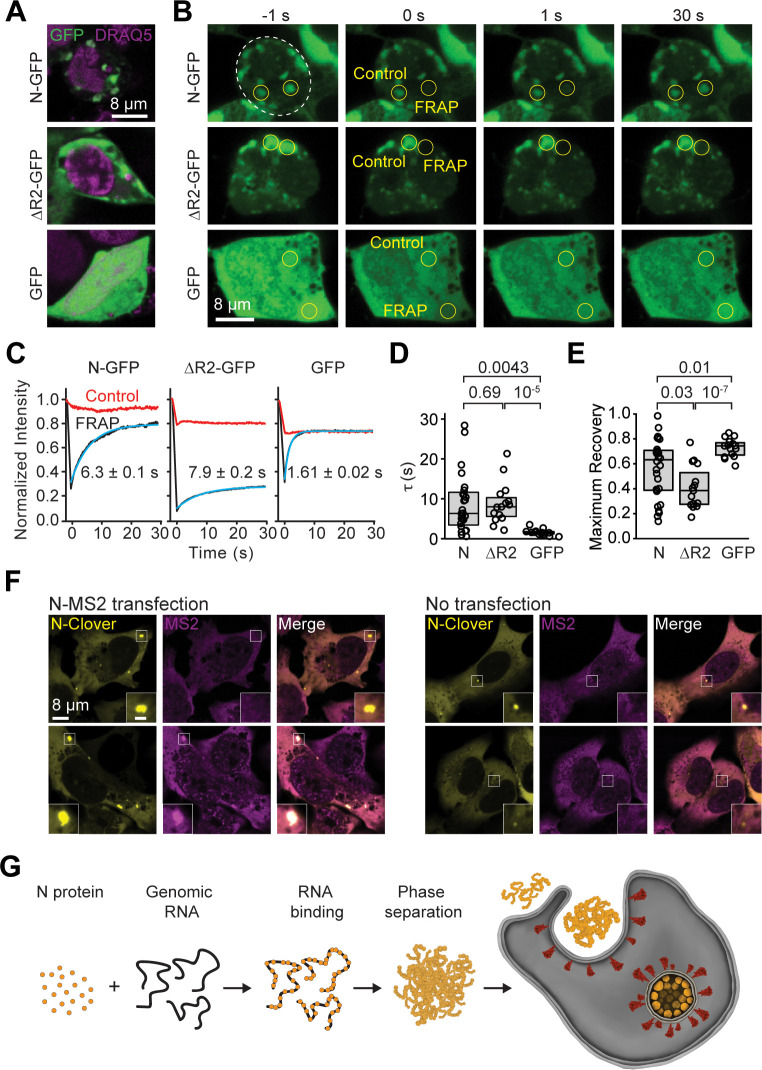
The Severe Acute Respiratory Syndrome Coronavirus 2 (SARS-CoV-2) infection causes Coronavirus Disease 2019 (COVID-19), a pandemic that seriously threatens global health. SARS-CoV-2 propagates by packaging its RNA genome into membrane enclosures in host cells. The packaging of the viral genome into the nascent virion is mediated by the nucleocapsid (N) protein, but the underlying mechanism remains unclear. Here, we show that the N protein forms biomolecular condensates with viral genomic RNA both in vitro and in mammalian cells. While the N protein forms spherical assemblies with homopolymeric RNA substrates that do not form base pairing interactions, it forms asymmetric condensates with viral RNA strands. Cross-linking mass spectrometry (CLMS) identified a region that drives interactions between N proteins in condensates, and deletion of this region disrupts phase separation. We also identified small molecules that alter the size and shape of N protein condensates and inhibit the proliferation of SARS-CoV-2 in infected cells. These results suggest that the N protein may utilize biomolecular condensation to package the SARS-CoV-2 RNA genome into a viral particle.


Conflict of interest statement

The authors have declared that no competing interests exist.

Figures

Fig 1
Fig 1. The SARS-CoV-2 N protein phase separates with RNA in vitro.
(A) Domain organization and the schematic of the N protein dimer. (B) Sliding window plot of charge distribution (EMBOSS) and disorder prediction (IUPred2A) for the N protein. Charge y-axis represents mean charge across a 30-residue sliding window. Disorder prediction (1, disordered; 0, ordered) was calculated using the “long disorder” setting, encompassing a 30-residue sliding window. (C) (Left) Images of the LD655-labeled N protein in the presence and absence of polyC RNA in 150 mM NaCl. (Right) The total volume of N-RNA condensates settled per micron squared area on the coverslip with and without 50 ng/μL polyC RNA (mean ± SD, n = 20 with 2 technical replicates). A linear fit (solid line) reveals csat (± SE), the minimum N protein concentration for condensate formation (see Methods). (D) (Left) Condensates formed by 24 μM LD655-labeled N protein in the presence or absence of 50 ng/μL polyC RNA dissolve by increasing NaCl concentration. (Right) The total volume of N condensates settled per micron squared area on the coverslip with increasing salt concentration (mean ± SD, n = 10). Solid curves represent a fit to a dose–response equation to determine IC50 (± SE). (E) The stoichiometry of the N protein and RNA affects phase separation. (Left) Example pictures show that Cy3-labeled N protein forms condensates with different concentrations of polyC RNA. The N protein concentration was set to 18.5 μM. (Right) The total volume of N-polyC condensates settled per micron squared area on the coverslip under different RNA concentrations (mean ± SD; n = 20, 2 technical replicates). (F) (Left) The fusion of N-polyC condensates formed in the presence of 18.5 μM LD655-labeled N and 50 ng/μL polyC RNA. (Right) Fusion time of N-polyC condensates (mean ± SD, n = 15 fusion events). The center and edges of the box represent the median with the first and third quartiles. (G) (Left) Representative FRAP imaging of an N-polyC condensate. The image of a condensate before the time of photobleaching (0 second) shows colocalization of Cy3-polyC and LD655-N in the condensate. Rectangles show the photobleached area. (Right) Fluorescence recovery signals of N and polyC in the bleached region. Solid curves represent a single exponential fit to reveal the recovery lifetime (τ, ±95% confidence interval). (H) The distribution of fluorescence recovery lifetimes of N and polyC in droplets (n = 37). The center and edges of the box represent the median with the first and third quartiles. The p-value was calculated from a 2-tailed t test. Data underlying this figure can be found in S1 Data. CTD, carboxyl-terminal domain; N, nucleocapsid; NTD, N-terminal domain; PLD, prion-like domain; SARS-CoV-2, Severe Acute Respiratory Syndrome Coronavirus 2; SR, serine/arginine-rich.
Fig 2
Fig 2. The N protein forms asymmetric condensates with viral RNA.
(A) The N protein forms spherical condensates with polyA and polyU RNA but forms asymmetric condensates with substrates that form Hoogsteen (polyG) and Watson–Crick (polyAU) base pairing interactions. The N protein concentration was set to 18.5 μM. (B) (Top) SARS-CoV-2 genomic RNA was divided into six 5-kb sections. (Bottom) The formation of asymmetric N condensates in the presence of 18 nM RNA. The N protein concentration was set to 18.5 μM. (C) The inverse cumulative distribution (1-CDF) of the aspect ratio of individual N condensates formed with different RNA substrates. The concentrations of N protein, RNA homopolymers, and 0–5 kb viral RNA were set to 18.5 μM, 50 ng/μL, and 18 nM, respectively. Solid curves represent a fit to exponential decay. (Insert) Decay constants of the exponential fits (± SE). (D) (Left) Representative FRAP imaging of an N and 0–5 kb viral RNA condensate. The image of a condensate before the time of photobleaching (0 second) shows colocalization of Cy3-labeled 0–5 kb viral RNA and LD655-N in the condensate. Rectangles show the photobleached area. (Right) N and 0–5 kb viral RNA do not exhibit fluorescence recovery in the bleached region (n = 16). Data underlying this figure can be found in S1 Data. CDF, cumulative distribution function; N, nucleocapsid; SARS-CoV-2, Severe Acute Respiratory Syndrome Coronavirus 2.
Fig 3
Fig 3. CLMS reveals interdomain interactions of the N protein.
(A) Schematic of the CLMS experiment. (Left) A high salt (300 mM KAc) buffer disrupts N condensates, whereas a low salt (100 mM KAc) buffer promotes condensate formation. (Right, top) Example of an individual cross-linked peptide in quantitative CLMS analysis. Precursor ions from the high salt (gray) and low salt (green) BS3 cross-linking conditions show the 12 Da shift between light (H12) and heavy (D12) cross-linkers. (Right, bottom) Ion chromatograms from the first 3 isotopes of each doublet were extracted and expressed as the ratio of peak areas. (B) The plot of cross-links depleted and enriched in the condensate condition. The width and transparency of the lines scale with the number of times the cross-link were detected across 3 independent experiments. (C) Fold changes of cross-link abundance upon condensate formation of N. As cross-links contain 2 positions, fold change information is plotted at both positions. Only cross-links with p-values less than 0.05 are included. Green and gray dots represent cross-links enriched and depleted in the condensate condition, respectively. The blue area represents a plot of median cross-link fold change. Data underlying this figure can be found in S1 Table. (D) Model for how multiple N dimers could phase separate via their disordered regions. (E) Phosphorylation sites detected by the CLMS experiment in 300 mM KAc. CLMS, cross-linking mass spectrometry; CTD, carboxyl-terminal domain; N, nucleocapsid; NTD, N-terminal domain.
Fig 4
Fig 4. The effect of domain deletions and phosphorylation on phase separation of the N protein.
(A) Deletion mutants of the N protein. (B) While ΔPLD, ΔSR, and ΔR1 phase separate, ΔR2 does not phase separate when mixed with polyC RNA. Protein concentration was set at 18 μM for all conditions. (C) Images of condensates formed by untreated, phosphorylated, and dephosphorylated N protein in 50 ng/μL polyC RNA. (D) The total volume of N-RNA condensates settled per micron squared area on the coverslip under different phosphorylation conditions (mean ± SD, n = 20 with 2 technical replicates). Linear fits (solid lines) reveal csat (± SE). (E) Images of condensates formed by untreated and dephosphorylated ΔR2 in 50 ng/μL polyC RNA. (F) The total volume of ΔR2-RNA condensates settled per micron squared area on the coverslip as a function of ΔR2 concentration (mean ± SD, n = 20 with 2 technical replicates). The linear fit (solid line) reveals csat (± SE). Data underlying this figure can be found in S1 Data. CTD, carboxyl-terminal domain; N, nucleocapsid; NTD, N-terminal domain; PLD, prion-like domain; SR, serine/arginine-rich; WT, wild-type.
Fig 5
Fig 5. Identification of small molecules that alter phase separation of N in vitro and reduce viral titer in SARS-CoV-2 infected cells.
(A) Condensates formed in the presence of 7.8 μM N and either 50 ng/μL polyC or 18 nM 0–5 kb viral RNA were not affected by 10 mM lipoic acid but dissolved in the presence of 10% 1,6 hexanediol. (B) (Left) Examples of drugs that affected N phase separation with polyC in vitro. The N protein and polyC RNA concentrations were set to 7.8 μM and 50 ng/μL, respectively. (Right) The percent change on the number (blue) and total volume (black) of N-polyC condensates settled per micron squared area on the coverslip under different drug concentrations (mean ± SD, n = 8 with 2 technical replicates). Solid curves represent a fit to a dose–response equation (see Methods). (C) (Left) Percent CPE inhibition (black, mean ± SD, 2 technical replicates) and cell viability (blue) of SARS-CoV-2–infected Vero-E6 cells treated with serial dilutions of drugs. Solid curves represent a fit to a dose–response equation (see Methods) to determine a half-maximal response constant EC50 (S4 Table). (Right) Viral titer in SARS-CoV-2–infected Vero-E6 cells treated with serial dilutions of drugs as measured by a TCID50 assay (mean ± SD, 3 technical replicates). Data underlying this figure can be found in S1 Data. CPE, cytopathic effect; N, nucleocapsid; SARS-CoV-2, Severe Acute Respiratory Syndrome Coronavirus 2; TCID, tissue culture infectious dose.
Fig 6
Fig 6. Dynamics of N condensates in vivo.
(A) Example images of HEK293T cells expressing N-GFP, ΔR2-GFP, and GFP stained with DRAQ5. (B) Representative FRAP imaging of cells exhibiting N-GFP or ΔR2-GFP puncta or high GFP expression. Circles show the photobleached area. (C) Fluorescence recovery of the GFP signal in the bleached versus the control regions. The solid curve represents a single exponential fit to reveal the recovery lifetime (τ, ±95% confidence interval). (D) The distribution of fluorescence recovery lifetimes of cells expressing N-GFP (n = 28) or ΔR2-GFP (n = 15) exhibiting puncta and GFP only (n = 15). The center and edges of the box represent the median with the first and third quartiles. The p-values were calculated from a 2-tailed t test. (E) The maximum fractional recovery after photobleaching of cells expressing N-GFP (n = 28), ΔR2-GFP (n = 15), or GFP only (n = 15). The center and edges of the box represent the median with the first and third quartiles. The p-values were calculated from a 2-tailed t test. (F) U2OS cells stably expressing N-Clover form condensates in the cytoplasm. (Left) Cells co-transfected with an N-MS2 expression plasmid exhibit colocalization of N-Clover and Cy3-MS2 FISH signal in N-condensates (N = 10 out of 55 cells, 2 technical replicates). (Right) The Cy3-MS2 FISH probe does not partition into N condensates in untransfected cells (N = 55 cells, 2 technical replicates). Inset scale bar is 2 μm. (G) Model for remodeling of viral RNA genome by the SARS-CoV-2 N protein. The N protein packages viral genomic RNA through phase separation, which may facilitate efficient replication of the genomic RNA and the formation of the enveloped virus. Data underlying this figure can be found in S1 Data. FRAP, fluorescence recovery after photobleaching; N, nucleocapsid; SARS-CoV-2, Severe Acute Respiratory Syndrome Coronavirus 2.

Update of

Similar articles

Cited by

References

    1. Gordon DE, Jang GM, Bouhaddou M, Xu J, Obernier K, White KM, et al.. A SARS-CoV-2 protein interaction map reveals targets for drug repurposing. Nature. 2020;583(7816):459–68. doi: 10.1038/s41586-020-2286-9 - DOI - PMC - PubMed
    1. Shang J, Ye G, Shi K, Wan Y, Luo C, Aihara H, et al.. Structural basis of receptor recognition by SARS-CoV-2. Nature. 2020;581(7807):221–4. doi: 10.1038/s41586-020-2179-y - DOI - PMC - PubMed
    1. Chan KK, Dorosky D, Sharma P, Abbasi SA, Dye JM, Kranz DM, et al.. Engineering human ACE2 to optimize binding to the spike protein of SARS coronavirus 2. Science. 2020;369(6508):1261–5. doi: 10.1126/science.abc0870 - DOI - PMC - PubMed
    1. Hoffmann M, Kleine-Weber H, Schroeder S, Krüger N, Herrler T, Erichsen S, et al.. SARS-CoV-2 cell entry depends on ACE2 and TMPRSS2 and is blocked by a clinically proven protease inhibitor. Cell. 2020;181(2):271–80. doi: 10.1016/j.cell.2020.02.052 - DOI - PMC - PubMed
    1. Mulligan MJ, Lyke KE, Kitchin N, Absalon J, Gurtman A, Lockhart S, et al.. Phase I/II study of COVID-19 RNA vaccine BNT162b1 in adults. Nature. 2020;586(7830):589–93. doi: 10.1038/s41586-020-2639-4 - DOI - PubMed

Publication types