. 2021 Oct 11;19(10):e3001420.
doi: 10.1371/journal.pbio.3001420. eCollection 2021 Oct.

Corollary discharge enables proprioception from lateral line sensory feedback

Affiliations

Corollary discharge enables proprioception from lateral line sensory feedback

Dimitri A Skandalis et al. PLoS Biol. .

Abstract

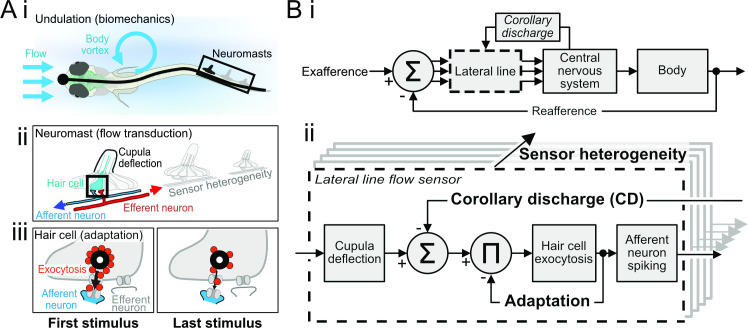
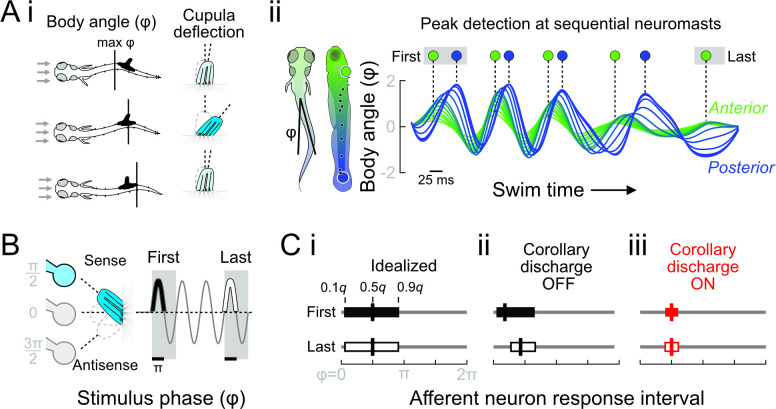
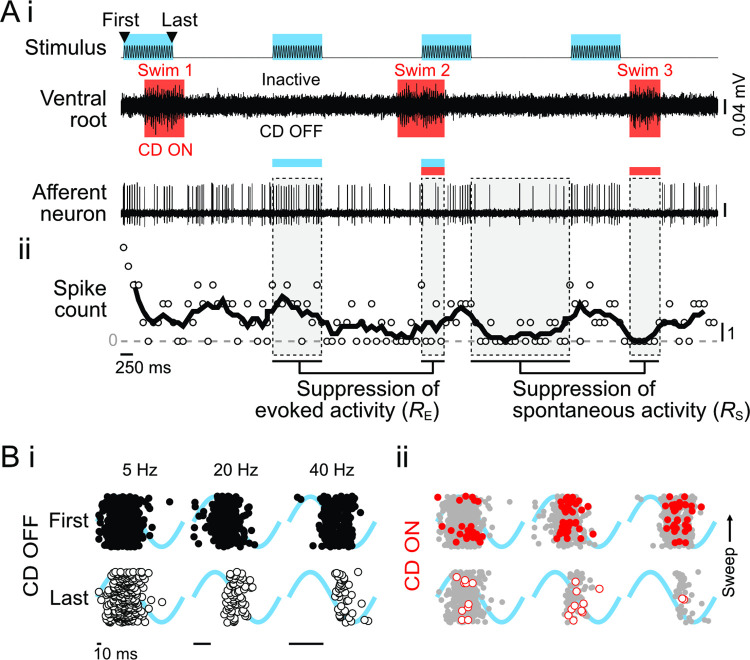
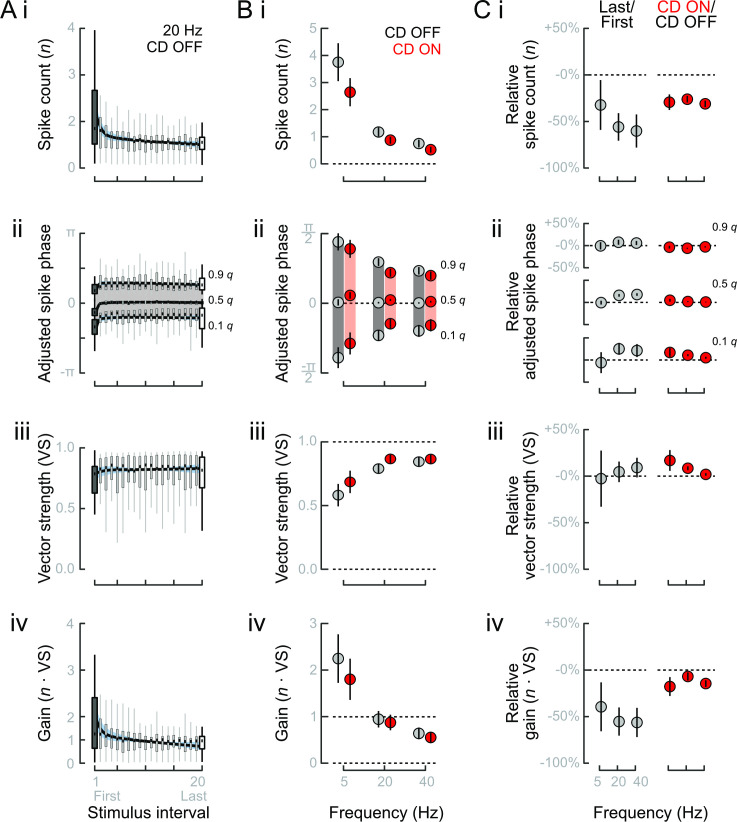
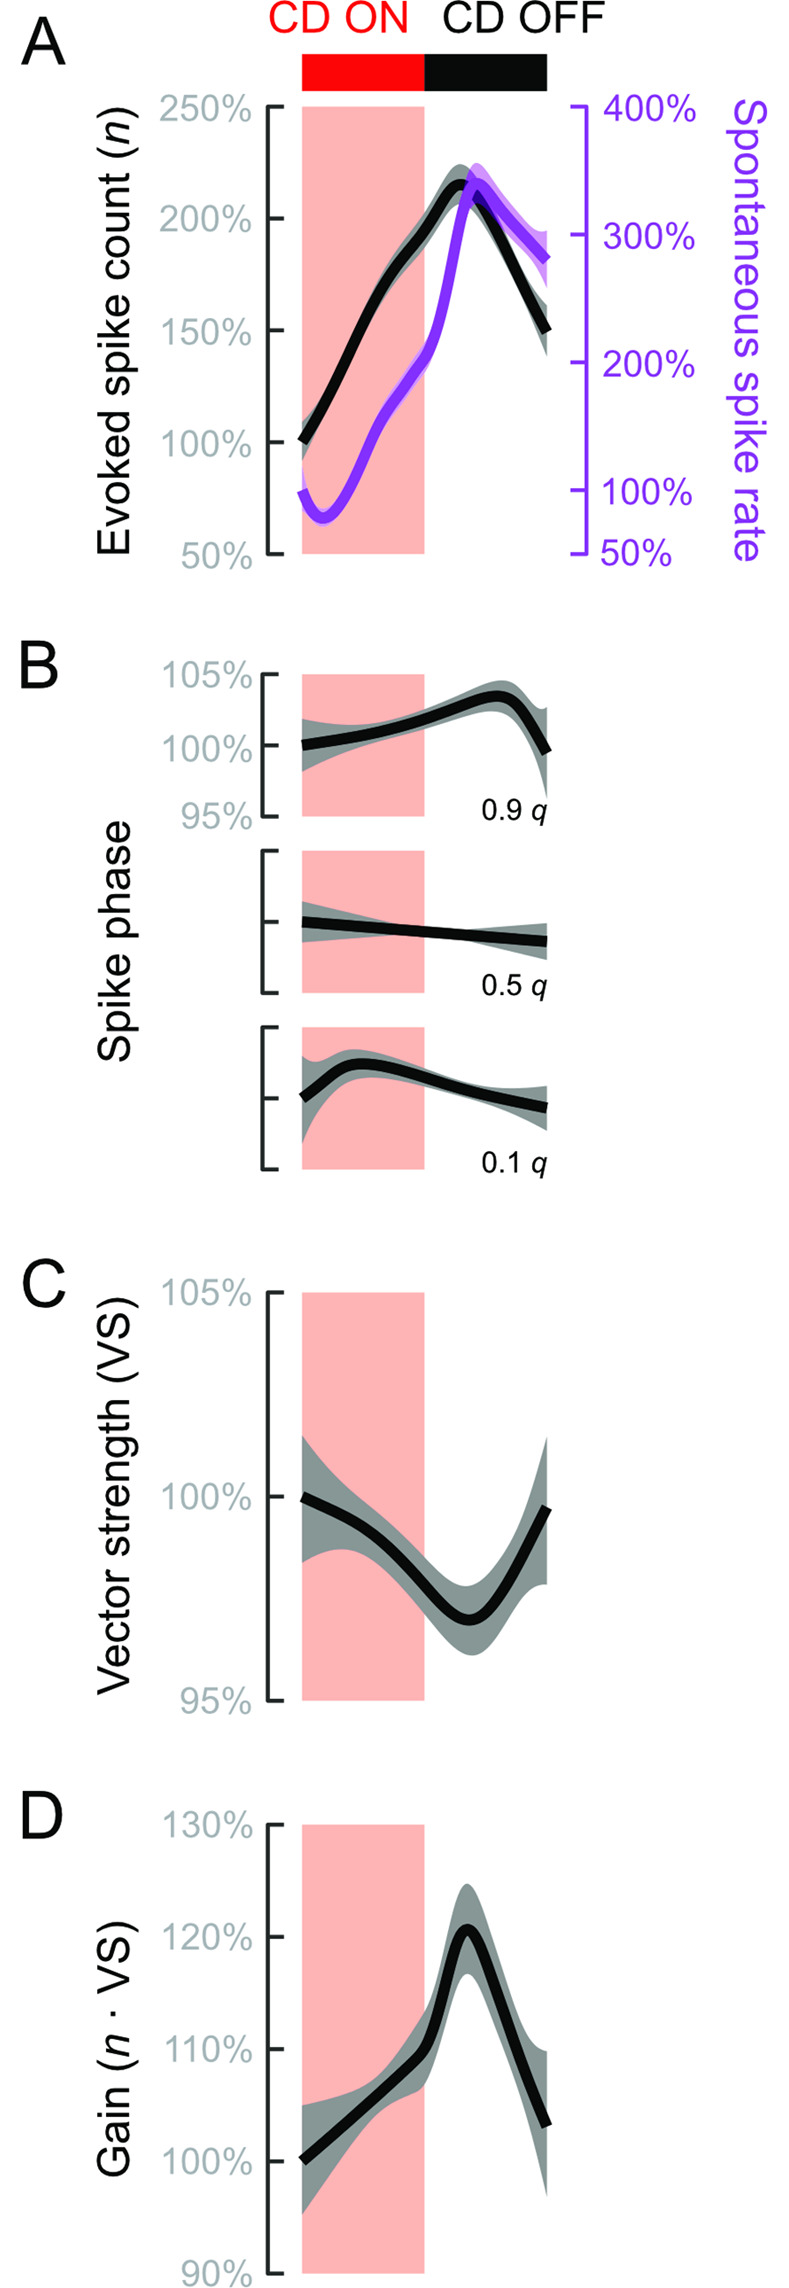
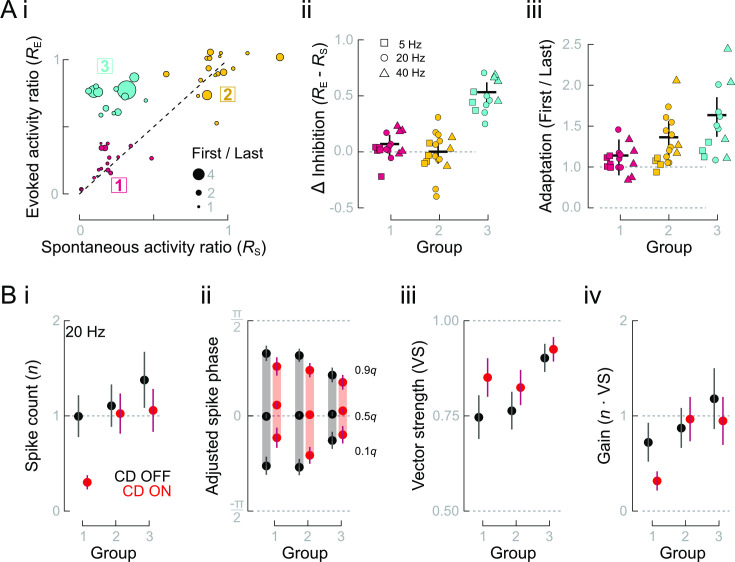
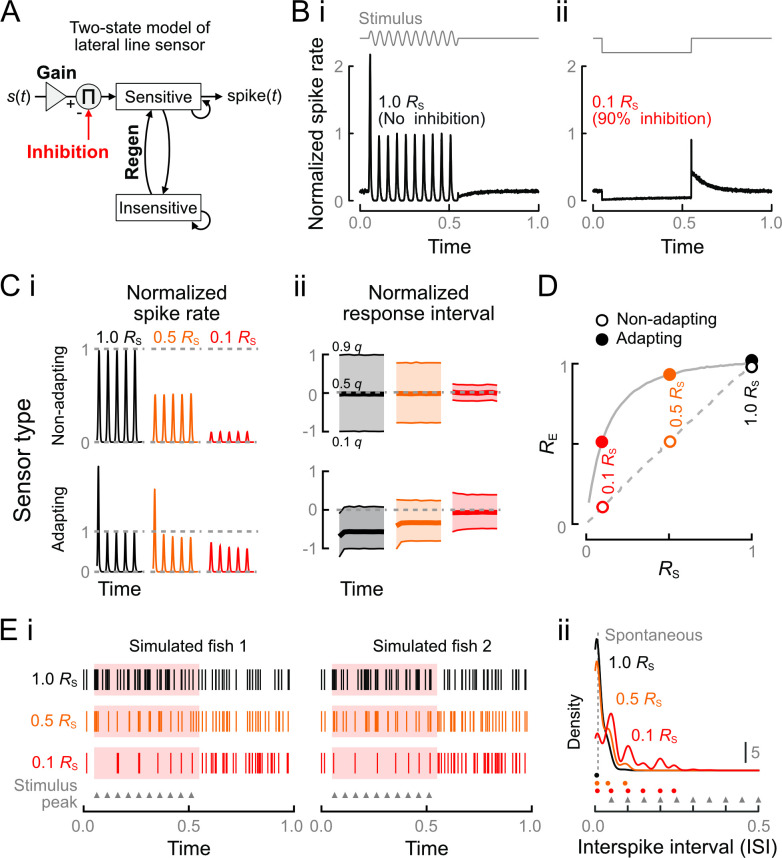
Animals modulate sensory processing in concert with motor actions. Parallel copies of motor signals, called corollary discharge (CD), prepare the nervous system to process the mixture of externally and self-generated (reafferent) feedback that arises during locomotion. Commonly, CD in the peripheral nervous system cancels reafference to protect sensors and the central nervous system from being fatigued and overwhelmed by self-generated feedback. However, cancellation also limits the feedback that contributes to an animal's awareness of its body position and motion within the environment, the sense of proprioception. We propose that, rather than cancellation, CD to the fish lateral line organ restructures reafference to maximize proprioceptive information content. Fishes' undulatory body motions induce reafferent feedback that can encode the body's instantaneous configuration with respect to fluid flows. We combined experimental and computational analyses of swimming biomechanics and hair cell physiology to develop a neuromechanical model of how fish can track peak body curvature, a key signature of axial undulatory locomotion. Without CD, this computation would be challenged by sensory adaptation, typified by decaying sensitivity and phase distortions with respect to an input stimulus. We find that CD interacts synergistically with sensor polarization to sharpen sensitivity along sensors' preferred axes. The sharpening of sensitivity regulates spiking to a narrow interval coinciding with peak reafferent stimulation, which prevents adaptation and homogenizes the otherwise variable sensor output. Our integrative model reveals a vital role of CD for ensuring precise proprioceptive feedback during undulatory locomotion, which we term external proprioception.


Conflict of interest statement

The authors have declared that no competing interests exist.

Figures

Fig 1
Fig 1. A systematic approach for cellular-to-organismal integration in swimming fish.
(A) (i) Fish sense water flows that originate in the environment (exafference) or are self-induced by undulatory locomotor mechanics (reafference). Both sources generate alternating currents across a wide band of frequencies, which are transduced by neuromasts along the body length. (ii) Afferent neuron signaling of neuromast deflections is mediated by receptor potentials in hair cells, as modulated by inhibitory efferent neuron activity. (iii) Depolarization of hair cells results in vesicle exocytosis onto postsynaptic afferent neuron boutons. Sustained neuromast deflection results in adaptation, here depicted as synaptic depression. (B) Hypothetical architecture of closed-loop motor control in fishes. (i) Many individual sensors in the lateral line transduce the summed exafferent and reafferent inputs. Each sensor transmits a filtered signal to the central nervous system. Brain computations extract key flow features that guide motor actions. Motor signals drive behavior, and motor signal copies called CD modulate lateral line feedback in anticipation of self-induced feedback from those behaviors. (ii) Elaboration of the sensor block to understand the effects of CD modulation on lateral line feedback. Cupula deflection drives vesicle exocytosis from hair cells, which leads to synaptic depression and adaptation of afferent neuron spike rates. Inhibition by CD reduces exocytosis and therefore afferent spike rates, but also prevents adaptation. This is replicated throughout the lateral line, so the interactions between adaptation, CD, and sensor heterogeneity are central to understanding the nature of feedback during swim bouts. CD, corollary discharge.
Fig 2
Fig 2. Effects of undulation, adaptation, and CD on signaling of reafference in the lateral line.
(A) (i) Larval zebrafish swimming is characterized by body undulations that induce periodic reafference in the lateral line. The instantaneous body angle at each neuromast (ϕ) depends on body wavelength and frequency. In the quasi-steady approximation, the body wave passing a neuromast dictates the timing of maximum cupular deflection (denoted by intense blue). (ii) The timing of the body wave peak from the first to last tail beats is shown at the locations of the most rostral (green) and most caudal (blue) neuromasts. (B) Neuromasts were stimulated by a dipole piezo stimulus to examine afferent neural responses from the first to last stimulus period. In hair cells’ sense direction, the peak of feedback is expected to coincide with maximum stimulation at phase π/2 (denoted by intense blue). (C) Polarized hair cells have a maximum signaling phase of a half stimulus cycle. (i) An idealized sensor maintains a proportional output between deflection and output throughout the stimulus bout. The response interval is therefore constant, as reported by the quantiles (q) of afferent spike phase with respect to the stimulus (ϕ). Thick vertical lines denote the median spike phase. (ii) In real sensors, we observe adaptation from the first to last stimulus intervals. We predict this leads to decreased sensitivity and thus distorted response intervals and increased VS. Peak reafference precedes π/2 and changes over time, so cannot reliably signal body wave progression. (iii) CD (ON) reduces hair cell sensitivity during motor bouts, so hair cells provide feedback only to the strongest cupular deflections coinciding with the passage of the body wave. CD thus restructures afference to reliably signal motor phase throughout the motor bout. CD, corollary discharge; VS, vector strength.
Fig 3
Fig 3. Dynamics of afferent neuron spike activity in response to neuromast deflection depend on CD.
(A) (i) Experiments were performed during open-loop stimulation (first to last interval), during which fish swam spontaneously (motor activity recorded through ventral motor root). The CD was ON during swim bouts and OFF while the fish was inactive. Afferent neuron spiking depended on the combination of stimulation and motor activity, as shown by the moving average of spike count (ii). Individual spikes were classified as evoked (E) when the stimulus was present or spontaneous (S) otherwise. The effect of CD on evoked and spontaneous activity was quantified by the ratio of CD ON/CD OFF, respectively, RE and RS. (B) Raster plot of evoked afferent spike phases during the first and last periods of 5, 20, and 40 Hz stimulation. Stimulus phase is underlaid in blue. (i) In this afferent neuron, when CD OFF the afferent neuron exhibited a strong response to the first stimulus, but a delayed and weaker response to the final stimulus. (ii) In CD ON, there was a reduction of both the number of spikes and the response interval with respect to CD OFF (replicated in gray). In each plot, sweeps progress from bottom to top. All data from one representative individual. Gaps between sweeps arise when the fish ceases swimming due to open-loop stimulation [70]. The data and code underlying this figure may be found at DOI: 10.6084/m9.figshare.13034012. CD, corollary discharge.
Fig 4
Fig 4. Mean effects of adaptation and CD on evoked afferent fiber spike responses.
(A) Average time course of responses to 20 Hz stimulus with CD OFF. Properties of the evoked spike responses were examined through (i) the per-stimulus spike count; (ii) the response interval assessed through the 0.1, 0.5, and 0.9 quantiles of spike phases; (iii) the VS; and (iv) the gain. Spike phases were adjusted by subtracting each neuron’s median phase at each frequency. (B) Mean evoked responses when CD OFF or CD ON at each frequency. Increasing frequency and CD ON (i) reduced per-stimulus spike count, (ii) narrowed response intervals, (iii) increased VS, and (iv) reduced gain. (C) Relative impacts of adaptation and CD were assessed by comparing Last/First to CD ON/CD OFF. (i) Changes in spike count due to adaptation and CD were similar at 5 Hz but relatively larger at 20 and 40 Hz. (ii) At 20 and 40 Hz, adaptation resulted in delayed response intervals. Conversely, CD at all frequencies resulted in narrower intervals. (iii) VS was relatively unaffected by adaptation, but significantly increased by CD. (iv) Gain exhibited large decreases due to adaptation but less so in response to CD. The relative decrease in gain was particularly small at 20 Hz. All effects in B and C are means and standard errors. 5 Hz: n = 13 afferent neurons from N = 12 individuals; 20 Hz: n = 22, N = 21; 40 Hz: n = 15, N = 14. The data and code underlying this figure may be found at DOI: 10.6084/m9.figshare.13034012. CD, corollary discharge; VS, vector strength.
Fig 5
Fig 5. Time course of evoked responses within and immediately after swim bouts.
All response were normalized to the start of the swim. (A) Evoked spike counts and spontaneous spike rates (green) increased to a peak after the end of the swim. (B) Response phases exhibited a complex pattern over the course of the swim bout. Early (0.1 q) and late (0.9 q) spikes exhibited opposite trends. Median spike phase (0.5 q) remained nearly constant over the swim duration. (C) VS declined to a minimum in the post-swim period, which is related to the opposite trends of the 0.1 and 0.9 q. (D) Gain increased over the swim to a maximum in the post-swim period. p < 0.001 for all smooth functions in each panel. The data and code underlying this figure may be found at DOI: 10.6084/m9.figshare.13034012. CD, corollary discharge; VS, vector strength.
Fig 6
Fig 6. Heterogeneous adaptation rates and CD strengths result in distinct afferent neuron response types.
(A) (i) The ratios (CD ON/CD OFF) of evoked and spontaneous activities (RE and RS) revealed 3 distinct clusters of response types. (ii) RE and RS were equal in groups 1 and 2 (Δ Inhibition = 0) but diverged in group 3. (iii) The extent of adaptation increased from group 1 to group 3, shown as First/Last responses to highlight the range of adaptation. (B) Evoked activities and responses to CD differ among response types at 20 Hz. (i) Only groups 1 and 3 exhibited significant CD inhibition, as followed from the cluster analysis. (ii) Group 1 and 2 responses had wider response intervals than group 3, but all groups’ response intervals were narrowed by CD. Additionally, CD ON resulted in a delayed median phase of groups 1 and 3, compared with the median phase of CD OFF. (iii) The larger response interval widths of groups 1 and 2 resulted in lower vector strength that was more impacted by CD, compared with group 3. (iv) Gain was substantially reduced in group 1 responses reduced and constant or slightly increased in groups 2 and 3, although still approximately unity. Data and code underlying this figure and details of statistics and group comparisons may be found at DOI: 10.6084/m9.figshare.13034012. CD, corollary discharge; VS, vector strength.
Fig 7
Fig 7. Computational model of the effects of heterogeneity on lateral line sensing.
(A) (i) Schematic of the 2-state model of lateral line feedback. The input stimulus is transduced by a sensor with variable gain and regeneration rates. The simulated sensor responds probabilistically to the stimulus only while in its sensitive state, after which it transitions to and remains in the insensitive state until regeneration. Tuning of the gain and regeneration constants was used to model adapting and nonadapting response types when subject to inhibition of strength RS. (B) Simulated responses of an adapting sensor to stimulation with no inhibition (i) or to strong inhibition in the absence of stimulation (ii). Our model recapitulated the observed changes in spike rate in each condition. After stimulation, the sensor exhibited a refractory period before recovering spontaneous spike rates, whereas after suppression it exhibited rebound spiking. (C) Adaptation rates determine the dependence of spike count (i) and phase interval (ii) on inhibition. Nonadapting responses were constant over time and both spike count and response intervals were reduced proportionately to RS. Responses of adapting sensors were nonlinear over time and with respect to inhibition strength, although the nonlinearities were largely suppressed by the strongest level of inhibition (0.9 RS). Spike counts and phases were normalized to the steady states with 1.0 RS. (D) Nonadapting responses maintained RE = RS for all RS, whereas RE > RS for all RS < 1 in adapting responses, supporting the observed response clusters in Fig 6. Dashed and solid gray lines denote the trajectories of nonadapting and adapting responses at inhibition strength intervals of 0.02. Values at RS = 1 are staggered for visibility. (E) Simulated feedback from a population of heterogeneous sensors. (i) In the absence of inhibition (1.0 RS), stimulus phase was difficult to discriminate. Strong inhibition (0.1 RS) resulted in regular feedback closely corresponding to the stimulus peaks (triangles). (ii) The stimulus frequency was poorly reflected in the ISIs at 1.0 RS, but at 0.1 RS, we observed prominent peaks corresponding to integer multiples of the stimulus frequency. The ISIs corresponding to density peaks at each RS are denoted by circles. Vertical dashed line is the ISI of spontaneous spiking activity. The data and code underlying this figure may be found at DOI: 10.6084/m9.figshare.13034012. ISI, interspike interval.

Similar articles

Cited by

References

    1. Tuthill JC, Azim E. Proprioception. Curr Biol. 2018;28:R194–203. doi: 10.1016/j.cub.2018.01.064 - DOI - PubMed
    1. Pearson KG. Reflex Reversal in the Walking Systems of Mammals and Arthropods. In: Ferrell WR, Proske U, editors. Neural Control of Movement. Boston, MA: Springer US; 1995. p. 135–141. doi: 10.1007/978-1-4615-1985-0_18 - DOI
    1. Crapse TB, Sommer MA. Corollary discharge across the animal kingdom. Nat Rev Neurosci. 2008;9:587–600. doi: 10.1038/nrn2457 - DOI - PMC - PubMed
    1. Straka H, Simmers J, Chagnaud BP. A New Perspective on Predictive Motor Signaling. Curr Biol. 2018;28:R232–43. doi: 10.1016/j.cub.2018.01.033 - DOI - PubMed
    1. Putney J, Conn R, Sponberg S. Precise timing is ubiquitous, consistent, and coordinated across a comprehensive, spike-resolved flight motor program. Proc Natl Acad Sci U S A. 2019;116:26951–60. doi: 10.1073/pnas.1907513116 - DOI - PMC - PubMed

Publication types