. 2021 Dec;600(7889):523-529.
doi: 10.1038/s41586-021-04085-y. Epub 2021 Oct 11.

Impact of circulating SARS-CoV-2 variants on mRNA vaccine-induced immunity

Collaborators, Affiliations

Impact of circulating SARS-CoV-2 variants on mRNA vaccine-induced immunity

Carolina Lucas et al. Nature. 2021 Dec.

Abstract

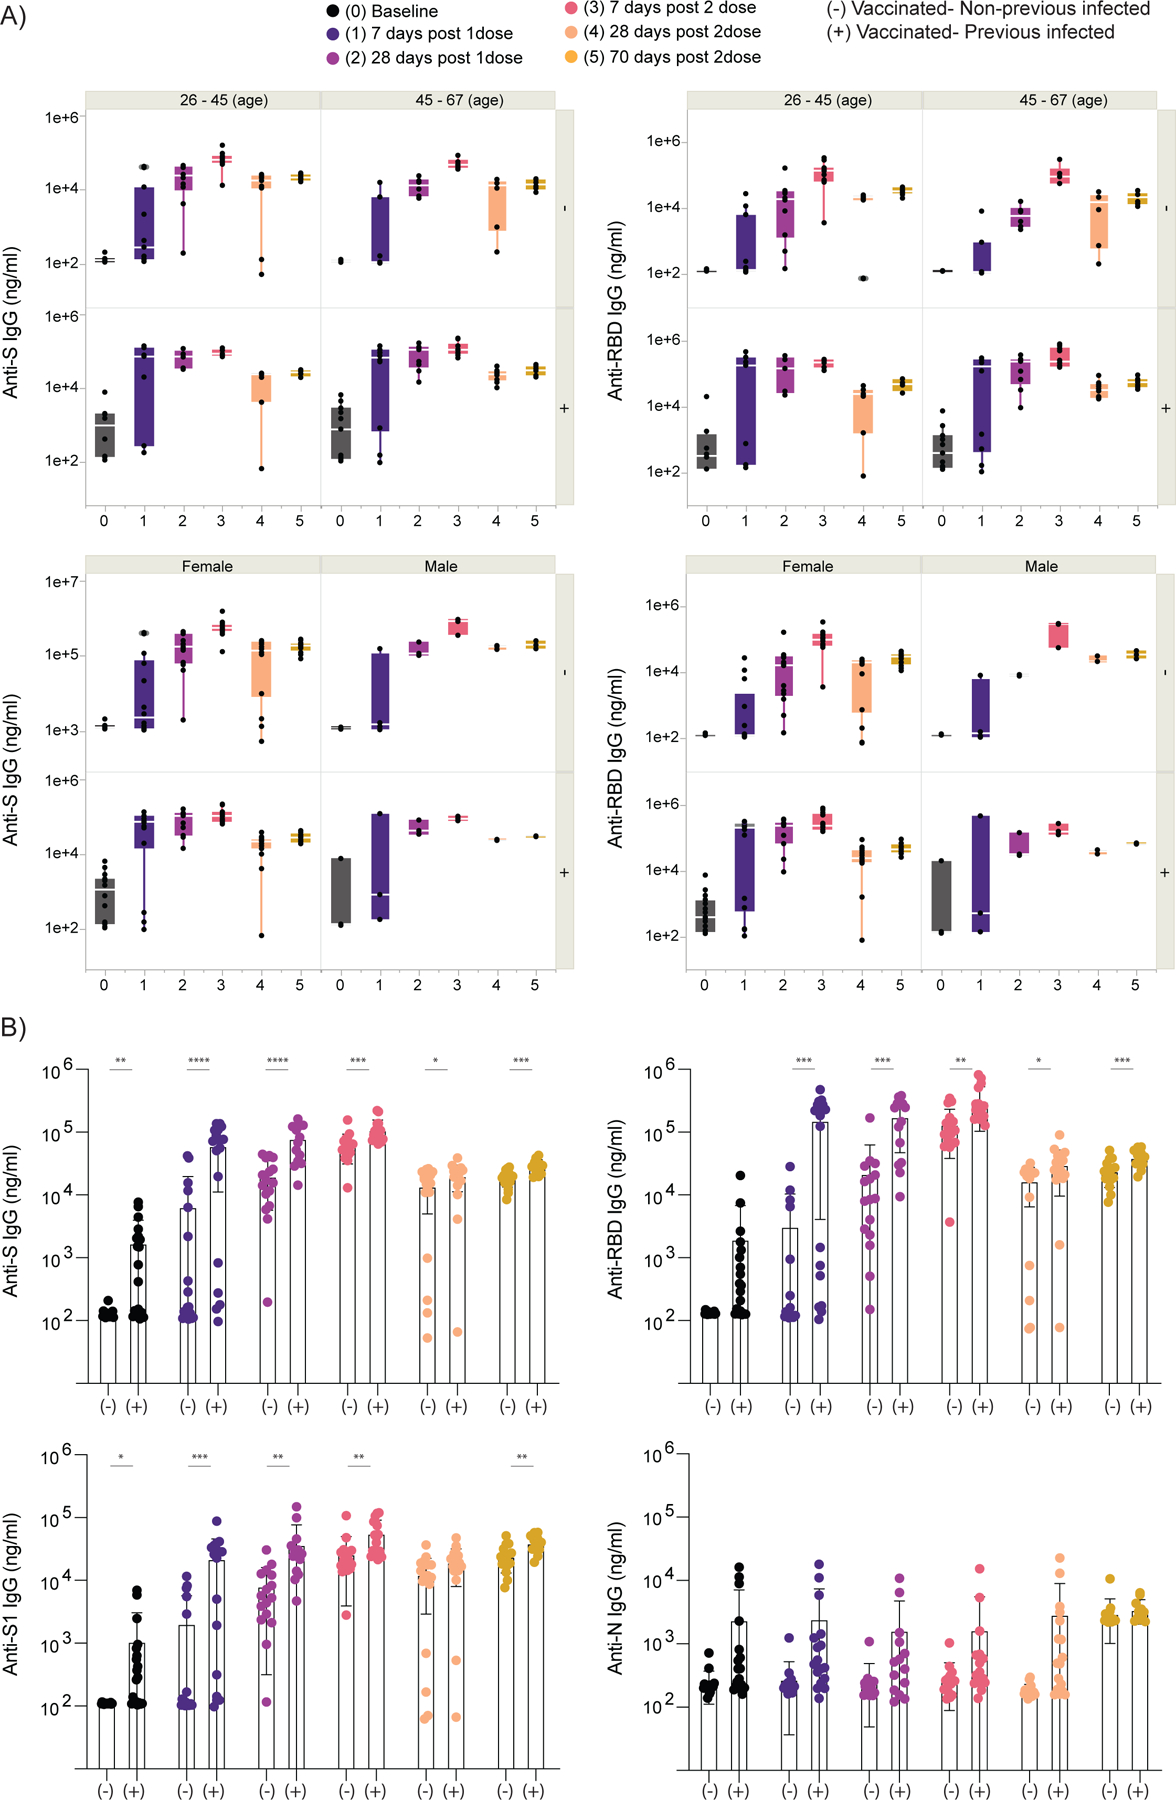
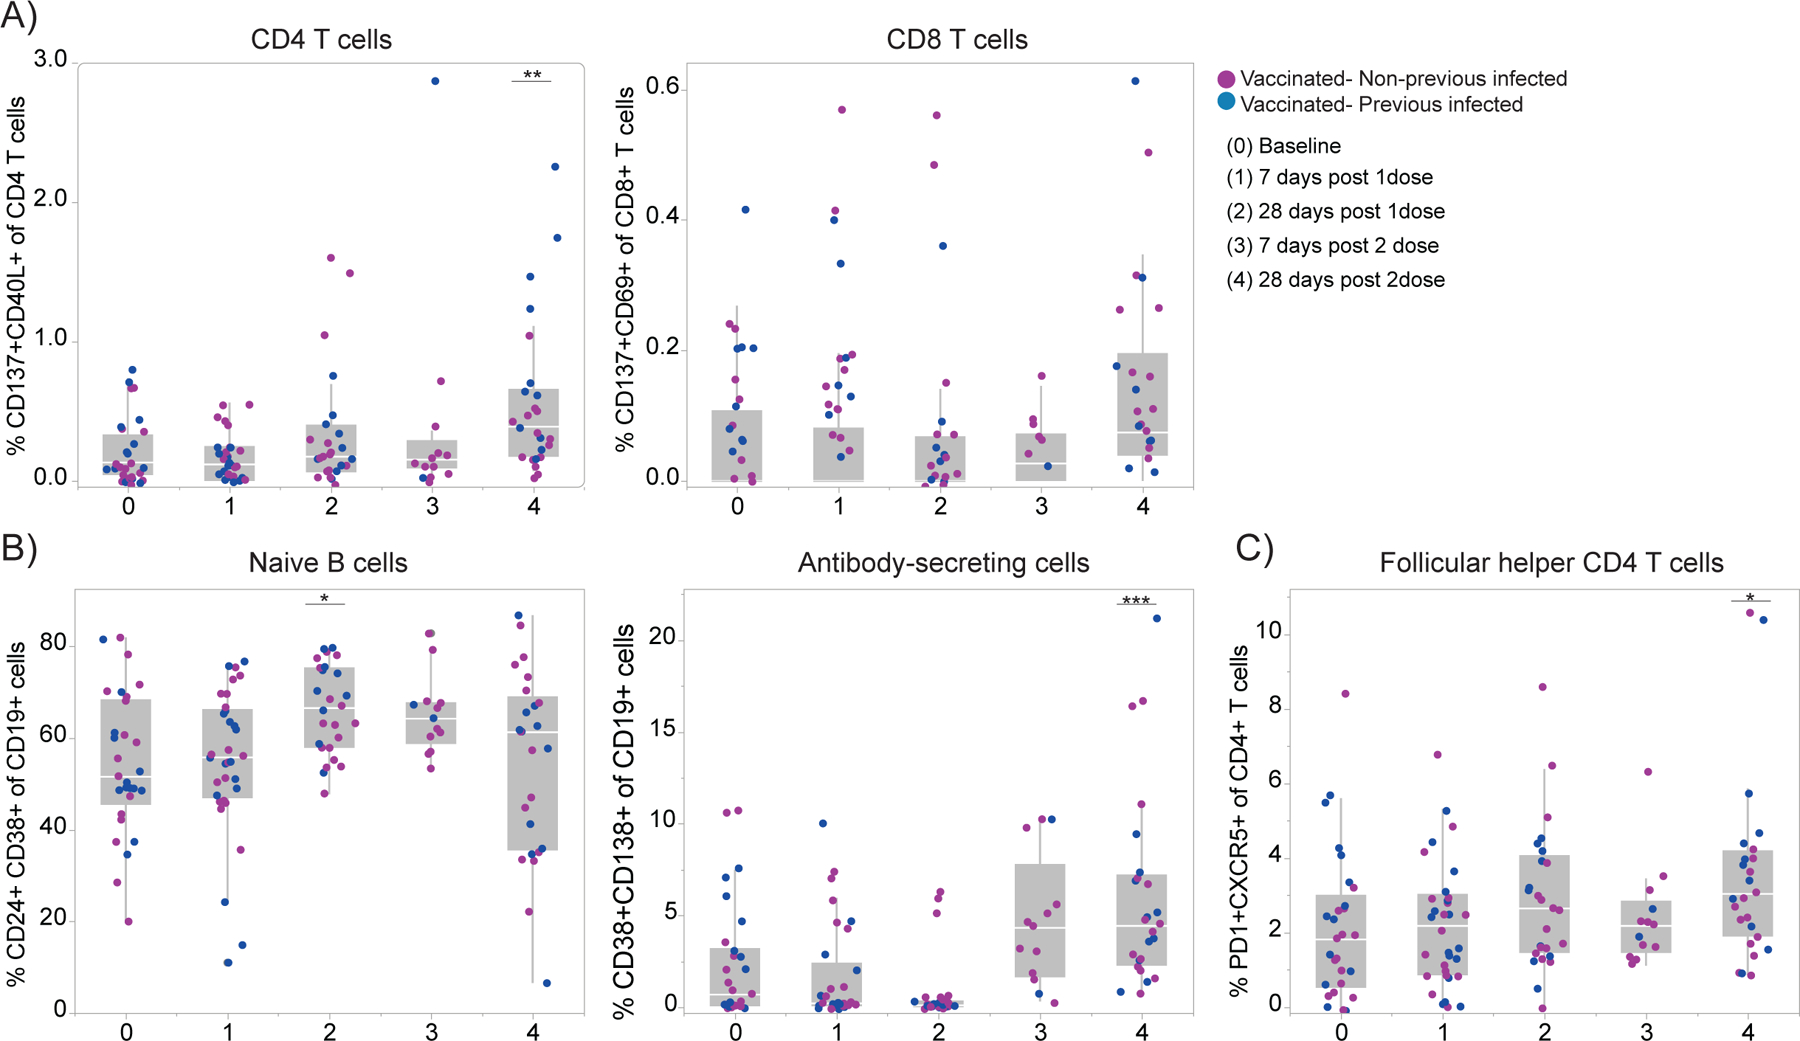
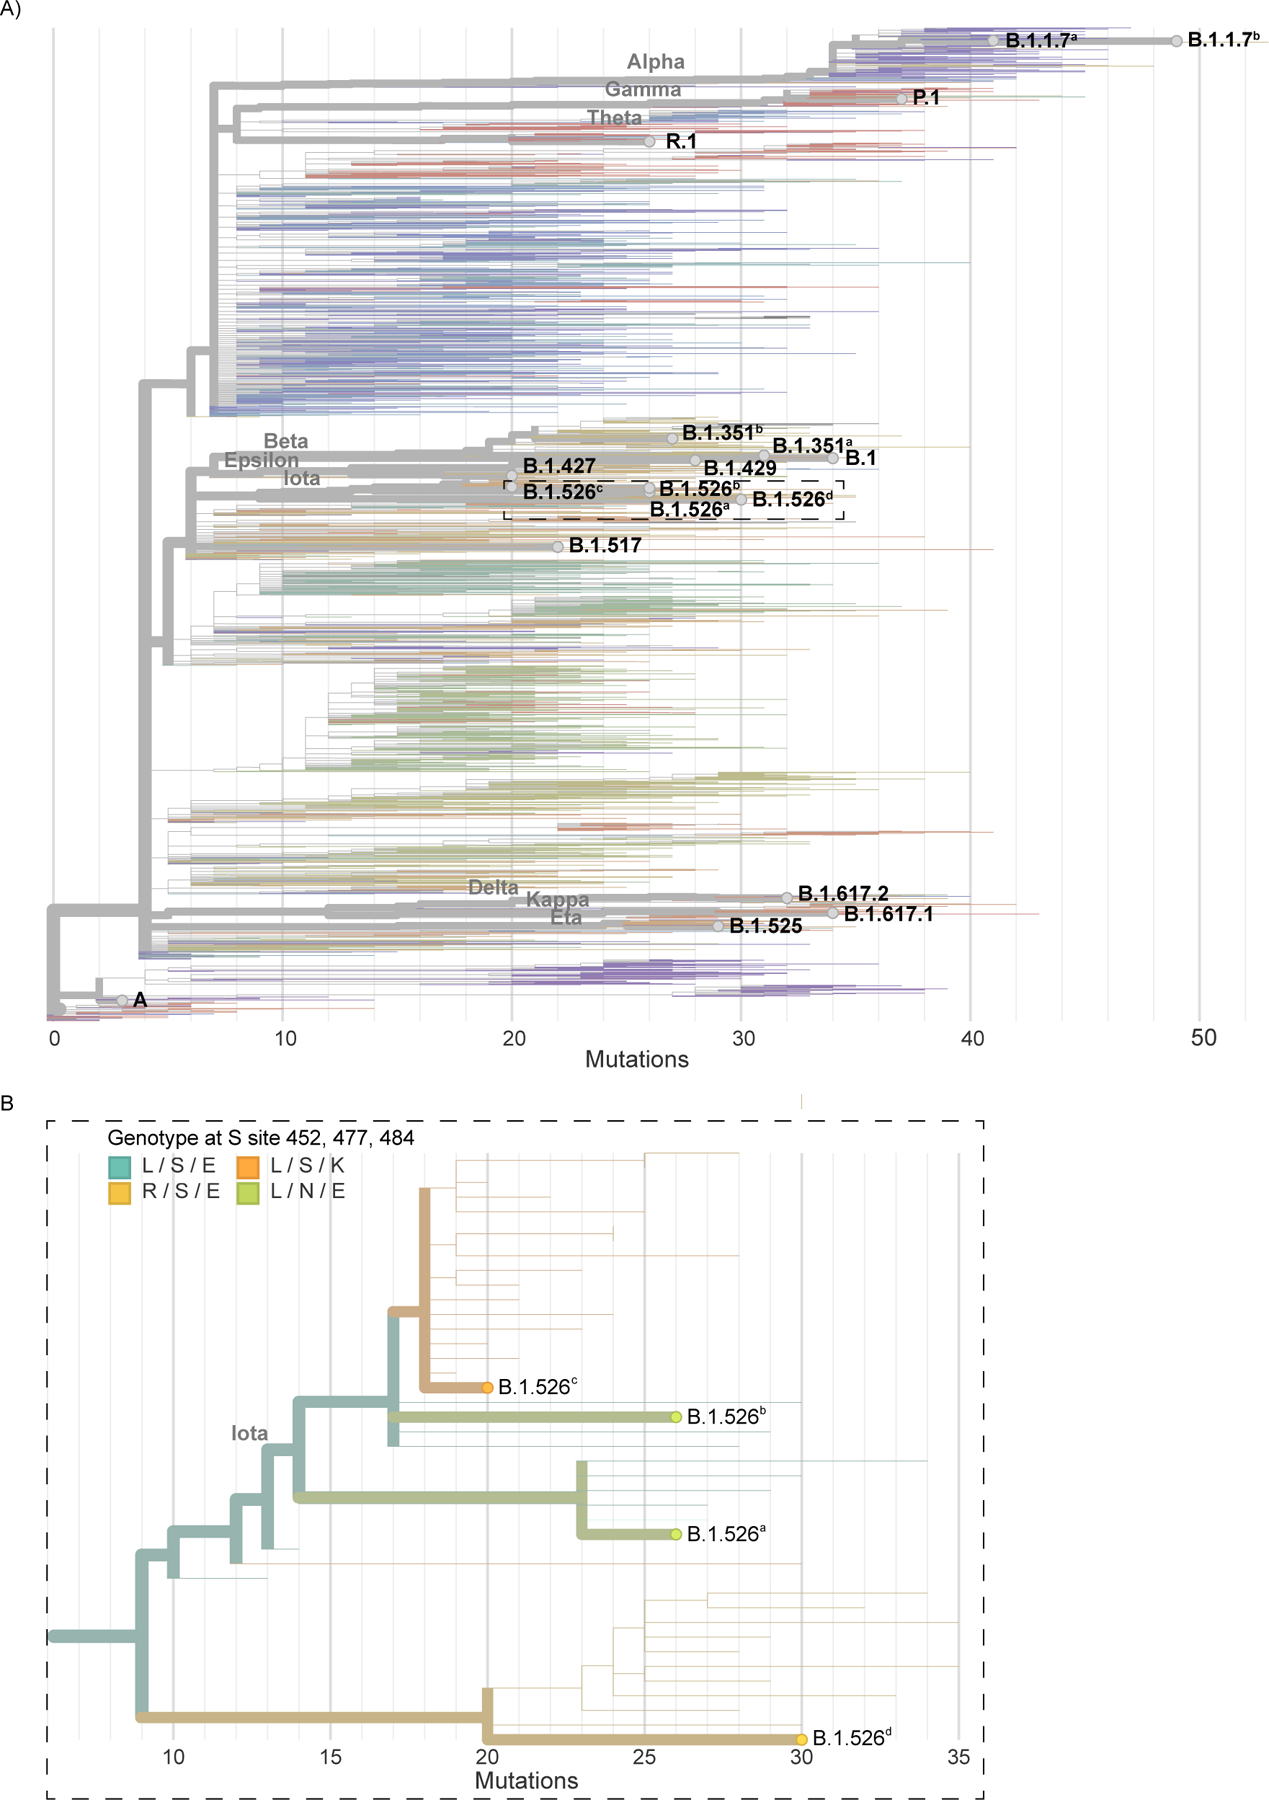
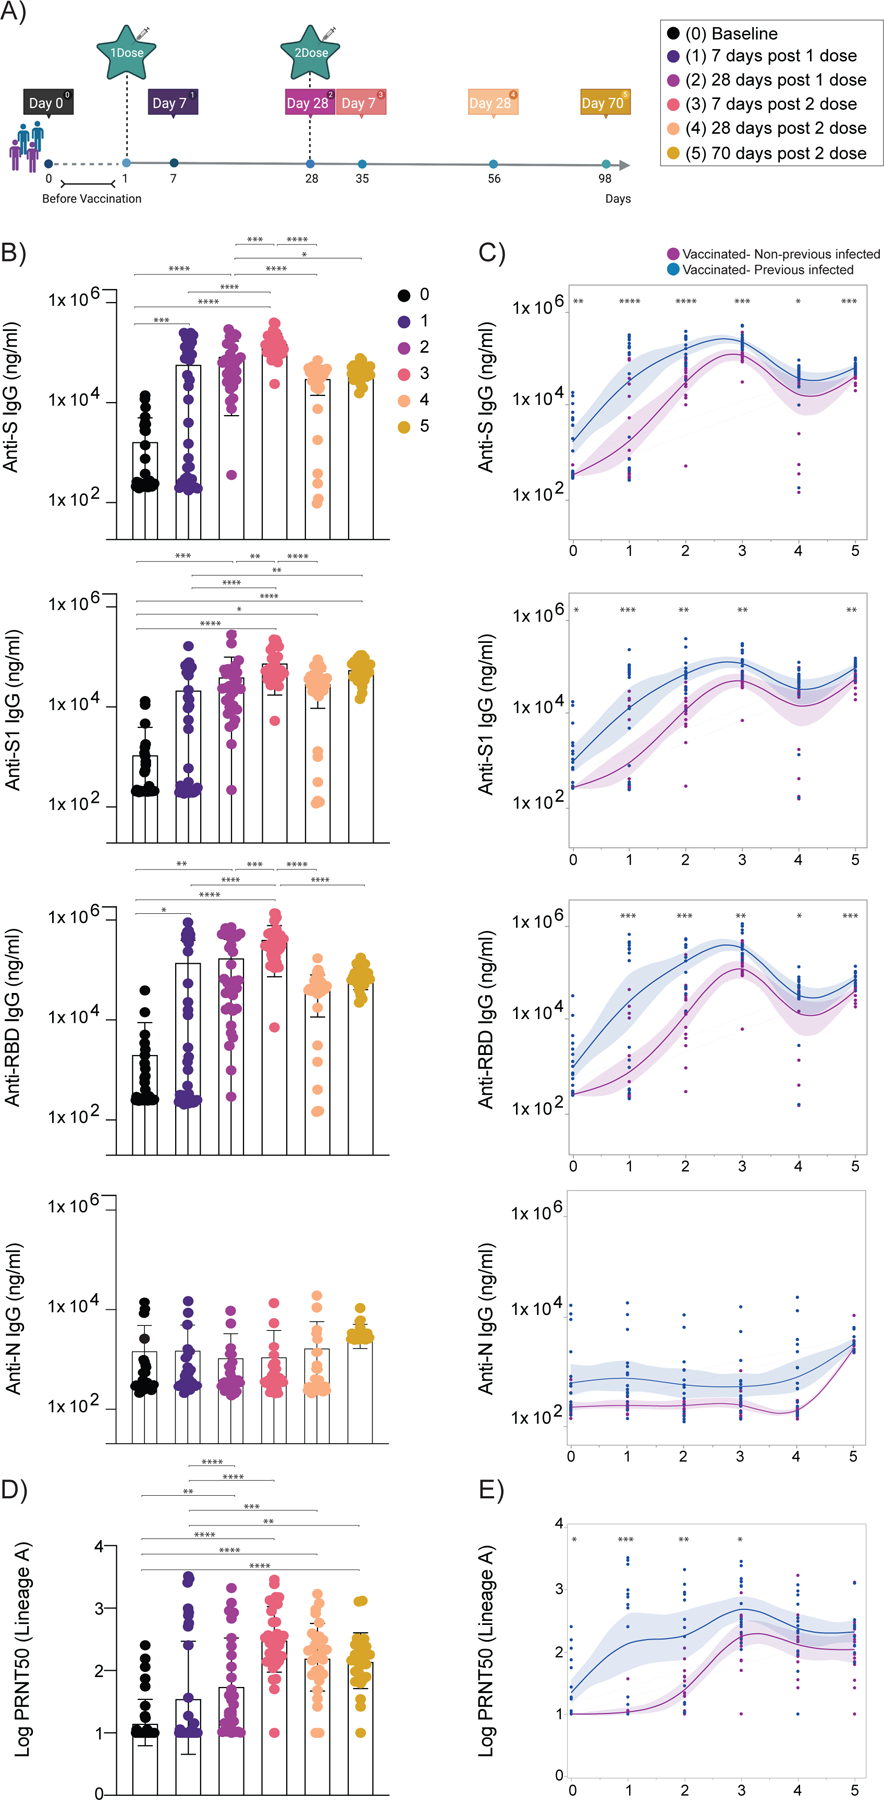
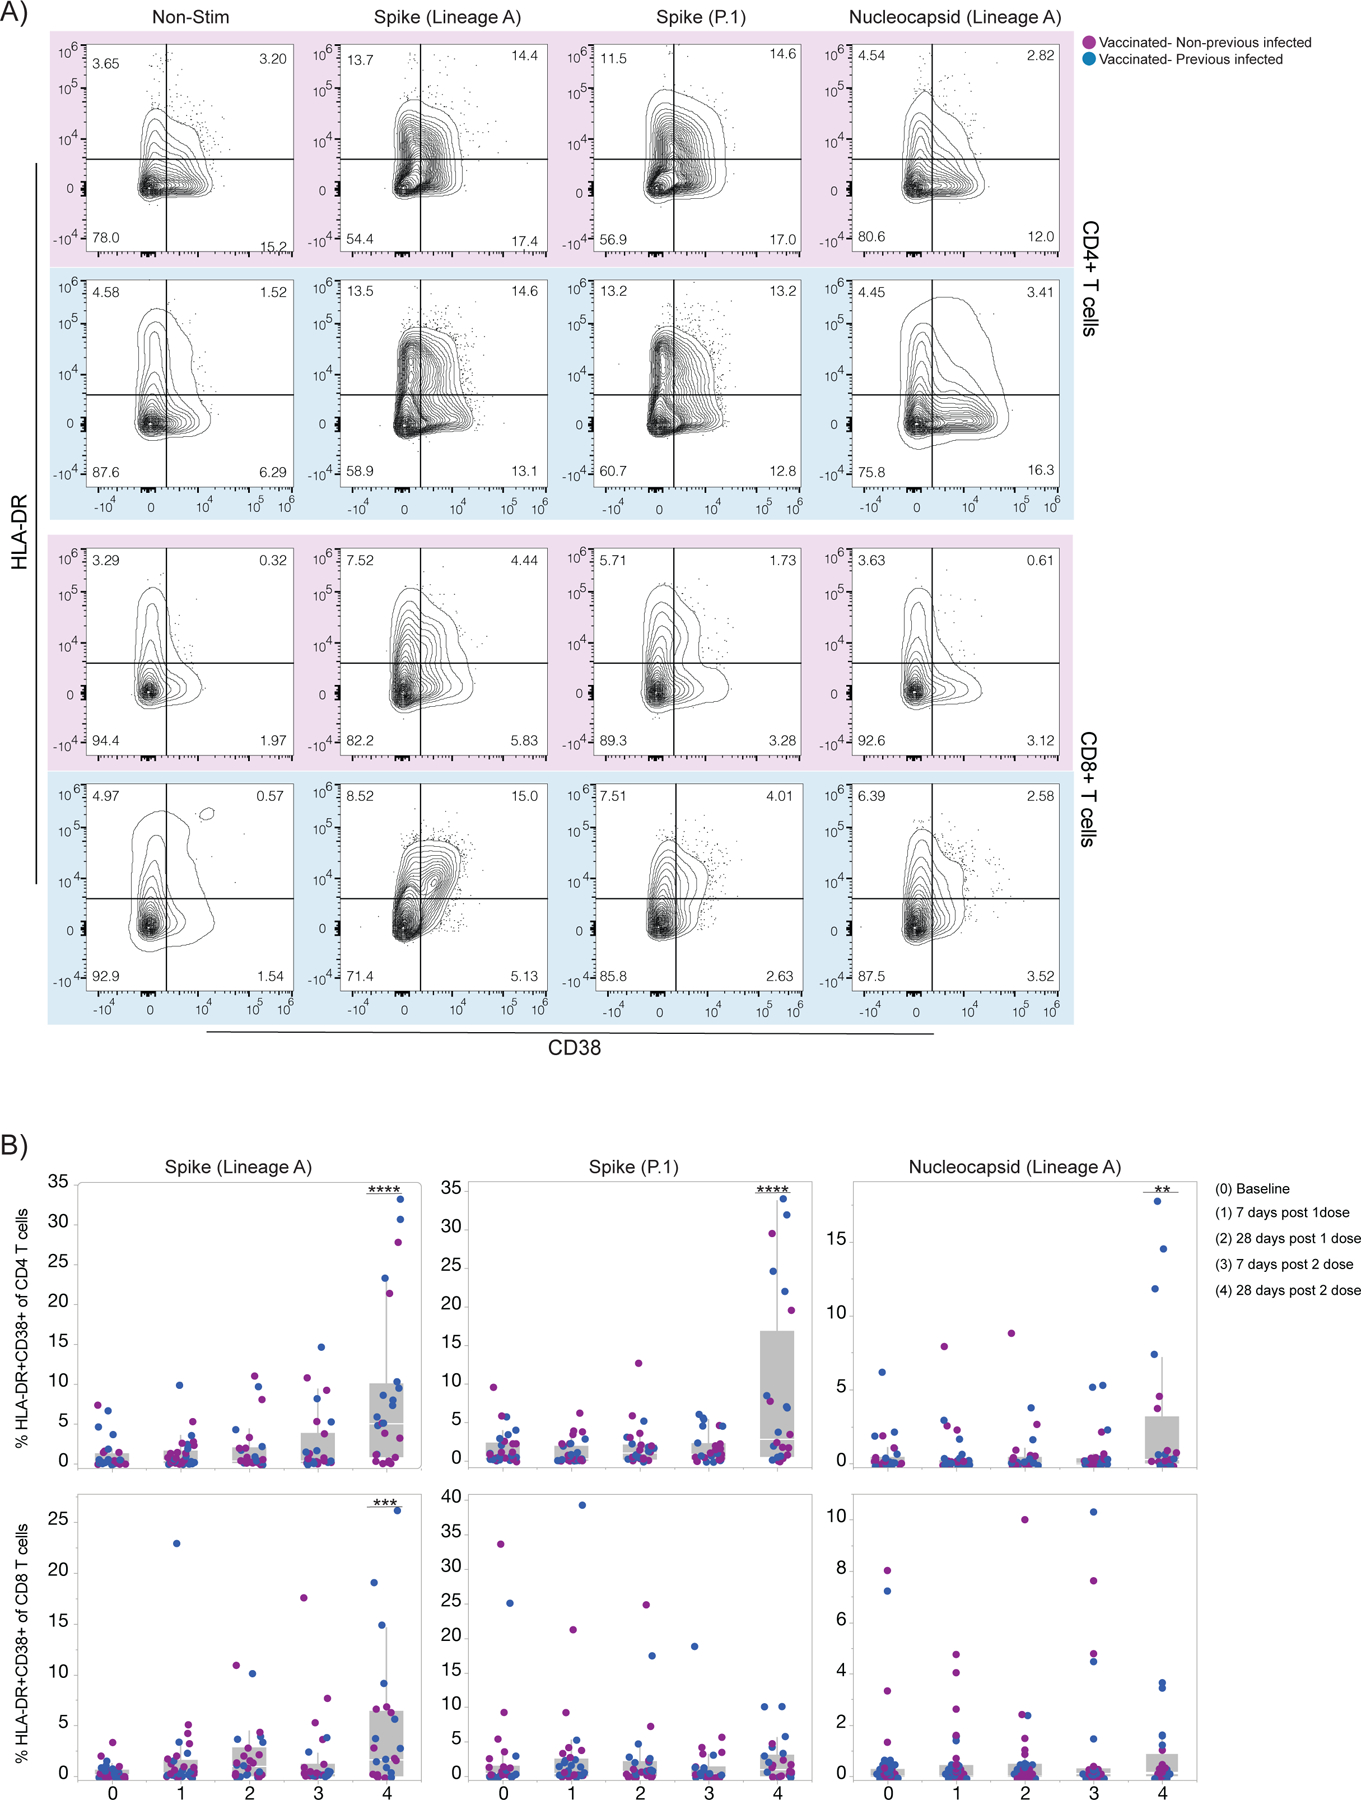
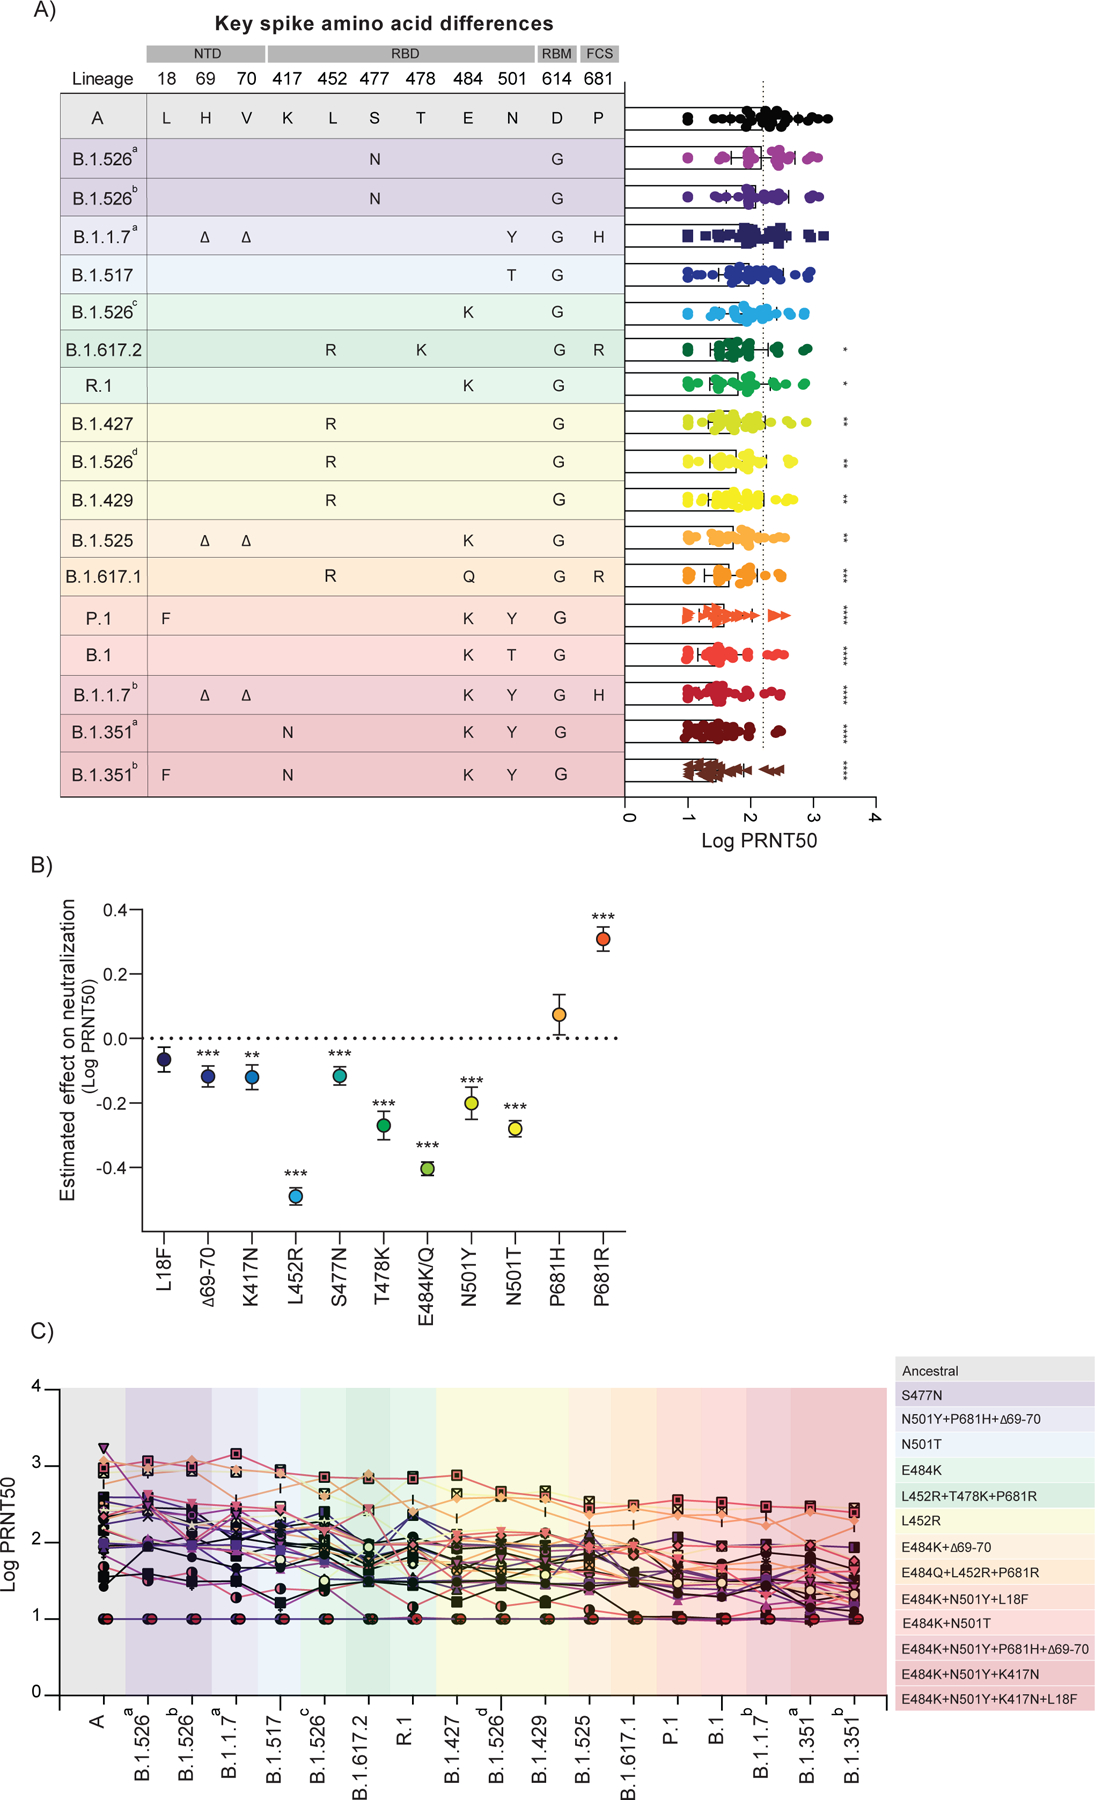
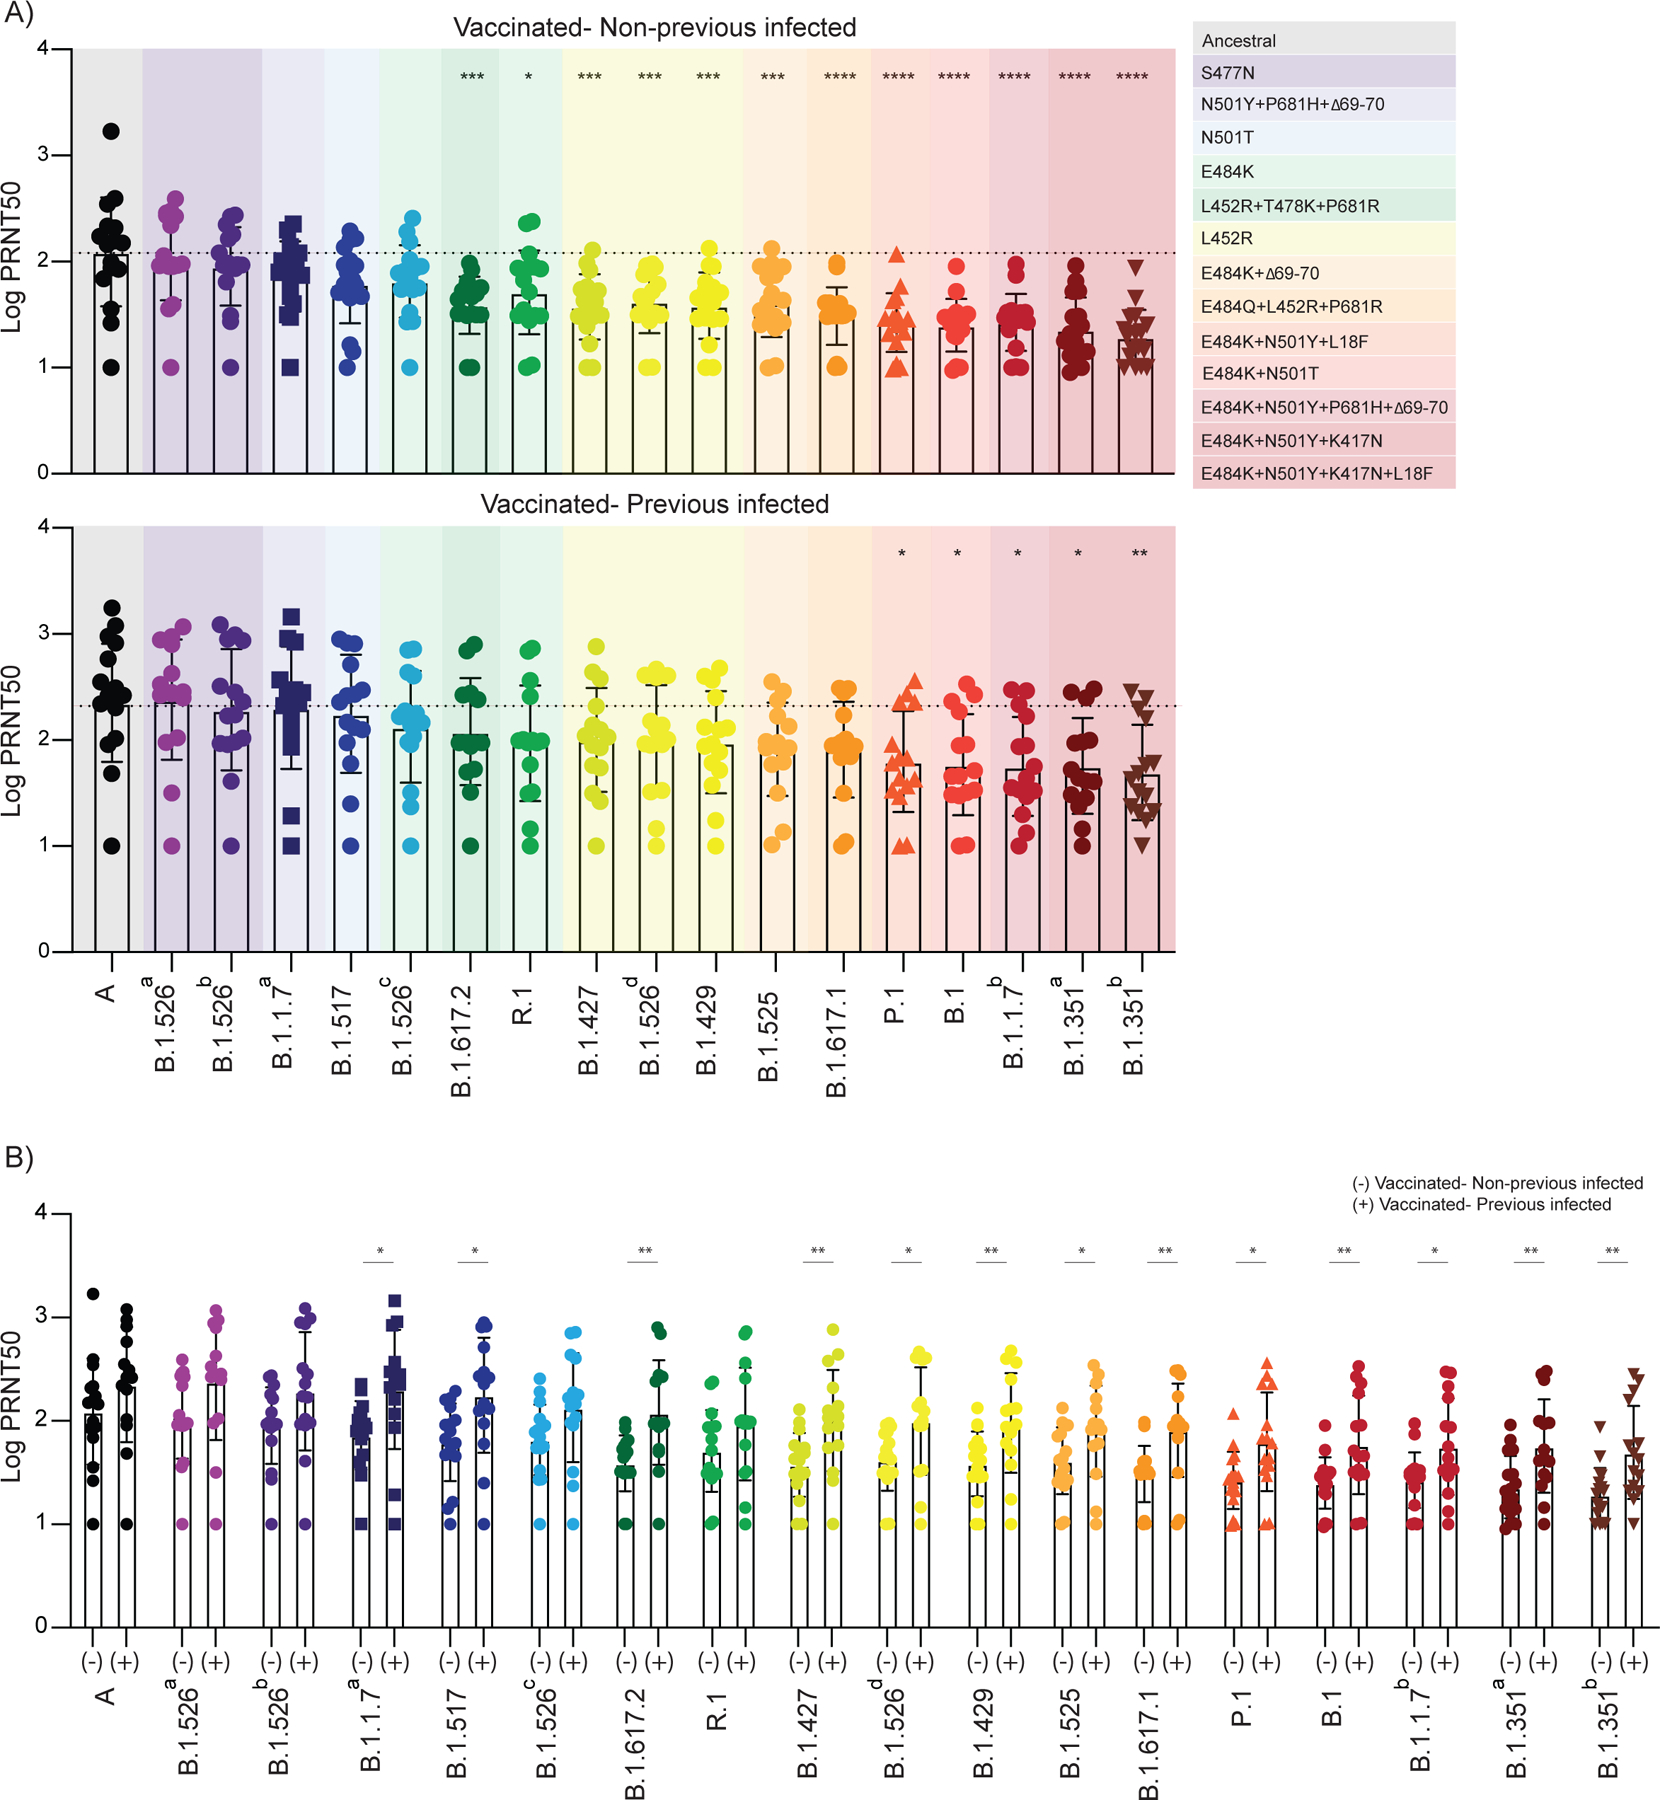
The emergence of SARS-CoV-2 variants with mutations in major neutralizing antibody-binding sites can affect humoral immunity induced by infection or vaccination1-6. Here we analysed the development of anti-SARS-CoV-2 antibody and T cell responses in individuals who were previously infected (recovered) or uninfected (naive) and received mRNA vaccines to SARS-CoV-2. While individuals who were previously infected sustained higher antibody titres than individuals who were uninfected post-vaccination, the latter reached comparable levels of neutralization responses to the ancestral strain after the second vaccine dose. T cell activation markers measured upon spike or nucleocapsid peptide in vitro stimulation showed a progressive increase after vaccination. Comprehensive analysis of plasma neutralization using 16 authentic isolates of distinct locally circulating SARS-CoV-2 variants revealed a range of reduction in the neutralization capacity associated with specific mutations in the spike gene: lineages with E484K and N501Y/T (for example, B.1.351 and P.1) had the greatest reduction, followed by lineages with L452R (for example, B.1.617.2). While both groups retained neutralization capacity against all variants, plasma from individuals who were previously infected and vaccinated displayed overall better neutralization capacity than plasma from individuals who were uninfected and also received two vaccine doses, pointing to vaccine boosters as a relevant future strategy to alleviate the effect of emerging variants on antibody neutralizing activity.


Conflict of interest statement

Competing interests: AI served as a consultant for Spring Discovery, Boehringer Ingelheim and Adaptive Biotechnologies. IY reported being a member of the mRNA-1273 Study Group and has received funding to her institution to conduct clinical research from BioFire, MedImmune, Regeneron, PaxVax, Pfizer, GSK, Merck, Novavax, Sanofi-Pasteur, and Micron. NDG is a consultant for Tempus Labs to develop infectious disease diagnostic assays.

All other authors declare no competing interests.

Figures

Extended Data Figure 1 |
Extended Data Figure 1 |. Correlation of virus-specific antibodies with age and sex of participants.
a,b, Plasma reactivity to S protein and RBD in vaccinated participants measured over time by ELISA. HCW participants received 2 doses of the mRNA vaccines and plasma samples were collected as at the indicated time points (TP). Baseline, previously to vaccination; 1 Time point, 7 days post 1 dose; 2 Time point, 28 days post 1 dose; 3 Time point, 7 days post 2 dose; 4 Time point, 28 days post 2 dose; 5 Time point, 70 days post 2 dose. a, Anti-S (left) and Anti-RBD (right) IgG levels stratified by vaccinated participants accordingly to age and sex. Significance was accessed using unpaired two-tailed t-test. Boxes represent variables’ distribution with quartiles and outliers. Horizontal bars, mean values. b, Anti-S, Anti-S1, Anti-RBD and Anti-N IgG comparison in vaccinated participants previously infected or not to SARS-CoV-2. Longitudinal data plotted over time. Significance was accessed using unpaired two-tailed t-test. Boxes represent mean values ± standard deviations. TP, vaccination time point. Anti-S IgG (TP0, n=37; TP1, n=35; TP2, n=30; TP3, n=34; TP4, n=34; TP5, n=28). Anti-S1 IgG (TP0, n=37; TP1, n=35; TP2, n=30; TP3, n=34; TP4, n=34; TP5, n=27). Anti-RBD IgG (TP0, n=37; TP1, n=35; TP2, n=30; TP3, n=34; TP4, n=34; TP5, n=27). Anti-N IgG (TP0, n=37; TP1, n=35; TP2, n=30; TP3, n=34; TP4, n=34; TP5, n=27). S, spike. S1, spike subunit 1. RBD, receptor binding domain. N, nucleocapsid. Each dot represents a single individual. ****p < .0001 ***p < .001 **p < .01*p < .05.
Extended Data Figure 2 |
Extended Data Figure 2 |. Cellular immune profiling post SARS-CoV-2 vaccination.
a-b, Immune cell subsets of interest, plotted as a percentage of a parent population over time according to the vaccination time points. HCW participants received 2 doses of the mRNA vaccines and PBMCs samples were collected as at the indicated time points (TP). Baseline, previously to vaccination; 1 Time point, 7 days post 1 dose; 2 Time point, 28 days post 1 dose; 3 Time point, 7 days post 2 dose; 4 Time point, 28 days post 2 dose. Percentage of activated T cell subsets (a), B cell subsets (b) and Tfh cells (c) among vaccinated individuals over time. Individuals previously infected to SARS-CoV-2 or uninfected are indicated by blue or purple dots, respectively. Each dot represents a single individual. Significance was assessed by One-way ANOVA corrected for multiple comparisons using Dunnett’s method. Vaccination time points were compared with baseline. Boxes represent variables’ distribution with quartiles and outliers. Horizontal bars, mean values.TP, vaccination time point (TP0, n = 29; TP1, n=33; TP2, n =26; TP3, n = 13; TP4, n=25). ***p < .001 **p < .01*p < .05.
Extended Data Figure 3 |
Extended Data Figure 3 |. Maximum likelihood phylogeny of SARS-CoV-2 genomes of cultured virus isolates.
a, Nextclade (https://clades.nextstrain.org/) was used to generate a phylogenetic tree to show evolutionary relations between the cultured virus isolates used in this study and other publicly available SARS-CoV-2 genomes. Branches are colored by Pango Lineage, and labelled according to the WHO naming scheme. Highlighted are the cultured virus isolates used in this study. b, Enlarged section of the phylogenetic tree highlighting spike amino acid changes in the B.1.526 (iota) lineage viruses belonging to different clades.
Extended Data Figure 4 |
Extended Data Figure 4 |. Gating strategies.
Gating strategies are shown for the key cell populations described in Figure 2 and Extended Data Figure 2. a, Leukocyte gating strategy to identify lymphocytes. T cell surface staining gating strategy to identify CD4 and CD8 T cells, TCR-activated T cells and follicular T cells. b, B cell surface staining gating strategy to identify B cells subsets.
Figure 1 |
Figure 1 |. Temporal dynamics of anti-SARS-CoV-2 antibodies in vaccinated participants.
a, Cohort timeline overview indicated by days post SARS-CoV-2 mRNA vaccination. HCW participants received 2 doses of the mRNA vaccine and plasma samples were collected as indicated. Baseline, prior to vaccination; Time point (TP) 1, 7 days post 1 dose; TP 2, 28 days post 1 dose; TP 3, 7 days post 2 dose; TP 4, 28 days post 2 dose; TP 5, 70 days post 2 dose. Participants were stratified based on previous exposure to SARS-CoV-2 (purple: Vaccinated- uninfected; blue: Vaccinated-Previously infected). b, c, Plasma reactivity to S protein, RBD and Nucleocapsid measured over time by ELISA. b, Anti-S, Anti-S1, Anti-RBD and Anti-N IgG levels. c, Anti-S, Anti-S1, Anti-RBD and Anti-N IgG comparison in vaccinated participants previously infected or not to SARS-CoV-2. S, spike. S1, spike subunit 1. RBD, receptor binding domain. N, nucleocapsid. d, e, Longitudinal neutralization assay using wild-type SARS-CoV-2, ancestral strain (WA1, USA). d, Neutralization titer (PRNT50) over time. b, d, Significance was assessed by One-way ANOVA corrected for multiple comparisons using Tukey’s method. Boxes represent mean values ± standard deviations. e, Plasma neutralization capacity between vaccinated participants previously infected or not to SARS-CoV-2. c, e, Longitudinal data plotted over time continuously. Regression lines are shown as blue (previously infected) and purple (uninfected). Lines indicate cross-sectional averages from each group with shading representing 95% CI and are coloured accordingly. Significance was accessed using unpaired two-tailed t-test. TP, vaccination time point (TP0, n=37; TP1, n=35; TP2, n=30; TP3, n=34; TP4, n=31; TP5, n=27). Each dot represents a single individual. ****p < .0001 ***p < .001 **p < .01*p < .05.
Figure 2 |
Figure 2 |. Temporal dynamics of anti-SARS-CoV-2 T cell immunity in vaccinated participants.
a, b, SARS-CoV-2 S-reactive CD4+ and CD8+T cells after in vitro stimulation with SARS-CoV-2 S-I and S-II peptide pools and Nucleoprotein peptides pool. a, Representative dot plots from four vaccinated individuals, 28 days post 2 vaccination dose, showing the percentage of double-positive cells expressing HLA-DR and CD38 out of CD4+T cells (top) and CD8+T cells (bottom). Individuals previously infected to SARS-CoV-2 or uninfected are indicated by blue or purple shades, respectively. b, Percentage of double-positive cells, S-reactive and N-reactive out of CD4+T cells (top) and CD8+T cells (bottom) over time post-vaccination. Individuals previously infected to SARS-CoV-2 or uninfected are indicated by blue or purple dots, respectively. Each dot represents a single individual. Significance was assessed by One-way ANOVA corrected for multiple comparisons using Dunnett’s method. Vaccination time points were compared with baseline. Stimulation values were subtracted from the respective non-stimulation condition. Boxes represent variables’ distribution with quartiles and outliers. Horizontal bars, mean values. TP, vaccination time point (TP0, n = 30; TP1, n=34; TP2, n =27; TP3, n = 27; TP4, n=24). Non-Stim, non-stimulated PBMCs. Nucleocapsid, PBMCs stimulated with SARS-CoV-2 nucleocapsid (N) protein pool derived from the ancestral lineage A virus, WA1, USA. Spike, PBMCs stimulated with SARS-CoV-2 spike (S) protein pool derived from the ancestral strain lineage A, WA1, USA. Spike (P.1), PBMCs stimulated with SARS-CoV-2 Spike (S) protein pool derived from the P.1 variant. ****p < .0001***p < .001 **p < .01*p < .05.
Figure 3 |
Figure 3 |. Impact of SARS-CoV-2 VOC on neutralization capacity of vaccinated participants.
a, Plasma neutralization titers against ancestral lineage A virus, (WA1, USA) and locally circulating variants. Sixteen SARS-CoV-2 variants were isolated from nasopharyngeal swabs of infected individuals and an additional B.1.351 isolate was obtained from BEI. Neutralization capacity was assessed using plasma samples from vaccinated participants, 28 days post SARS-CoV-2 second vaccination dose at the experimental sixfold serial dilutions (from 1:3 to 1:2430). a, Key spike mutations within the distinct lineages and plasma neutralization titers (PRNT50). Spike mutations are arranged across columns and rows represent lineages. Significance was assessed by One-way ANOVA corrected for multiple comparisons using Dunnett’s method. Neutralization capacity of variants was compared to neutralization capacity against the ancestral strain. Boxes represent mean values ± standard deviations. Dotted line indicates the mean value of PRNT50 to ancestral strain. n=32. b, Estimated effect of individual mutations on plasma neutralization titers. Neutralization estimates (Log PRNT50) and significance were tested with a linear mixed model with subject-level random effects. Dots represent the ratio of linear mixed model coefficients + intercept to the intercept alone, and error bars represent the standard error. ****p < .0001***p < .001 **p < .01*p < .05. c, Individual trajectories of plasma neutralization titers (PRNT50). Each line represents a single individual. n=32. Dotted line indicates the mean value of PRNT50 to ancestral strain of previously infected individuals, prior to vaccination (baseline). Variants were grouped giving specific-spike mutations and are coloured accordingly. ****p < .0001 ***p < .001 **p < .01*p < .05. NTD, amino-terminal domain. RBD, receptor-binding domain. RBM, receptor-binding motif. FCS, furin cleavage site.
Figure 4 |
Figure 4 |. Neutralizing activity comparison in vaccinated healthcare workers previously infected or not to SARS-CoV-2.
a-b,Plasma neutralization titers against ancestral lineage A virus, (WA1, USA) and locally circulating variants of concern or interest, and other lineages. Sixteen SARS-CoV-2 variants were isolated from nasopharyngeal swabs of infected individuals and an additional B.1.351 isolate was obtained from BEI. Neutralization capacity was accessed using plasma samples from vaccinated participants, 28 days post SARS-CoV-2 second vaccination dose at the experimental sixfold serial dilutions (from 1:3 to 1:2430). a, b, Neutralization capacity between vaccinated participants previously infected or not to SARS-CoV-2. a, Neutralization titer among vaccinated individuals. Significance was assessed by One-way ANOVA corrected for multiple comparisons using Dunnett’s method. Neutralization capacity to the variants was compared to neutralization capacity against the ancestral strain. Boxes represent mean values ± standard deviations. Dotted line indicates the mean value of PRNT50 to ancestral strain. Variants were grouped giving specific-spike mutations and are coloured accordingly. ****p < .0001 ***p < .001 **p < .01*p < .05. b, Neutralization titer comparison among vaccinated participants previously infected or not to SARS-CoV-2. Significance was accessed using unpaired two-tailed t-test. Boxes represent mean values ± standard deviations. (−) Vaccinated-uninfected, n=17; (+) Vaccinated-Previously infected, n=15. Each dot represents a single individual **p < .01*p < .05.

References

Main references

    1. Cele S et al. Escape of SARS-CoV-2 501Y.V2 from neutralization by convalescent plasma. Nature 593, 142–146 (2021). - PMC - PubMed
    1. Garcia-Beltran WF et al. Multiple SARS-CoV-2 variants escape neutralization by vaccine-induced humoral immunity. Cell 184, 2372–2383.e9 (2021). - PMC - PubMed
    1. Wang Z et al. mRNA vaccine-elicited antibodies to SARS-CoV-2 and circulating variants. Nature 592, 616–622 (2021). - PMC - PubMed
    1. Chen RE et al. Resistance of SARS-CoV-2 variants to neutralization by monoclonal and serum-derived polyclonal antibodies. Nat. Med 27, 717–726 (2021). - PMC - PubMed
    1. Wang P et al. Antibody resistance of SARS-CoV-2 variants B.1.351 and B.1.1.7. Nature 593, 130–135 (2021). - PubMed

Methods references

    1. Amanat F et al. A serological assay to detect SARS-CoV-2 seroconversion in humans. Nat. Med 26, 1033–1036 (2020). - PMC - PubMed
    1. Kalinich CC et al. Real-time public health communication of local SARS-CoV-2 genomic epidemiology. PLoS Biol 18, e3000869 (2020). - PMC - PubMed
    1. Mao T et al. A stem-loop RNA RIG-I agonist confers prophylactic and therapeutic protection against acute and chronic SARS-CoV-2 infection in mice. bioRxiv 2021.06.16.448754 (2021) doi:10.1101/2021.06.16.448754. - DOI
    1. Vogels CBF et al. Multiplex qPCR discriminates variants of concern to enhance global surveillance of SARS-CoV-2. PLoS Biol 19, e3001236 (2021). - PMC - PubMed
    1. Vogels CBF, Fauver JR & Grubaugh ND Multiplexed RT-qPCR to screen for SARS-COV-2 B.1.1.7, B.1.351, and P.1 variants of concern V.3 10.17504/protocols.io.br9vm966 (2021) doi:10.17504/protocols.io.br9vm966. - DOI - DOI

Publication types

MeSH terms

Supplementary concepts