. 2021 Oct 26;12(5):e0260821.
doi: 10.1128/mBio.02608-21. Epub 2021 Oct 12.

Efflux Impacts Intracellular Accumulation Only in Actively Growing Bacterial Cells

Affiliations

Efflux Impacts Intracellular Accumulation Only in Actively Growing Bacterial Cells

Emily E Whittle et al. mBio. .

Abstract

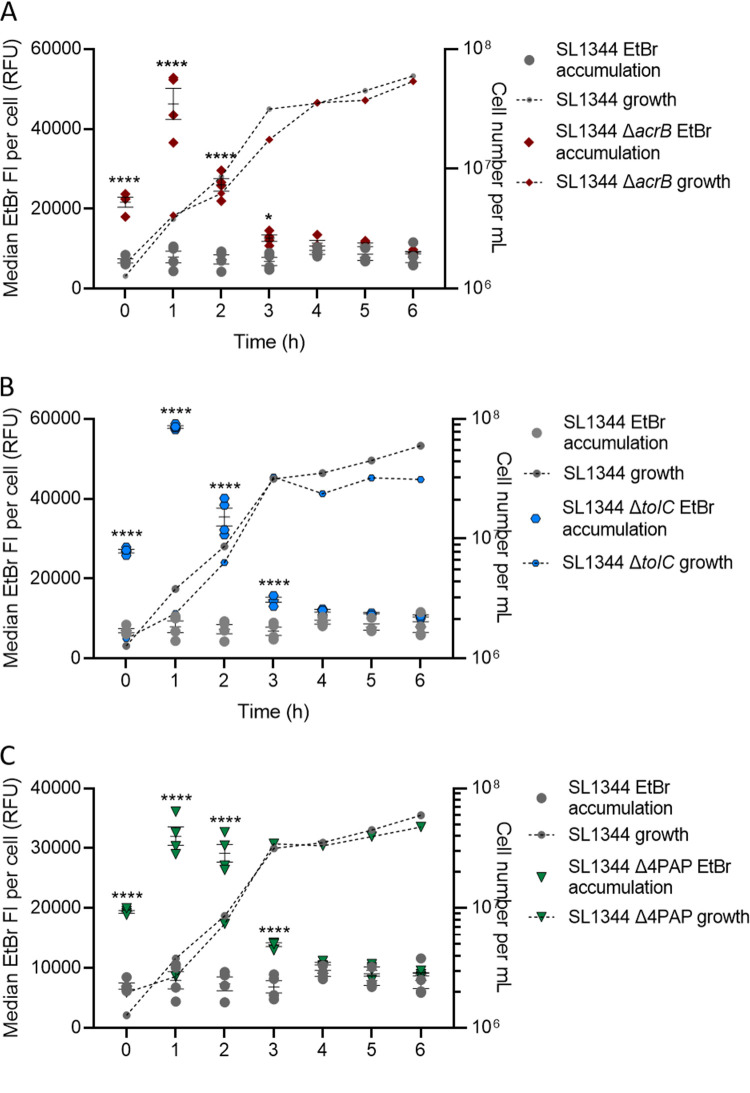
For antibiotics with intracellular targets, effective treatment of bacterial infections requires the drug to accumulate to a high concentration inside cells. Bacteria produce a complex cell envelope and possess drug export efflux pumps to limit drug accumulation inside cells. Decreasing cell envelope permeability and increasing efflux pump activity can reduce intracellular accumulation of antibiotics and are commonly seen in antibiotic-resistant strains. Here, we show that the balance between influx and efflux differs depending on bacterial growth phase in Gram-negative bacteria. Accumulation of the fluorescent compound ethidium bromide (EtBr) was measured in Salmonella enterica serovar Typhimurium SL1344 (wild type) and efflux deficient (ΔacrB) strains during growth. In SL1344, EtBr accumulation remained low, regardless of growth phase, and did not correlate with acrAB transcription. EtBr accumulation in the ΔacrB strains was high in exponential phase but dropped sharply later in growth, with no significant difference from that in SL1344 in stationary phase. Low EtBr accumulation in stationary phase was not due to the upregulation of other efflux pumps but instead was due to decreased permeability of the envelope in stationary phase. Transcriptome sequencing (RNA-seq) identified changes in expression of several pathways that remodel the envelope in stationary phase, leading to lower permeability. IMPORTANCE This study shows that efflux is important for maintaining low intracellular accumulation only in actively growing cells and that envelope permeability is the predominant factor in stationary-phase cells. This conclusion means that (i) antibiotics with intracellular targets may be less effective in complex infections with nongrowing or slow-growing bacteria, where intracellular accumulation may be low; (ii) efflux inhibitors may be successful in potentiating the activity of existing antibiotics, but potentially only for bacterial infections where cells are actively growing; and (iii) the remodeling of the cell envelope prior to stationary phase could provide novel drug targets.

Keywords: antibiotic resistance; efflux pumps; membrane permeability.


Figures

FIG 1
FIG 1
Ethidium bromide accumulation and acrAB expression in single cells of S. Typhimurium SL1344 across the growth phase. Cell number per milliliter was measured in each sample (black lines; numbers indicated on the right y axis). Pink bars indicate median ethidium bromide fluorescence per cell (relating to left red y axis), and dashed lines with green circles show acrAB expression (median GFP fluorescence per cell from the reporter; left green y axis). All data points are median values from measurements of 10,000 single cells of SL1344. Error bars indicate standard errors of the means (SEM).
FIG 2
FIG 2
(A) Time taken for ethidium bromide to be removed from SL1344 cells at 1, 3, and 5 h. Bars represent the time taken for ethidium bromide fluorescence to drop 10%, 25%, and 50% from its original value. Data are based on 3 biological replicates, with error bars showing SEM. Data at 1 h (black), 3 h (dark gray), and 5 h (light gray) are shown. There was no significant difference in the time taken to export EtBr at each time point. (B) GFP/OD600 from SL1344 AcrB-GFP over 16 h of growth in MOPS minimal medium. This graph shows GFP/OD600 from AcrB-GFP at the end of lag phase (300 min) until the last time point at 16 h. The dashed black line shows the OD600; the green line shows GFP fluorescence (error bars show SEM). SL1344 autofluorescence was subtracted from these data.
FIG 3
FIG 3
EtBr accumulation in SL1344 and SL1344 ΔacrB (A), ΔtolC (B), and Δ4PAP (C). For each strain, the median EtBr fluorescence per cell in 10,000 single cells was measured every hour between 0 and 6 h of growth for SL1344 (gray circles) and (A) SL1344 ΔacrB (red diamonds), (B) SL1344 ΔtolC (blue hexagons), and (C) SL1344 Δ4PAP (ΔacrA ΔacrE ΔmdsA ΔmdtA) (green triangles). Data from 4 biological replicates for each strain are shown; horizontal bars show means, and error bars show SEM. Median EtBr fluorescence per cell is plotted on the left y axis. Calculated cell numbers per milliliter are plotted on the right y axis with corresponding symbols equating to strain and a dashed line to show growth of the cultures. Cell numbers were based on the mean of the same biological replicates and the same gated population that EtBr fluorescence was measured from. Two-way analysis of variance (ANOVA) and Sidak’s multiple-comparison test were carried out for statistical analysis. At 0, 1, and 2 h, EtBr accumulation was significantly increased in ΔacrB with P values of <0.0001 (****). At 0, 1, 2, and 3 h, EtBr accumulation was significantly increased in SL1344 ΔtolC and SL1344 Δ4PAP, with P values of <0.0001.
FIG 4
FIG 4
SYTO 84 accumulation in SL1344 and SL1344 ΔacrB. Median SYTO 84 fluorescence per cell in 10,000 cells was measured every hour between 0 and 6 h. White circles (SL1344) and blue diamonds (ΔacrB) represent the X-median value of SYTO 84 fluorescence in 10,000 cells within a biological replicate. Four biological replicates for each strain are shown; error bars show SEM. Median SYTO 84 fluorescence is plotted on the left y axis. Calculated cell numbers per milliliter are plotted on the right y axis with corresponding symbols equating to strain and a dashed line to show growth of the culture. Cell numbers were based on the mean of the same biological replicates and the same gated population that EtBr fluorescence was measured from.
FIG 5
FIG 5
(A) EtBr accumulation in SL1344 treated with EDTA. Bars represent median EtBr fluorescence in 10,000 single cells of SL1344. EtBr accumulation was measured in the presence of increasing concentrations of EDTA (0, 1, 10, 100, 200, and 500 mM) from a culture grown for 1 h (black), 3 h (dark blue), and 5 h (light blue). Error bars show SEM from 3 biological replicates. Dashed lines above the bars with asterisks represent significance values based on a t test compared to the value when no EDTA was added. At 1 h, treatment with 200 and 500 mM significantly increased EtBr accumulation in SL1344 with P values of 0.0013 (**) and <0.0001 (****), respectively. At 3 h, treatment with 200 and 500 mM significantly increased EtBr accumulation in SL1344 with P values of 0.0033 (**) and 0.0001 (***), respectively. (B and C) EtBr accumulation in SL1344 ΔrpoS and SL1344 ΔacrB ΔrpoS. Four biological replicates for each strain are shown, with a short mean bar and error bars showing SEM. EtBr accumulation is plotted on the left y axis. Calculated cell numbers are plotted on the right y axis. Cell numbers were based on the mean of the same biological replicates and the same gated population that EtBr fluorescence was measured from. (B) SL1344 WT (individual black dots) versus ΔrpoS (blue dots). Median EtBr fluorescence per cell in 10,000 SYTO-84+ flow cytometry events was measured every hour between 0 and 6 h. Individual symbols represent the median value of EtBr fluorescence within a biological replicate. (C) SL1344 ΔacrB (black diamonds) versus SL1344 ΔacrB ΔrpoS (green diamonds). Median EtBr fluorescence per cell in 10,000 SYTO-84+ flow cytometry events was measured every hour between 0 and 6 h. Individual symbols represent the median value of EtBr fluorescence within a biological replicate. Significant differences to parent strain were measured by a two-way ANOVA and Sidak’s multiple-comparison test. At 3 h, EtBr accumulation in SL1344 ΔacrB ΔrpoS is significantly different from that in SL1344 ΔacrB with a P value of 0.0002 (***).
FIG 6
FIG 6
Model showing that the differentially expressed genes identified in the RNA-seq encode proteins involved in envelope remodeling in stationary phase to increase barrier function. Green text represents genes with increased expression, and red text represents genes with decreased expression.

References

    1. Nikaido H. 1989. Outer membrane barrier as a mechanism of antimicrobial resistance. Antimicrob Agents Chemother 33:1831–1836. doi:10.1128/AAC.33.11.1831. - DOI - PMC - PubMed
    1. Pratt LA, Hsing W, Gibson KE, Silhavy TJ. 1996. From acids to osmZ: multiple factors influence synthesis of the OmpF and OmpC porins in Escherichia coli. Mol Microbiol 20:911–917. doi:10.1111/j.1365-2958.1996.tb02532.x. - DOI - PubMed
    1. Dupont H, Choinier P, Roche D, Adiba S, Sookdeb M, Branger C, Denamur E, Mammeri H. 2017. Structural alteration of OmpR as a source of ertapenem resistance in a CTX-M-15-producing Escherichia coli O25b:H4 sequence type 131 clinical isolate. Antimicrob Agents Chemother 61:e00014-17. doi:10.1128/AAC.00014-17. - DOI - PMC - PubMed
    1. Dé E, Baslé A, Jaquinod M, Saint N, Malléa M, Molle G, Pagès JM. 2001. A new mechanism of antibiotic resistance in Enterobacteriaceae induced by a structural modification of the major porin. Mol Microbiol 41:189–198. doi:10.1046/j.1365-2958.2001.02501.x. - DOI - PubMed
    1. Bajaj H, Scorciapino MA, Moynie L, Page MGP, Naismith JH, Ceccarelli M, Winterhalter M. 2016. Molecular basis of filtering carbapenems by porins from βlactam-resistant clinical strains of Escherichia coli. J Biol Chem 291:2837–2847. doi:10.1074/jbc.M115.690156. - DOI - PMC - PubMed

Publication types

MeSH terms

LinkOut - more resources