. 2022 Jan 1:236:122841.
doi: 10.1016/j.talanta.2021.122841. Epub 2021 Sep 1.

SARS-CoV-2 detection with aptamer-functionalized gold nanoparticles

Affiliations

SARS-CoV-2 detection with aptamer-functionalized gold nanoparticles

Srivatsa Aithal et al. Talanta. .

Abstract

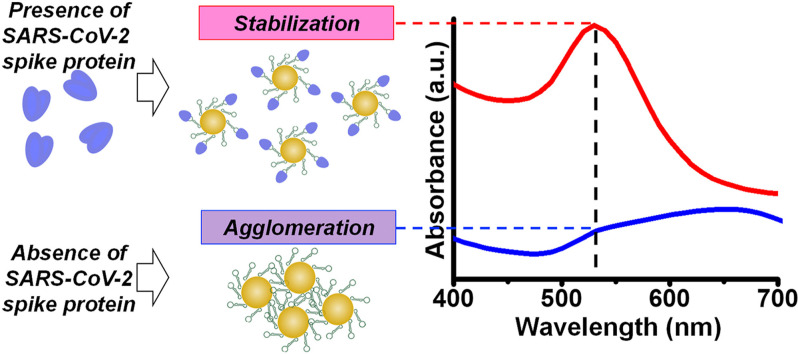
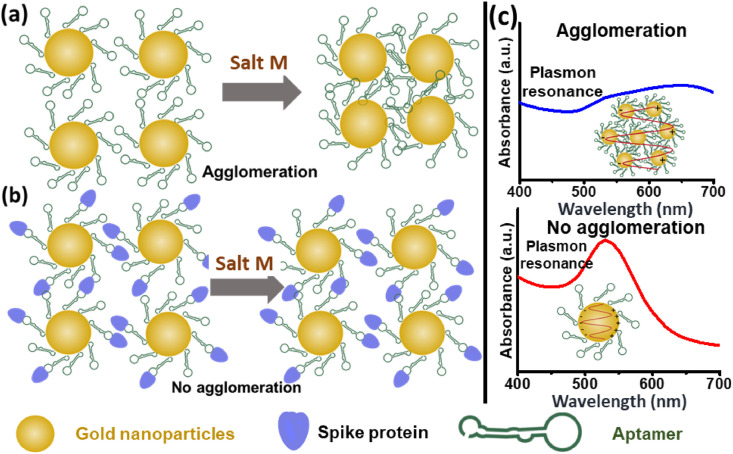
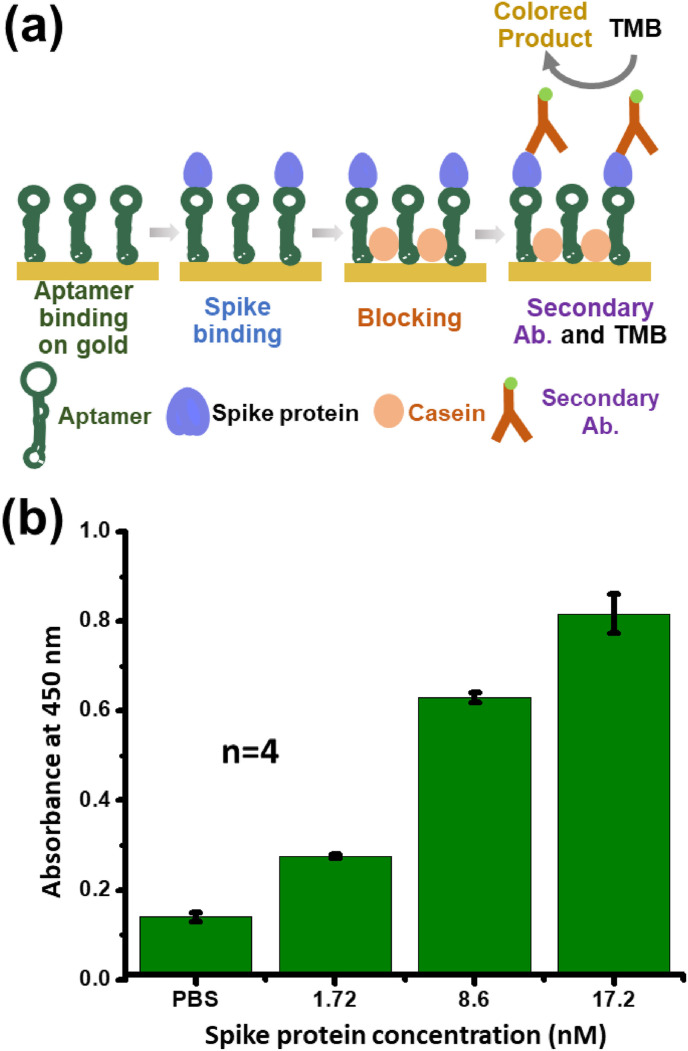
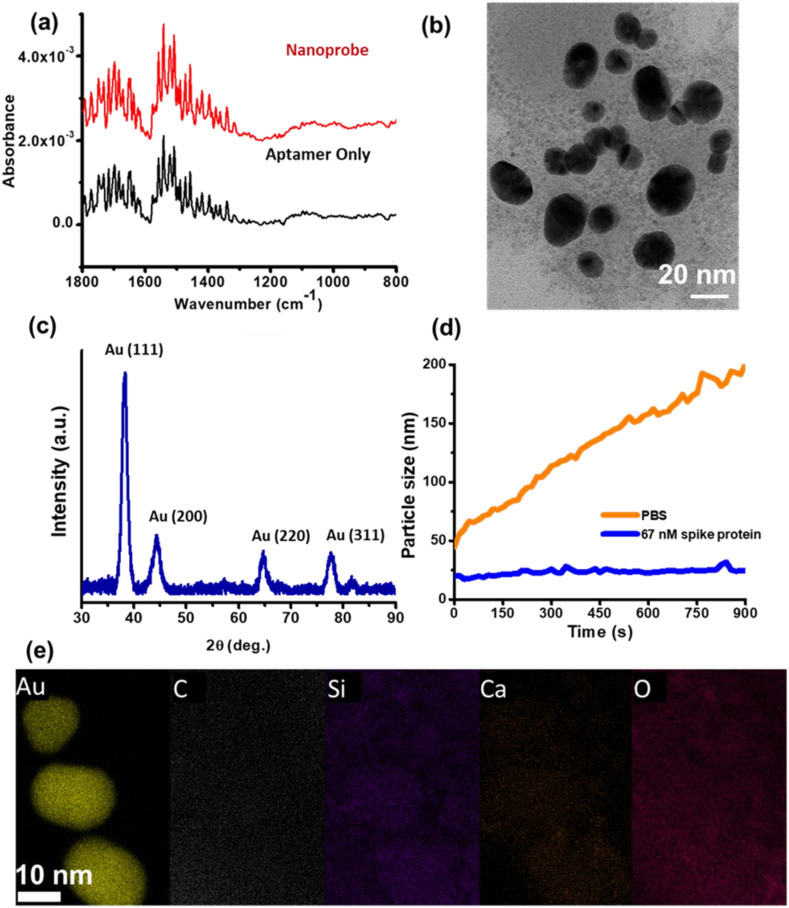
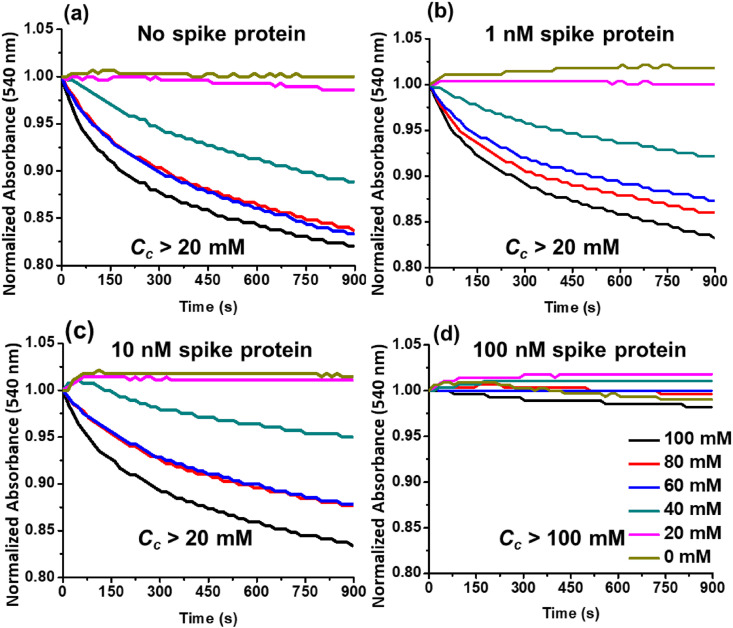
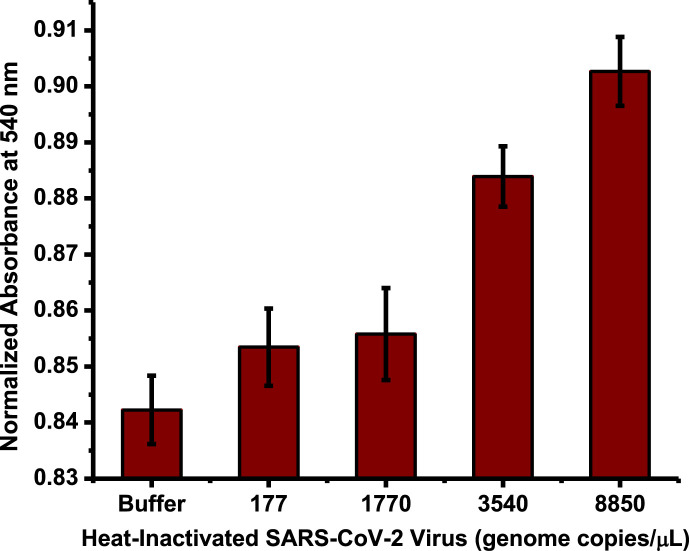
A rapid detection test for SARS-CoV-2 is urgently required to monitor virus spread and containment. Here, we describe a test that uses nanoprobes, which are gold nanoparticles functionalized with an aptamer specific to the spike membrane protein of SARS-CoV-2. An enzyme-linked immunosorbent assay confirms aptamer binding with the spike protein on gold surfaces. Protein recognition occurs by adding a coagulant, where nanoprobes with no bound protein agglomerate while those with sufficient bound protein do not. Using plasmon absorbance spectra, the nanoprobes detect 16 nM and higher concentrations of spike protein in phosphate-buffered saline. The time-varying light absorbance is examined at 540 nm to determine the critical coagulant concentration required to agglomerates the nanoprobes, which depends on the protein concentration. This approach detects 3540 genome copies/μl of inactivated SARS-CoV-2.

Keywords: Aptamer; Biosensing; Gold nanoparticle; SARS-CoV-2; Spike protein; Surface plasmon resonance.


Conflict of interest statement

The authors declare that they have no known competing financial interests or personal relationships that could have appeared to influence the work reported in this paper.

Figures

Image 1
Graphical abstract
Fig. 1
Fig. 1
Schematic illustrating the principle of the SARS-CoV-2 test. (a) Nanoprobes are AuNPs functionalized with aptamers in an aqueous suspension. When the SARS-CoV-2 spike protein is absent from the colloid, addition of the coagulant Salt M neutralizes surface charges on the nanoprobes, inducing their agglomeration. (b) Nanoprobes with spike protein bind with aptamers and resist agglomeration, which depends on the extent of this binding. Protein binding provides additional charge to the nanoparticle, enhancing steric stabilization. (c) Plasmon absorbance spectra for the nanoprobes show how agglomeration in a colloidal suspension broadens the absorbance spectrum and shifts peak absorbance to higher wavelengths. (For interpretation of the references to color in this figure legend, the reader is referred to the Web version of this article.)
Fig. 2
Fig. 2
Results of ELISA for aptamer and spike protein binding. (a) Schematic of the assay steps that indicate aptamer binding to the flat gold surface, spike protein binding to the aptamer, blocking with casein, secondary Ab binding to the spike protein with the monomeric Fc tag, and addition of the HRP chromogenic substrate (TMB). (b) Response of the colorimetric assay with spike protein diluted in PBS buffer, where a 1.72 nM spike protein concentration in PBS is clearly distinguishable from the background. Bars represent the standard error of the mean of four replicates. (For interpretation of the references to color in this figure legend, the reader is referred to the Web version of this article.)
Fig. 3
Fig. 3
Absorbance spectra for various concentrations of spike protein in PBS. The nanoprobe and sample mixtures are incubated for 30 min after which 100 mM of the coagulant Salt M is added. The mixture is then incubated for an additional 10 min. The absorbance spectrum broadens considerably for spike protein concentrations in PBS lower than 16 nM. (For interpretation of the references to color in this figure legend, the reader is referred to the Web version of this article.)
Fig. 4
Fig. 4
FTIR, TEM, XRD, and DLS characterization of the nanoprobes. (a) IR spectra measured using FTIR in the fingerprint region for aptamers. The spectral signature of aptamers and nanoprobes is identical, indicating that aptamers are present on the nanoprobes. (b) Representative TEM image of the nanoprobe, where the nanoparticle characteristic size, quantified by measuring the longest dimension of 10 non-overlapping particles is 18 ± 6 nm. (c) XRD measurements reveal four distinct peaks corresponding to standard Bragg reflections for a crystalline gold nanoparticle with the highest intensity peak at Au (111). (d) The nanoprobe suspensions are mixed with samples, one containing only PBS and the other with 67 nm of spike protein added to PBS. The two mixtures are incubated for 30 min after which 100 mM of Salt M is added and DLS measurements performed at 15 s intervals over 900 s. Nanoprobes bound to spike protein do not agglomerate while those in PBS alone steadily agglomerate, reaching a 190 nm size at 900 s. (e) EDX mapping of elemental gold (Au), carbon (C), silicon (Si), calcium (Ca), and oxygen (O) on the nanoprobes. (For interpretation of the references to color in this figure legend, the reader is referred to the Web version of this article.)
Fig. 5
Fig. 5
Nanoprobe agglomeration kinetics for different spike protein concentrations diluted in PBS. (a) 0 nM, (b) 1 nM, (c) 10 nM, and (d) 100 nM mixtures of spike protein in PBS are mixed with nanoprobe suspensions and incubated for 15 min, following which different concentrations of coagulant Salt M are introduced into the mixtures and their absorbance measured at 540 nm for 15 min. Increasing the spike concentration from 10 to 100 nM in PBS also increases Cc from a value greater than 20 mM to one greater than 100 mM. (For interpretation of the references to color in this figure legend, the reader is referred to the Web version of this article.)
Fig. 6
Fig. 6
The response of nanoprobe agglomeration to heat-inactivated SARS-CoV-2 in the buffer at t = 900 s after addition of coagulant Salt M. As the number of heat-inactivated SARS-CoV-2 genome copies increases, the agglomeration decreases. Although it is not possible to distinguish between PBS, 177, and 1770 genome copies/μL of the virus, higher concentrations of 3540 and 8850 genome copies/μL are distinguishable from the buffer. The error bars are the standard errors of the mean for six samples. (For interpretation of the references to color in this figure legend, the reader is referred to the Web version of this article.)

References

    1. Chau C.H., Strope J.D., Figg W.D. COVID‐19 clinical diagnostics and testing technology, pharmacother. J. Hum. Pharmacol. Drug Ther. 2020;40:857–868. doi: 10.1002/phar.2439. - DOI - PMC - PubMed
    1. Rabiee N., Bagherzadeh M., Ghasemi A., Zare H., Ahmadi S., Fatahi Y., Dinarvand R., Rabiee M., Ramakrishna S., Shokouhimehr M., Varma R.S. Point-of-Use rapid detection of SARS-CoV-2: nanotechnology-enabled solutions for the COVID-19 pandemic. Int. J. Mol. Sci. 2020;21:5126. doi: 10.3390/ijms21145126. - DOI - PMC - PubMed
    1. Kilic T., Weissleder R., Lee H. Molecular and immunological diagnostic tests of COVID-19: current status and challenges. IScience. 2020;23:101406. doi: 10.1016/j.isci.2020.101406. - DOI - PMC - PubMed
    1. Afzal A. Molecular diagnostic technologies for COVID-19: limitations and challenges. J. Adv. Res. 2020;26:149–159. doi: 10.1016/j.jare.2020.08.002. - DOI - PMC - PubMed
    1. Esbin M.N., Whitney O.N., Chong S., Maurer A., Darzacq X., Tjian R. Overcoming the bottleneck to widespread testing: a rapid review of nucleic acid testing approaches for COVID-19 detection. RNA. 2020;26:771–783. doi: 10.1261/rna.076232.120. - DOI - PMC - PubMed