. 2022 Jan;41(1):37-47.
doi: 10.1016/j.healun.2021.09.002. Epub 2021 Sep 13.

Cost-effectiveness and system-wide impact of using Hepatitis C-viremic donors for heart transplant

Affiliations

Cost-effectiveness and system-wide impact of using Hepatitis C-viremic donors for heart transplant

Brian Wayda et al. J Heart Lung Transplant. 2022 Jan.

Abstract

Background: The advent of direct-acting antiviral therapy for Hepatitis C (HCV) has made using HCV-viremic donors a viable strategy to address the donor shortage in heart transplantation. We employed a large-scale simulation to evaluate the impact and cost-effectiveness of using HCV-viremic donors for heart transplant.

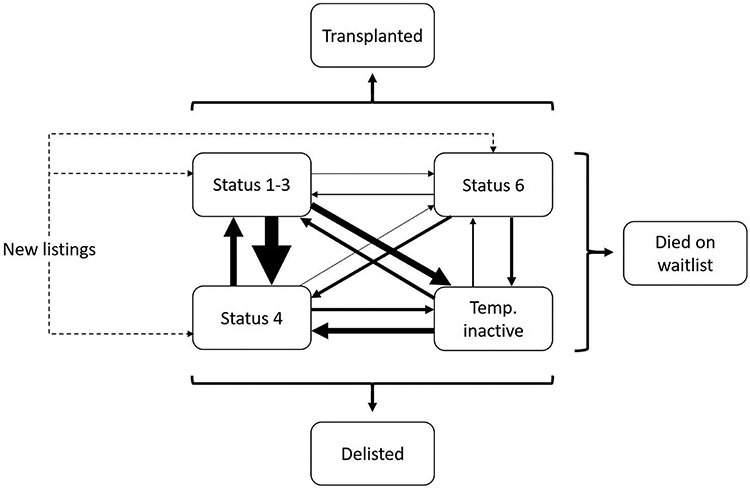
Methods: We simulated detailed histories from time of listing until death for the real-world cohort of all adults listed for heart transplant in the United States from July 2014 to June 2019 (n = 19,346). This population was imputed using historical data and captures "real-world" heterogeneity in geographic and clinical characteristics. We estimated the impact of an intervention in which all candidates accept HCV+ potential donors (n = 472) on transplant volume, waitlist outcomes, and lifetime costs and quality-adjusted life years (QALYs).

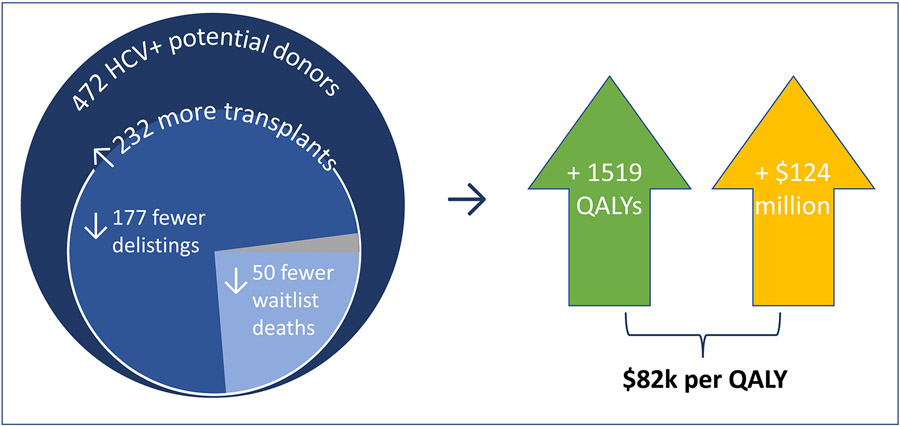
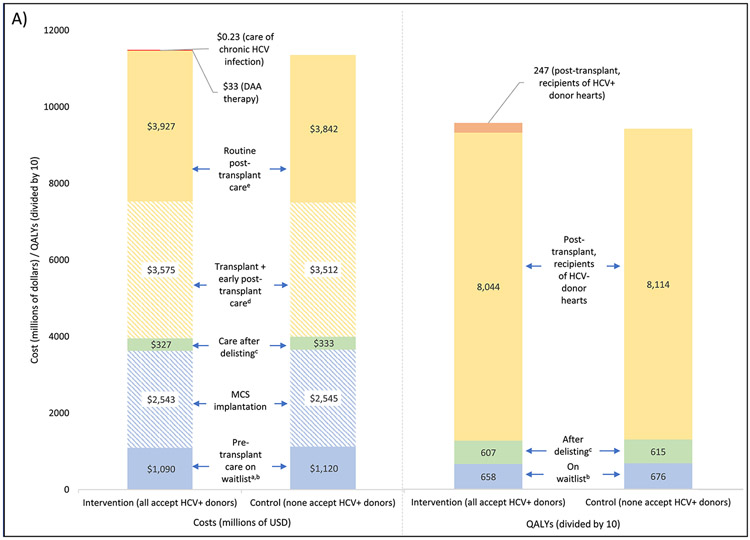
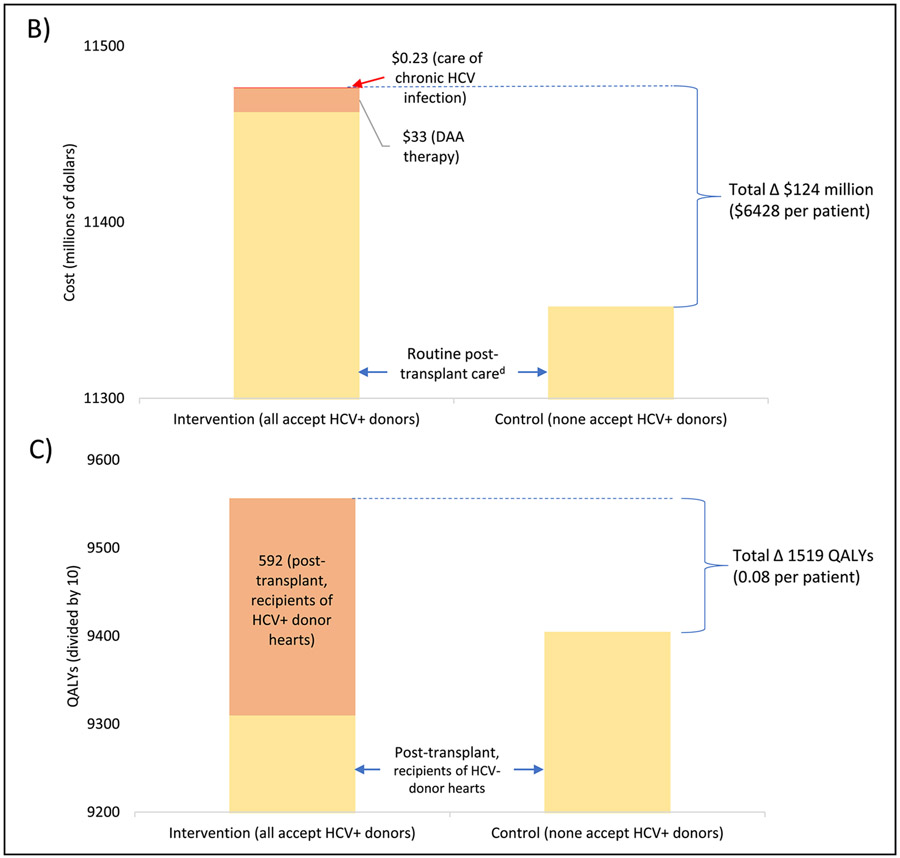
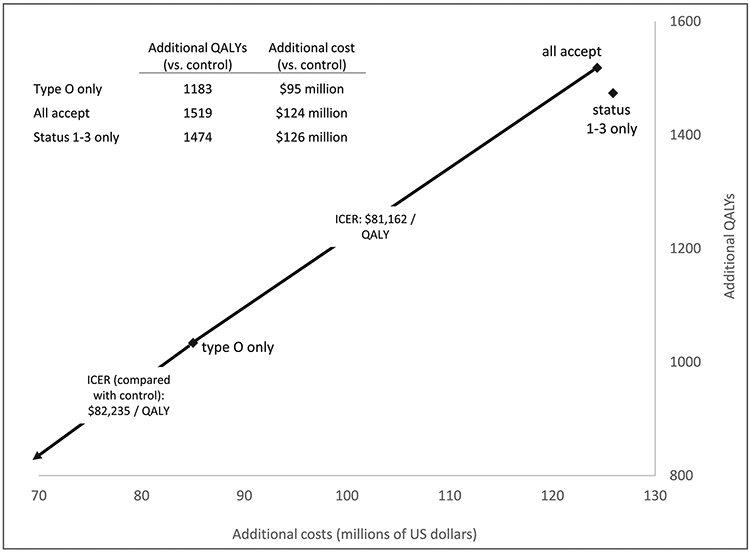
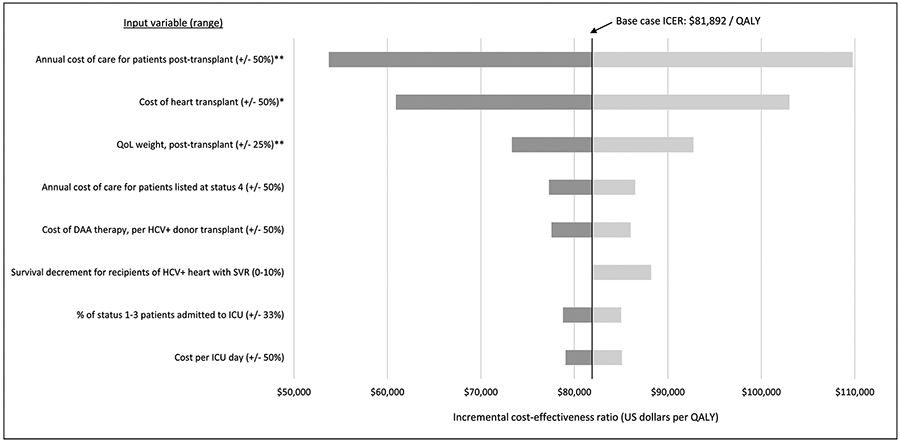
Results: The intervention produced 232 more transplants, 132 fewer delistings due to deterioration, and 50 fewer waitlist deaths within this 5-year cohort and reduced wait times by 3% to 11% (varying by priority status). The intervention was cost-effective, adding an average of 0.08 QALYs per patient at a cost of $124 million ($81,892 per QALY). DAA therapy and HCV care combined account for 11% this cost, with the remainder due to higher costs of transplant procedures and routine post-transplant care. The impact on transplant volume varied by blood type and region and was correlated with donor-to-candidate ratio (ρ = 0.71).

Conclusions: Transplanting HCV+ donor hearts is likely to be cost-effective and improve waitlist outcomes, particularly in regions and subgroups experiencing high donor scarcity.

Keywords: cost-effectiveness analysis; donor selection; health policy; heart transplantation; transplant allocation.


Conflict of interest statement

Disclosure statement Dr Teuteberg has relationships with Abbott (consulting), Abiomed (advisory board), Medtronic (speaking, advisory board), CareDx (speaking, advisory board), Paragonix (speaking). Other authors have no disclosures.

Figures

Figure 1.
Figure 1.. Model schematic showing simulated patient history from time of listing until death on waitlist, delisting, or transplant.
The caliber of solid lines connecting waitlist states (Status 1-3, Status 4, Status 6, and temporarily inactive) is proportional to the corresponding transition probabilities. Concurrently, patients in any waitlist state can transition to the terminal states “delisted” or “died on waitlist”, with probabilities varying by waitlist state. Transitions to "transplanted" are possible for all waitlist states except for “temporarily inactive”. The probability of transitioning to “transplanted” is endogenous to the model and will vary by waitlist state, by individual patient characteristics, and by the availability of acceptable donors (which in turn varies by intervention/policy scenario). Transition probabilities between states are detailed in Table S1.
Figure 2.
Figure 2.. Summary of outcomes in primary intervention (all patients accept HCV+ donors) compared to control (no patients accept HCV+ donors) scenarios.
Outcomes and costs include those accrued by all patients listed for transplant during a five-year period (July 2014 – June 2019). The shaded grey area represents five fewer patients remaining on the heart transplant waitlist at the end of the model’s time horizon (June 2024).
Figure 3.
Figure 3.. Distribution of total costs and quality-adjusted life years (QALYs) in intervention (all accept HCV+ donors) and control (none accept HCV+ donors) scenarios.
Costs are expressed in millions of US dollars and QALYs are expressed in tens of QALYs (to allow for a consistent axis for both charts). Cost and QALYs estimates are based on a cohort of patients listed for transplant between July 2014 and June 2019 and discounted at a rate of 3% per year (see Methods for details); both are tabulated from the date of listing until death. Complete costs/QALYs across all categories are shown in panel (A). A smaller segment of this chart is shown in panels (B) and (C) to better detail differences between the two scenarios. a excludes one-time cost of MCS implantation b includes patients who are temporarily delisted c refers to patients who are delisted without undergoing transplant d excludes cost of DAA therapy e excludes care associated with HCV infection and its sequelae DAA: direct acting antiviral; HCV: Hepatitis C; MCS: mechanical circulatory support; QALY: quality-adjusted life year
Figure 4.
Figure 4.. Cost-effectiveness frontier comparing the primary intervention (all accept HCV+ donors) and selected intermediate HCV+ donor acceptance strategies.
Intermediate strategies are those in which HCV+ donor acceptance is limited to a specific blood type (“Type O only”) or priority strata (“Status 1-3 only”) at listing. "Additional" costs and QALYs represent the difference between a selected intervention strategy and the control scenario (none accept HCV+ donors). Each scenario’s outcomes represent the average across ten model iterations. Overlaying the figure are incremental cost-effectiveness ratios (ICERs; calculated as difference in costs divided by difference in QALYs) comparing neighboring strategies on the cost-effectiveness frontier. On average, the “status 1-3 only” strategy is dominated by “all accept” (conferring fewer QALYs at higher total costs). However, the differences in both costs and QALYs between the “all accept” and “status 1-3 only” scenarios were not statistically significant (p > 0.05 in two sample t-test). HCV: Hepatitis C; ICER: incremental cost-effectiveness ratio; QALY: quality-adjusted life year
Figure 5.
Figure 5.. Tornado diagram of the results of sensitivity analyses.
For plausible ranges of each input variable (shown in parentheses), the range of ICER estimates for the primary intervention (all accept HCV+ donors) versus control scenario (none accept HCV+ donors) is shown. The chart includes all input variables for which the corresponding range in ICERs is greater than $5000 per QALY. * Includes the cost of early post-transplant care as detailed in Table S5 ** Applies to post-transplant patients without chronic HCV infection DAA: direct acting antiviral; HCV: Hepatitis C; ICER: incremental cost-effectiveness ratio; ICU: intensive care unit; QALY: quality-adjusted life year

Comment in

References

    1. Cowger JA Addressing the Growing U.S. Donor Heart Shortage: Waiting for Godot or a Transplant? J Am Coll Cardiol 69, 1715–1717 (2017). - PubMed
    1. Colvin M et al. OPTN/SRTR 2017 Annual Data Report: Heart. Am J Transplant 19 Suppl 2, 323–403 (2019). - PubMed
    1. Thomas SS & D’Alessandro DA Traumatic Brains and Broken Hearts: Mending the Donor Shortage in Cardiac Transplantation. J Am Coll Cardiol 70, 1259–1261 (2017). - PubMed
    1. Hsich EM Matching the Market for Heart Transplantation. Circ Heart Fail 9, e002679 (2016). - PMC - PubMed
    1. Asselah T, Marcellin P & Schinazi RF Treatment of hepatitis C virus infection with direct-acting antiviral agents: 100% cure? Liver Int. 38 Suppl 1, 7–13 (2018). - PMC - PubMed

Publication types

Substances