. 2021 Oct 11;12(10):928.
doi: 10.1038/s41419-021-04227-0.

Sitagliptin activates the p62-Keap1-Nrf2 signalling pathway to alleviate oxidative stress and excessive autophagy in severe acute pancreatitis-related acute lung injury

Affiliations

Sitagliptin activates the p62-Keap1-Nrf2 signalling pathway to alleviate oxidative stress and excessive autophagy in severe acute pancreatitis-related acute lung injury

Lingming Kong et al. Cell Death Dis. .

Abstract

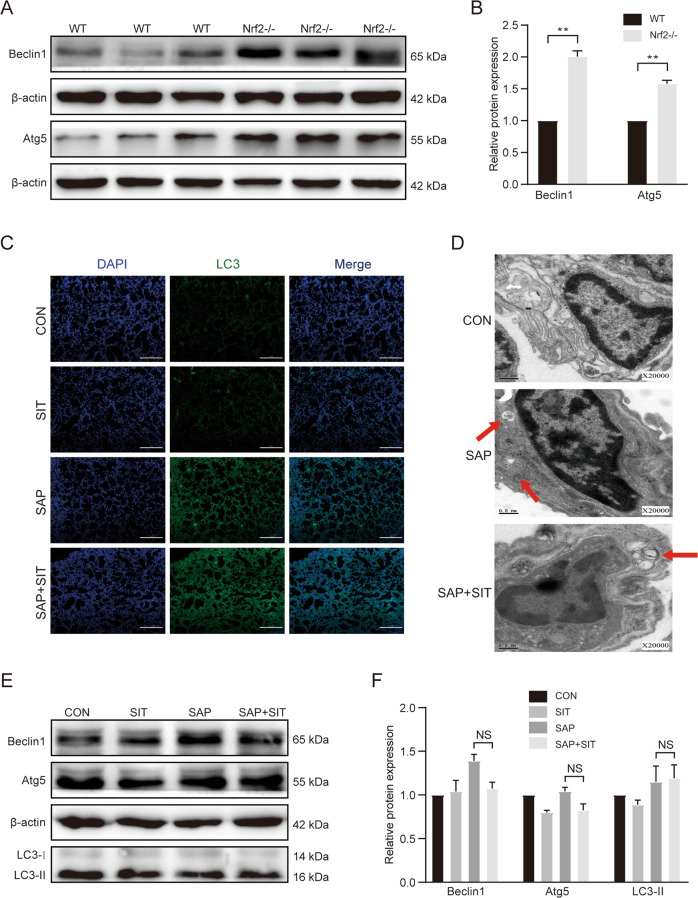
Acute lung injury (ALI) is a complication of severe acute pancreatitis (SAP). Sitagliptin (SIT) is a DPP4 inhibitor that exerts anti-inflammatory and antioxidant effects; however, its mechanism of action in SAP-ALI remains unclear. In this study, we investigated the effects of SIT on SAP-ALI and the specific pathways involved in SAP-induced lung inflammation, including oxidative stress, autophagy, and p62-Kelch-like ECH-associated protein 1 (Keap1)-NF-E2-related factor 2 (Nrf2) signalling pathways. Nrf2 knockout (Nrf2-/-) and wild-type (WT) mice were pre-treated with SIT (100 mg/kg), followed by caerulein and lipopolysaccharide (LPS) administration to induce pancreatic and lung injury. BEAS-2B cells were transfected with siRNA-Nrf2 and treated with LPS, and the changes in inflammation, reactive oxygen species (ROS) levels, and autophagy were measured. SIT reduced histological damage, oedema, and myeloperoxidase activity in the lung, decreased the expression of pro-inflammatory cytokines, and inhibited excessive autophagy and ROS production via the activation of the p62-Keap1-Nrf2 signalling pathway and promotion of the nuclear translocation of Nrf2. In Nrf2-knockout mice, the anti-inflammatory effect of SIT was reduced, resulting in ROS accumulation and excessive autophagy. In BEAS-2B cells, LPS induced ROS production and activated autophagy, further enhanced by Nrf2 knockdown. This study demonstrates that SIT reduces SAP-ALI-associated oxidative stress and excessive autophagy through the p62-Keap1-Nrf2 signalling pathway and nuclear translocation of Nrf2, suggesting its therapeutic potential in SAP-ALI.


Conflict of interest statement

The authors declare no competing interests.

Figures

Fig. 1
Fig. 1. Sitagliptin inhibited SAP and SAP-ALI in mice.
A, B Representative H&E staining iamge of the pancreas and lung tissue (×200). C Immunohistochemical staining of MPO revealed inflammation in the lung (×200). D The pancreatitis score. E The lung injury score. Slides were evaluated by two independent investigators in a blinded manner. F the quantification of MPO Immunohistochemical staining using the following formula: AOD = IOD/area. G–I Real-time PCR results of IL-6,TNF-α and IL-1β in different groups. J The lung W/D ratio. *P < 0.01 and **P < 0.05. Data are presented as mean ± standard error of the mean (SEM) (n = 6).
Fig. 2
Fig. 2. Sitagliptin downregulated autophagy level in SAP-ALI.
A Immunofluorescence staining for LC3-II in the lung (×200). B The representative TEM photo of the lung tissue. Red arrows: autophagic vacuoles (AVs). C, D Western blotting results and analysis of Beclin1, Atg5, and LC3-ll in different groups. Beclin1 and Atg5 versus β-actin, LC3-II versus LC3-I. **P < 0.05. Data are presented as mean ± standard error of the mean (SEM) (n = 6).
Fig. 3
Fig. 3. Sitagliptin reduced ROS levels and activated the p62–Keap1–Nrf2 signalling pathway.
A, B In WT mice, immunohistochemical staining and quantification of 4-HNE revealed ROS in the lung. Quantification using the following formula: AOD = IOD/area. C, D Western blotting results and analysis of p62, Keap1, Nrf2, Ho-1, and NQO1 in different groups. E, F Western blotting results and analysis of Nrf2 in nucleus and cytosol. G, H Western blotting results and analysis of DPP4, Keap1, Ho-1, and NQO1 in the CON group of WT mice and Nrf2−/− mice. I, J After Nrf2 deficiency, the immunohistochemical staining and quantification of 4-HNE in Nrf2−/− mice. Quantification using the following formula: AOD = IOD/area. **P < 0.05. Data are presented as mean ± standard error of the mean (SEM) (n = 6).
Fig. 4
Fig. 4. The protective effect of sitagliptin was significantly reduced in Nrf2−/− mice.
A, B Representative H&E staining iamge of the pancreas and lung tissue (×200). C Immunohistochemical staining of MPO revealed inflammation in the lung (×200). D The pancreatitis score. E The lung injury score. Slides were evaluated by two independent investigators in a blinded manner. F The quantification of MPO Immunohistochemical staining using the following formula: AOD = IOD/area. G–I Real-time PCR results of IL-6,TNF-α, and IL-1β in different groups. J The lung W/D ratio. **P < 0.05 versus the CON group. Data are presented as mean ± standard error of the mean (SEM) (n = 6).
Fig. 5
Fig. 5. Knocking out Nrf2 partially abolished the inhibition of autophagy of Sitagliptin on mice.
A, B Western blotting results and analysis of Beclin1 and Atg5 in the CON group of WT mice and Nrf2−/− mice. C Immunofluorescence staining for LC3-II in the lung (×200). D The representative TEM photo of the lung tissue. Red arrows: autophagic vacuoles (AVs). E, F Western blotting results and analysis of Beclin1, Atg5, and LC3-II in different groups. Beclin1 and Atg5 versus β-actin, LC3-II versus LC3-I. **P < 0.05 versus the WT mice. Data are presented as mean ± standard error of the mean (SEM) (n = 6).
Fig. 6
Fig. 6. Knockdown of Nrf2 enhanced autophagy level in BEAS-2B cells.
A qRT‐PCR results of Nrf2 expression in siRNA‐transduced cells. After 48 h transduction with siRNA, the cells were subjected to qRT‐PCR. B, C The levels of ROS were determined by flow cytometric analysis. D–F qRT-PCR results of IL-6, IL-1β, and TNF-α in different groups. G–J Western blotting results and analysis of Beclin1, Atg5, and LC3-II in different groups. Beclin1 and Atg5 versus β-actin, LC3-II versus LC3-I. *P < 0.01 and **P < 0.05. Data are presented as mean ± standard error of the mean (SEM) (n = 3).

References

    1. Lankisch P, Apte M, Banks P. Acute pancreatitis. Lancet. 2015;386:85–96. doi: 10.1016/S0140-6736(14)60649-8. - DOI - PubMed
    1. Petrov M, Yadav D. Global epidemiology and holistic prevention of pancreatitis. Nat Rev Gastroenterol Hepatol. 2019;16:175–84. doi: 10.1038/s41575-018-0087-5. - DOI - PMC - PubMed
    1. Lee P, Papachristou G. New insights into acute pancreatitis. Nat Rev Gastroenterol Hepatol. 2019;16:479–96. doi: 10.1038/s41575-019-0158-2. - DOI - PubMed
    1. Hines O, Pandol S. Management of severe acute pancreatitis. BMJ. 2019;367:l6227. doi: 10.1136/bmj.l6227. - DOI - PubMed
    1. Garg P, Singh V. Organ failure due to systemic injury in acute pancreatitis. Gastroenterology. 2019;156:2008–23. doi: 10.1053/j.gastro.2018.12.041. - DOI - PMC - PubMed

Publication types

MeSH terms