. 2021 Oct 11;12(1):5930.
doi: 10.1038/s41467-021-26156-4.

Homeostatic membrane tension constrains cancer cell dissemination by counteracting BAR protein assembly

Affiliations

Homeostatic membrane tension constrains cancer cell dissemination by counteracting BAR protein assembly

Kazuya Tsujita et al. Nat Commun. .

Abstract

Malignancy is associated with changes in cell mechanics that contribute to extensive cell deformation required for metastatic dissemination. We hypothesized that the cell-intrinsic physical factors that maintain epithelial cell mechanics could function as tumor suppressors. Here we show, using optical tweezers, genetic interference, mechanical perturbations, and in vivo studies, that epithelial cells maintain higher plasma membrane (PM) tension than their metastatic counterparts and that high PM tension potently inhibits cancer cell migration and invasion by counteracting membrane curvature sensing/generating BAR family proteins. This tensional homeostasis is achieved by membrane-to-cortex attachment (MCA) regulated by ERM proteins, whose disruption spontaneously transforms epithelial cells into a mesenchymal migratory phenotype powered by BAR proteins. Consistently, the forced expression of epithelial-mesenchymal transition (EMT)-inducing transcription factors results in decreased PM tension. In metastatic cells, increasing PM tension by manipulating MCA is sufficient to suppress both mesenchymal and amoeboid 3D migration, tumor invasion, and metastasis by compromising membrane-mediated mechanosignaling by BAR proteins, thereby uncovering a previously undescribed mechanical tumor suppressor mechanism.


Conflict of interest statement

The authors declare no competing interests.

Figures
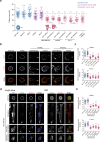
Fig. 1
Fig. 1. Plasma membrane (PM) tension is higher in non-invasive cells than in their metastatic counterparts.
a Scatter plot comparing the tether force of the indicated cells. n = 35 (MCF10A), n = 24 (MDCK II), n = 31 (IAR-2), n = 23 (AU565), n = 23 (MCF7), n = 24 (MDA-MB-231 with ruffling), n = 14 (MDA-MB-231 with blebbing), n = 21 (Hs578T with ruffling), n = 13 (Hs578T with blebbing), n = 19 (PC-3 with ruffling), n = 14 (PC-3 with blebbing), n = 24 (PANC-1) cells pooled from three independent experiments. Mean ± SD. b Confocal images of the indicated cells stained with anti-phosphorylated ERM (pERM) antibodies and phalloidin. Yellow and magenta arrowheads indicate actin- and bleb-based protrusions, respectively. See also Supplementary Fig. 1e. c Quantification of (b). Membrane/cytoplasm intensity ratio of pERM and F-actin of n = 30 (MCF10A), n = 26 (Au565), n = 24 (MDA-MB-231 with ruffling), n = 20 (MDA-MB-231 with blebbing), n = 22 (Hs578T with ruffling), and n = 18 (Hs578T with blebbing) cells pooled from three independent experiments. Mean ± SD. **P = 0.0073; ***P = 0.0014. d Left, confocal images of MCF10A or MDA-MB-231 cells stained with anti-pERM antibodies, phalloidin, and wheat germ agglutinin (WGA) in a 3D collagen matrix (3D). Plasma membrane (PM) was labeled with WGA. Right, maximum intensity projections (MIP) of their confocal stacks. Yellow and magenta arrowheads indicate actin- and bleb-based protrusions, respectively. e Quantification of (d) and Supplementary Fig. 1g. Membrane/cytoplasm intensity ratio of pERM and F-actin of n = 24 (MCF10A), n = 16 (AU565), n = 15 (MDA-MB-231, elongated), n = 12 (MDA-MB-231, rounded with actin-based protrusion), n = 17 (MDA-MB-231, rounded with blebs), and n = 17 (Hs578T) cells pooled from three independent experiments. Mean ± SD. Significance tested using one-way ANOVA with Tukey’s multiple comparisons test (a) and the two-tailed Mann–Whitney test (c, e). n.s. not significant; ****P < 0.0001. All scale bars, 10 µm.
Fig. 2
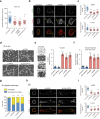
Fig. 2. Decreased PM tension transforms epithelial cells into a mesenchymal migratory phenotype in both 2D and 3D environments.
a Scatter plots comparing the estimated PM tension of MCF10A cells treated with the indicated RNAi. n = 60 (si-Control), n = 40 (si-RHOA), n = 28 (si-ERM), and n = 25 (si-SLK+STK10) cells pooled from three independent experiments. Mean ± SD. b Confocal images of MCF10A cells treated with the indicated RNAi, stained with anti-pERM antibodies and phalloidin. Yellow arrowheads indicate actin-based protrusions. Scale bars, 10 µm. c Quantification of (b). Membrane/cytoplasm intensity ratio of pERM and F-actin of n = 29 (si-Control), n = 26 (si-RHOA), n = 19 (si-ERM), and n = 28 (si-SLK+STK10) cells pooled from three independent experiments. Mean ± SD. d Phase-contrast images of MCF10A cells treated with the indicated RNAi grown in 3D on-top culture. Images are representative of three independent experiments with similar results. Scale bar, 20 µm. e Images (left) of siRNA-treated MCF10A cells that invaded through Matrigel and their quantified results (right). n = 9 fields from three independent experiments. Mean ± SD. *P = 0.0471. f Quantification of siRNA-treated MCF10A cells migrated through 8 µm pores. n = 9 fields from three independent experiments. Mean ± SD. **P = 0.0011. g Quantification of 3D migration phenotypes of n = 155 (si-Control), n = 126 (si-RHOA), n = 128 (si-ERM), and n = 123 (si-SLK + STK10) cells from three independent experiments. See also Supplementary Fig. 2g and Supplementary Movie 3. h Confocal images of the indicated RNAi-treated MCF10A cells stained with anti-pERM antibodies and phalloidin in 3D. Yellow arrowheads indicate actin-based protrusions. Scale bars, 10 µm. i Quantification of (h). Membrane/cytoplasm intensity ratio of pERM and F-actin of n = 20 (si-Control), n = 14 (si-RHOA), n = 15 (si-ERM), and n = 18 (si-SLK + STK10) cells pooled from three independent experiments. Mean ± SD. Significance tested using the two-tailed Mann–Whitney test (a, c, i), two-tailed Student’s t-test (e, f), and chi-square test (g). ****P < 0.0001.
Fig. 3
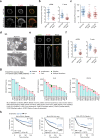
Fig. 3. Correlation between decreased PM tension and malignant progression.
a Confocal images of MCF10A or Snail-expressing cells stained with anti-pERM antibodies and phalloidin. The yellow arrowhead indicates actin-based protrusion. Scale bars, 10 µm. b Quantification of (a). Membrane/cytoplasm intensity ratio of pERM and F-actin of n = 23 (MCF10A) and n = 25 (Snail-expressing cells) cells pooled from three independent experiments. Mean ± SD. c Scatter plots comparing the estimated PM tension of the indicated cells. n = 38 (MCF10A), n = 33 (Snail-expressing cells), and n = 36 (Slug-expressing cells) cells pooled from three independent experiments. Mean ± SD. d Phase-contrast images of MCF10A cells or Snail-expressing cells in a 3D collagen matrix. Images are representative of three independent experiments with similar results. Scale bar, 20 µm. e Confocal images of MCF10A or Snail-expressing cells stained with anti-pERM antibodies and phalloidin in 3D. The yellow arrowhead indicates actin-based protrusion. Scale bars, 10 µm. f Quantification of (e). The membrane/cytoplasm intensity ratio of pERM and F-actin of n = 21 (MCF10A) and n = 21 (Snail-expressing cells) cells pooled from three independent experiments. Mean ± SD. g Genetic alterations of RHOA, SLK, and STK10 across 14 carcinoma types in The Cancer Genome Atlas (TCGA) data (6586 samples). h Kaplan–Meier plots showing the overall survival of breast, lung, and gastric cancer patients, which were stratified according to the mRNA expression of SLK+STK10. Significance tested using the two-tailed Mann–Whitney test (b, c, f) and two-tailed log-rank test (h). ****P < 0.0001.
Fig. 4
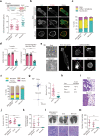
Fig. 4. Increasing PM tension is sufficient for the suppression of 3D migration and metastasis.
a Upper, schematic outline of membrane-anchoring active ezrin. Lower, scatter plots comparing the estimated PM tension of the indicated cells. n = 26 (parental), n = 29 (ezrin), and n = 31 (MA-ezrin) cells pooled from three independent experiments. b Confocal images of the indicated cells stained with anti-HA antibodies and phalloidin. Scale bars, 10 µm. c Quantification of the protrusions of n = 207 (Parental), n = 224 (ezrin), and n = 214 (MA-ezrin) cells from three independent experiments. d Quantification of the migration or invasion rates of the indicated cells. n = 9 fields from three independent experiments. e Phase-contrast images (left) or maximum intensity projections (right; stained with phalloidin and WGA [blebbing cell]) of the indicated cells in 3D. Scale bars, 20 µm (left) and 10 µm (right). f Quantification of the 3D migration phenotypes of n = 176 (Parental), n = 187 (ezrin), and n = 175 (MA-ezrin) cells from three independent experiments. g Trajectories of cell centroids of the indicated cells tracked in (f) for 8 h. Right, the average speed of one cell over the course of 8 h. n = 34 (ezrin) and n = 44 (MA-ezrin) cells pooled from three independent experiments. h Tumor formation after injection of the indicated cells into the mammary fat pad. i Representative hematoxylin and eosin (H&E)-stained sections of the primary tumor and surrounding tissue of mice injected with the indicated cells. Scale bar, 50 µm. j Quantification of (i). Tumor invasive area in dashed boxes located at the tumor rim was quantified. n = 9 areas for three tumors per group. k Quantification of spontaneous lung metastasis by quantitative PCR. n = 6 mice (parental), n = 3 (ezrin), and n = 6 mice (MA-ezrin). **P = 0.0152; ***P = 0.0119. l Whole images of the lungs and H&E staining of lung sections (bottom) after tail vein injection of the indicated cells. Scale bars, 250 µm. m Quantification of (l). n = 8 mice per group. ***P = 0.0002. In (b) and (e), yellow and magenta arrowheads indicate actin- and bleb-based protrusions, respectively. All data were expressed as mean ± SD. Significance tested using the two-tailed Mann–Whitney test (a, g, j, k, m), two-tailed Student’s t-test (d), and chi-square test (c, f). n.s. not significant; ****P < 0.0001.
Fig. 5
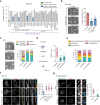
Fig. 5. Homeostatic PM tension suppresses cancer cell migration by counteracting BAR proteins.
a Fraction of MCF10A spheroids with invasive structures grown in 3D on-top culture treated with the indicated RNAi. Control siRNA alone and siRNAs targeting BAR proteins that reduce invasive structures induced by ERM deletion are shown in green and blue, respectively. Data are mean of two independent experiments with at least 50 cells per experiment. b Left, representative images of the indicated cells in 3D on-top culture. Right, fraction of the invasive structures of the indicated cells. Data are mean ± SD of three independent experiments with at least 200 cells per experiment. Scale bar, 20 µm. **P = 0.002; ***P = 0.0007. c Phase-contrast images of MDA-MB-231 cells treated with the indicated RNAi in 3D. Scale bar, 20 µm. Right, quantification of 3D migration phenotypes of n = 153 (si-Control), n = 150 (si-MTSS1L), and n = 155 (si-Toca proteins) cells from three independent experiments. d Trajectories of cell centroids of the indicated cells tracked in c for 8 h. Right, the average speed of one cell over the course of 8 h. n = 35 (si-Control), n = 43 (si-MTSS1L), and n = 46 (si-Toca proteins) cells pooled from three independent experiments. Mean ± SD. e Quantification of protrusions of the indicated cells in 3D. n = 151 (si-Control), n = 132 (si-MTSS1L), and n = 138 (si-Toca proteins) from three independent experiments (see also Supplementary Fig. 5e). f Confocal images of the indicated cells expressing GFP-FBP17 stained with phalloidin and WGA. Yellow arrowheads indicate GFP-FBP17 spots at the PM. Scale bars, 10 µm. Right, quantification of GFP-FBP17 puncta of n = 26 (si-Control), n = 22 (si-ERM), n = 22 (si-SLK+STK10), and n = 22 (Snail-expressing cells) cells pooled from three independent experiments. g Confocal images of the indicated cells stained with phalloidin and WGA in 3D. Yellow and magenta arrowheads indicate FBP17 accumulation at actin- and bleb-based protrusions, respectively. Scale bars, 10 µm. Right, quantification of GFP-FBP17 puncta of n = 20 (ezrin) and n = 20 (MA-ezrin) cells pooled from three independent experiments. All data, except for a, were expressed as mean ± SD. Significance tested using the two-tailed Student’s t-test (b, f, g), two-tailed Mann–Whitney test (d), and chi-square test (c, e). ****P < 0.0001.
Fig. 6
Fig. 6. Proposed model describing how homeostatic PM tension acts as the mechanical suppressor of cancer cell dissemination.
a Proposed model to describe how cancer progression is linked to the disruption of homeostatic PM tension, leading to cancer cell dissemination via BAR proteins. b Homeostatic PM tension sustained by membrane-to-cortex attachment (MCA) can maintain a non-motile state by suppressing the assembly of BAR proteins, key regulators of both actin- and bleb-based protrusions.

Similar articles

Cited by

References

    1. Lambert AW, Pattabiraman DR, Weinberg RA. Emerging biological principles of metastasis. Cell. 2017;168:670–691. doi: 10.1016/j.cell.2016.11.037. - DOI - PMC - PubMed
    1. Zeidman I. The fate of circulating tumors cells. I. Passage of cells through capillaries. Cancer Res. 1961;21:38–39. - PubMed
    1. Suresh S. Biomechanics and biophysics of cancer cells. Acta Biomater. 2007;3:413–438. doi: 10.1016/j.actbio.2007.04.002. - DOI - PMC - PubMed
    1. Wirtz D, Konstantopoulos K, Searson PC. The physics of cancer: the role of physical interactions and mechanical forces in metastasis. Nat. Rev. Cancer. 2011;11:512–522. doi: 10.1038/nrc3080. - DOI - PMC - PubMed
    1. Alibert C, Goud B, Manneville JB. Are cancer cells really softer than normal cells? Biol. Cell. 2017;109:167–189. doi: 10.1111/boc.201600078. - DOI - PubMed

Publication types

MeSH terms