. 2021 Dec;53(12):1649-1663.
doi: 10.1038/s41588-021-00946-4. Epub 2021 Oct 11.

Renal plasticity revealed through reversal of polycystic kidney disease in mice

Affiliations

Renal plasticity revealed through reversal of polycystic kidney disease in mice

Ke Dong et al. Nat Genet. 2021 Dec.

Abstract

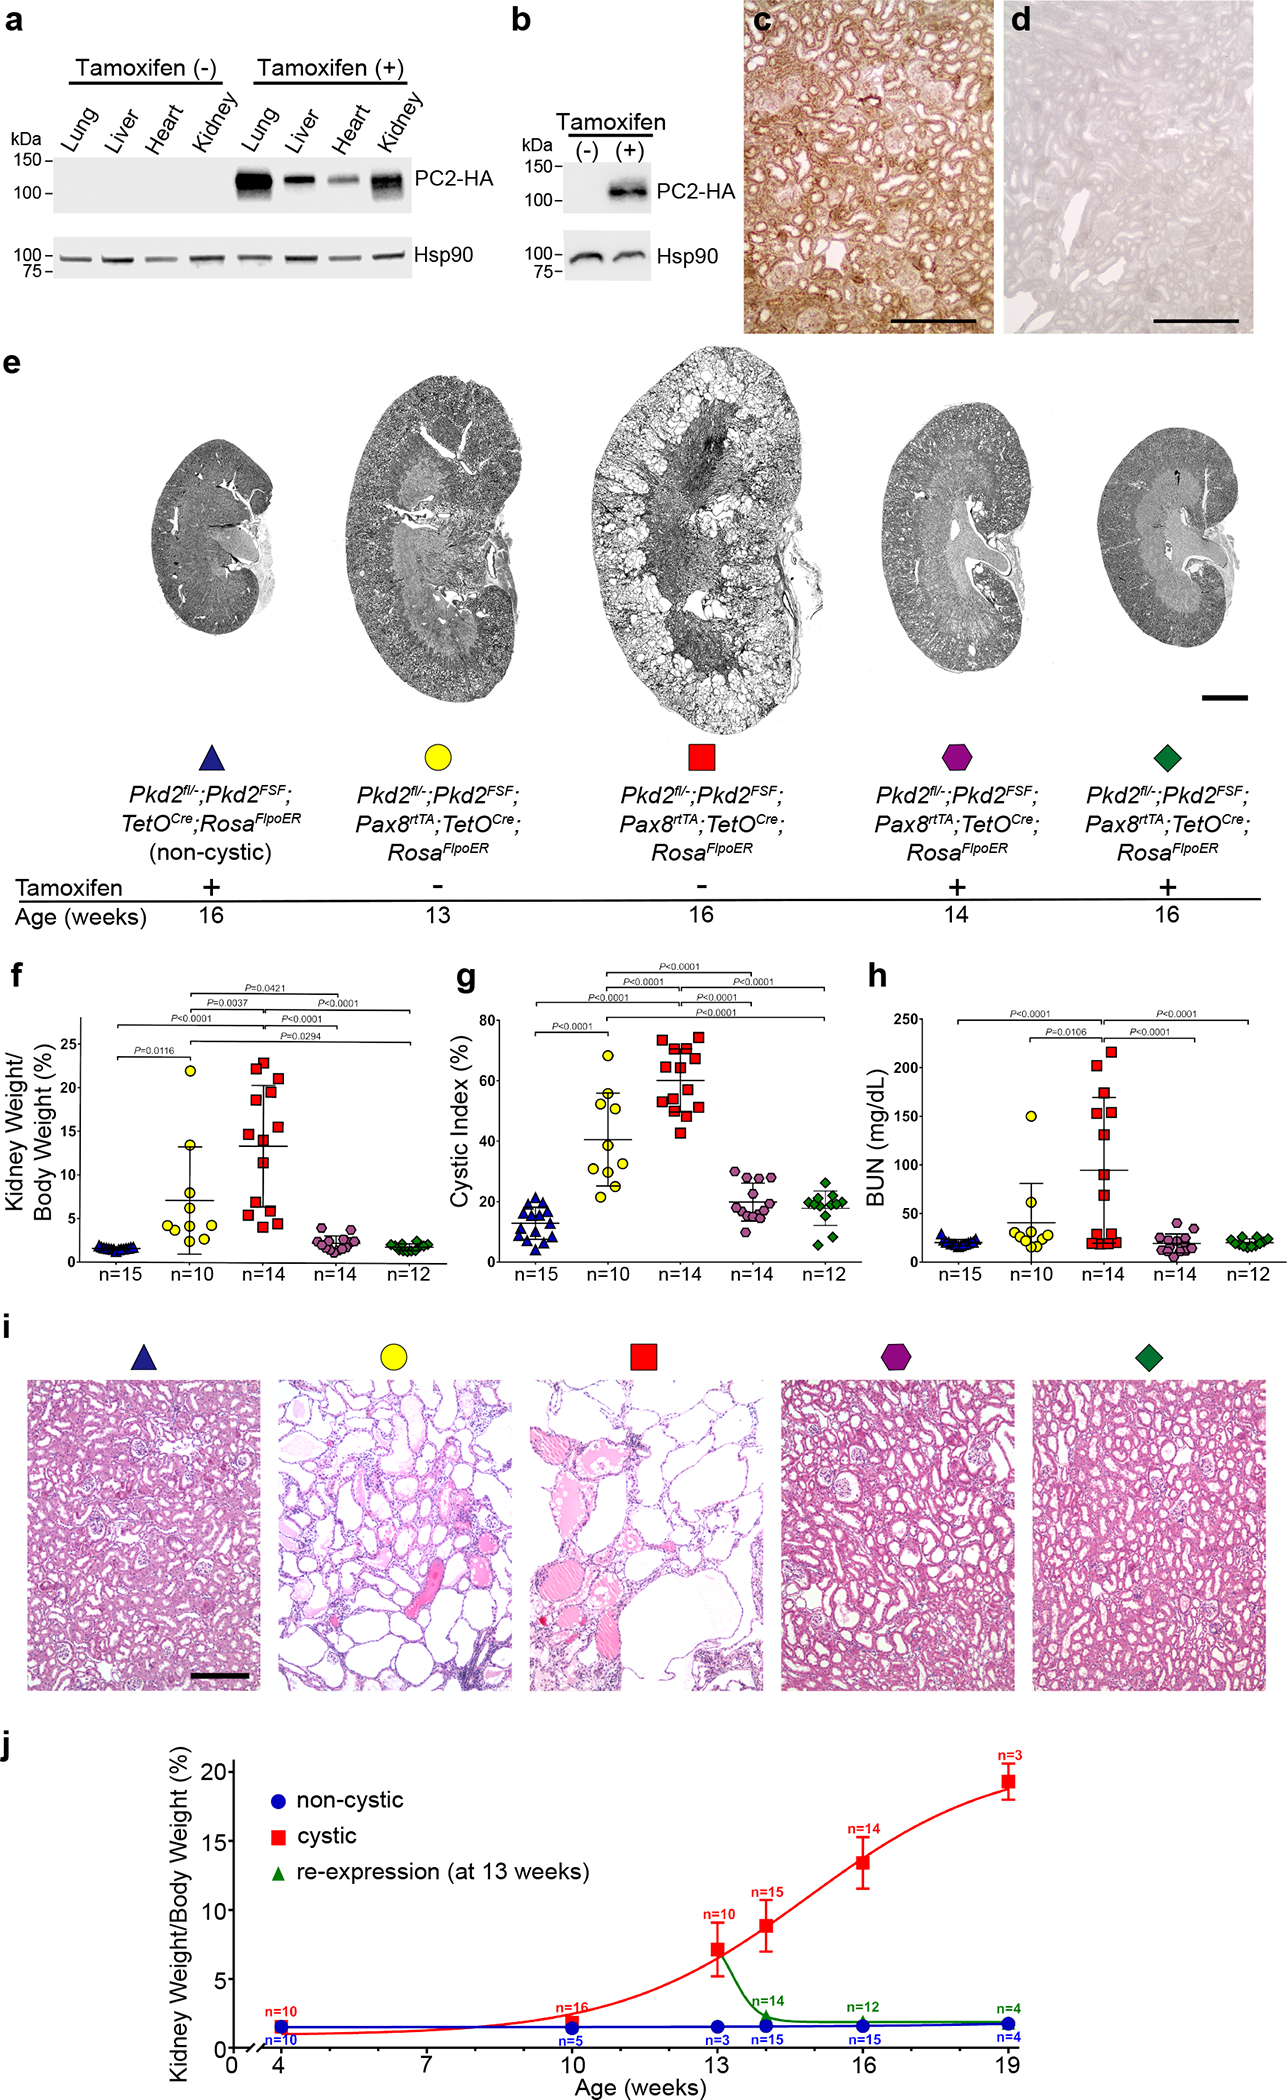
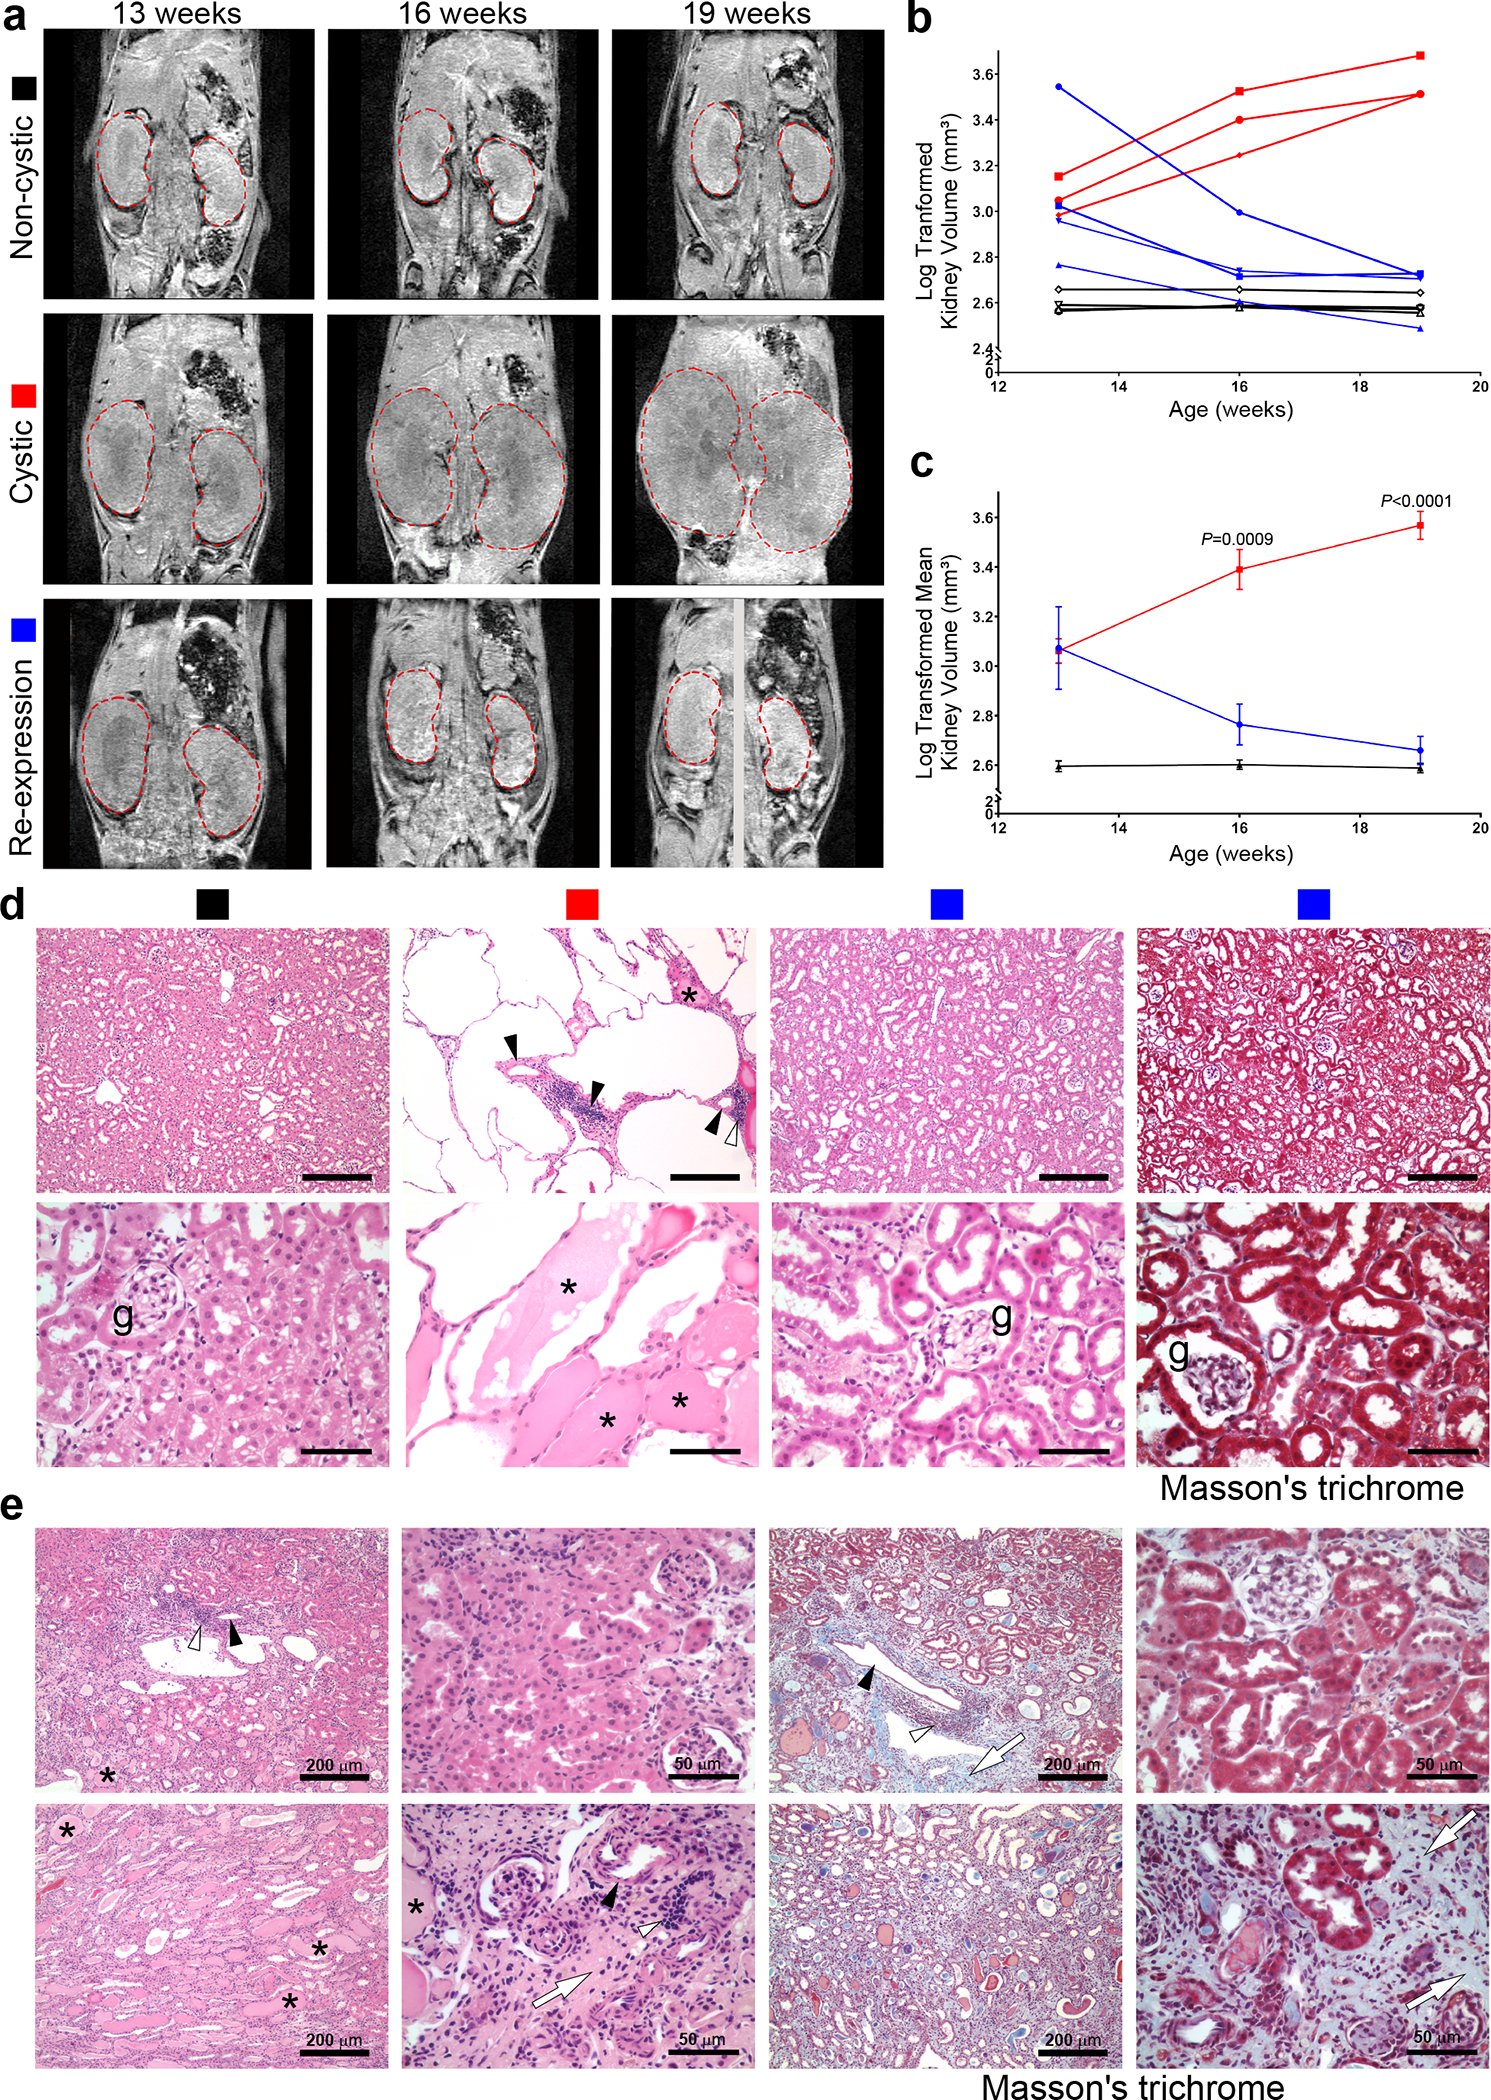
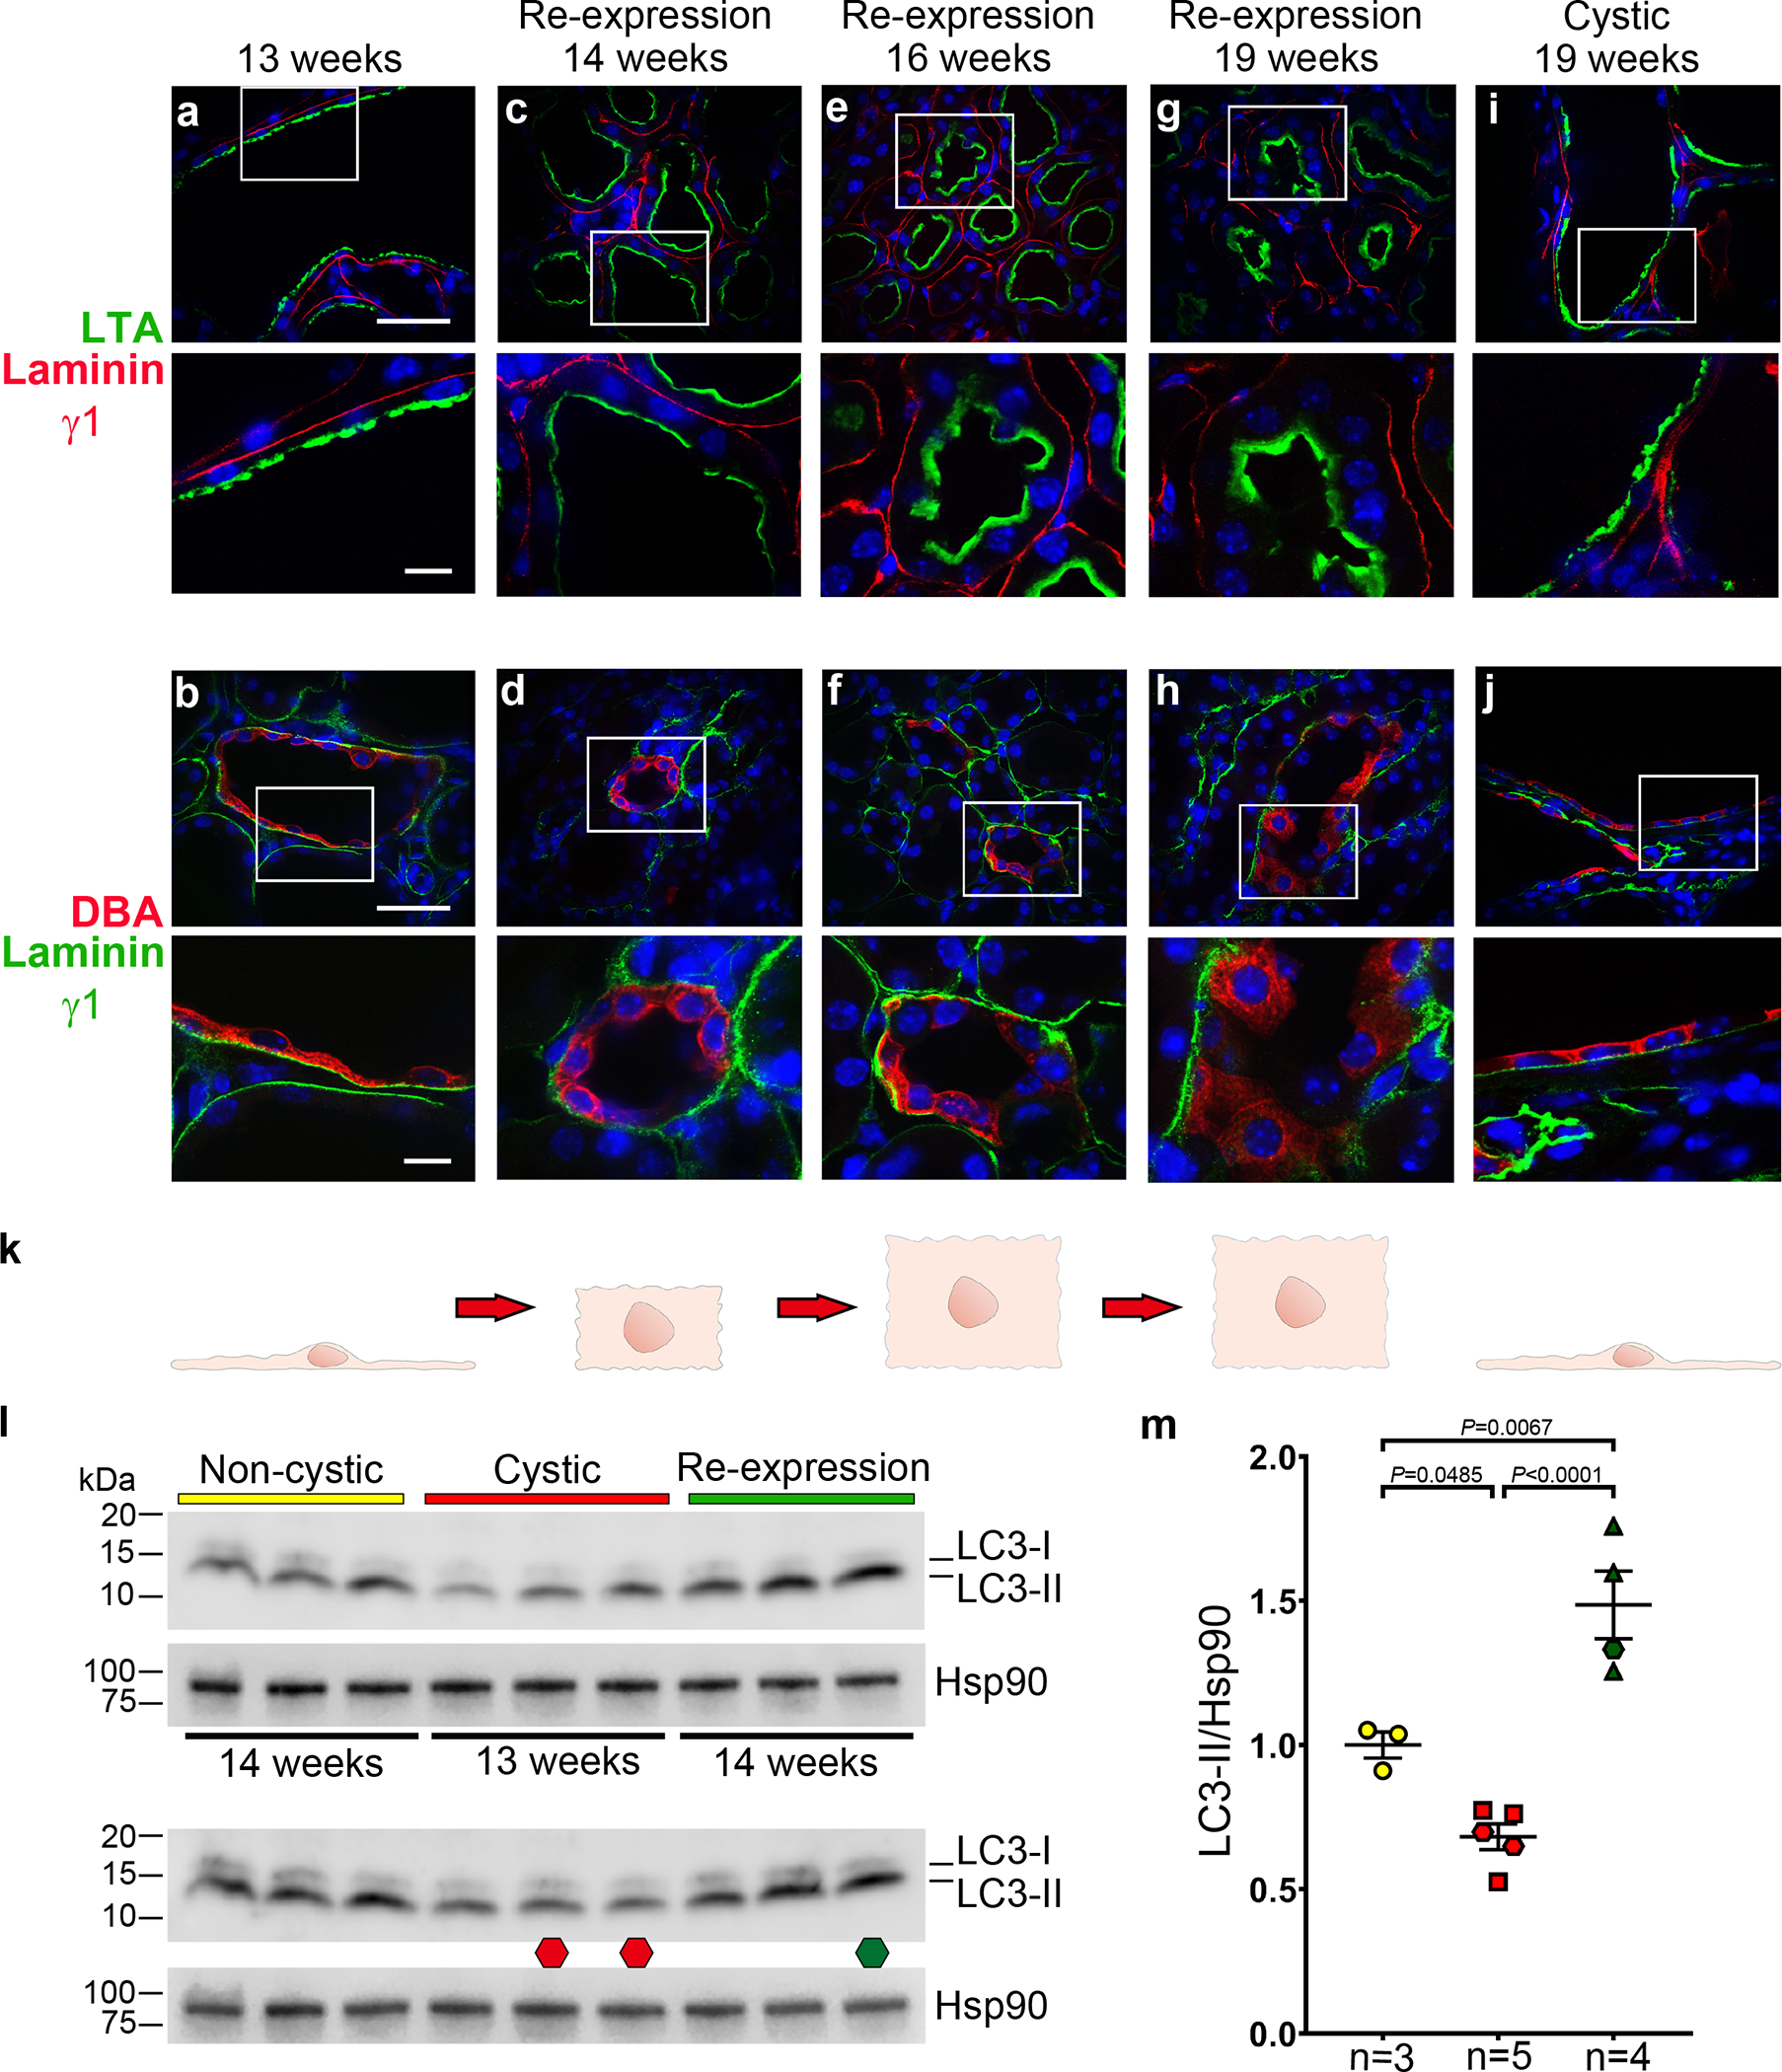
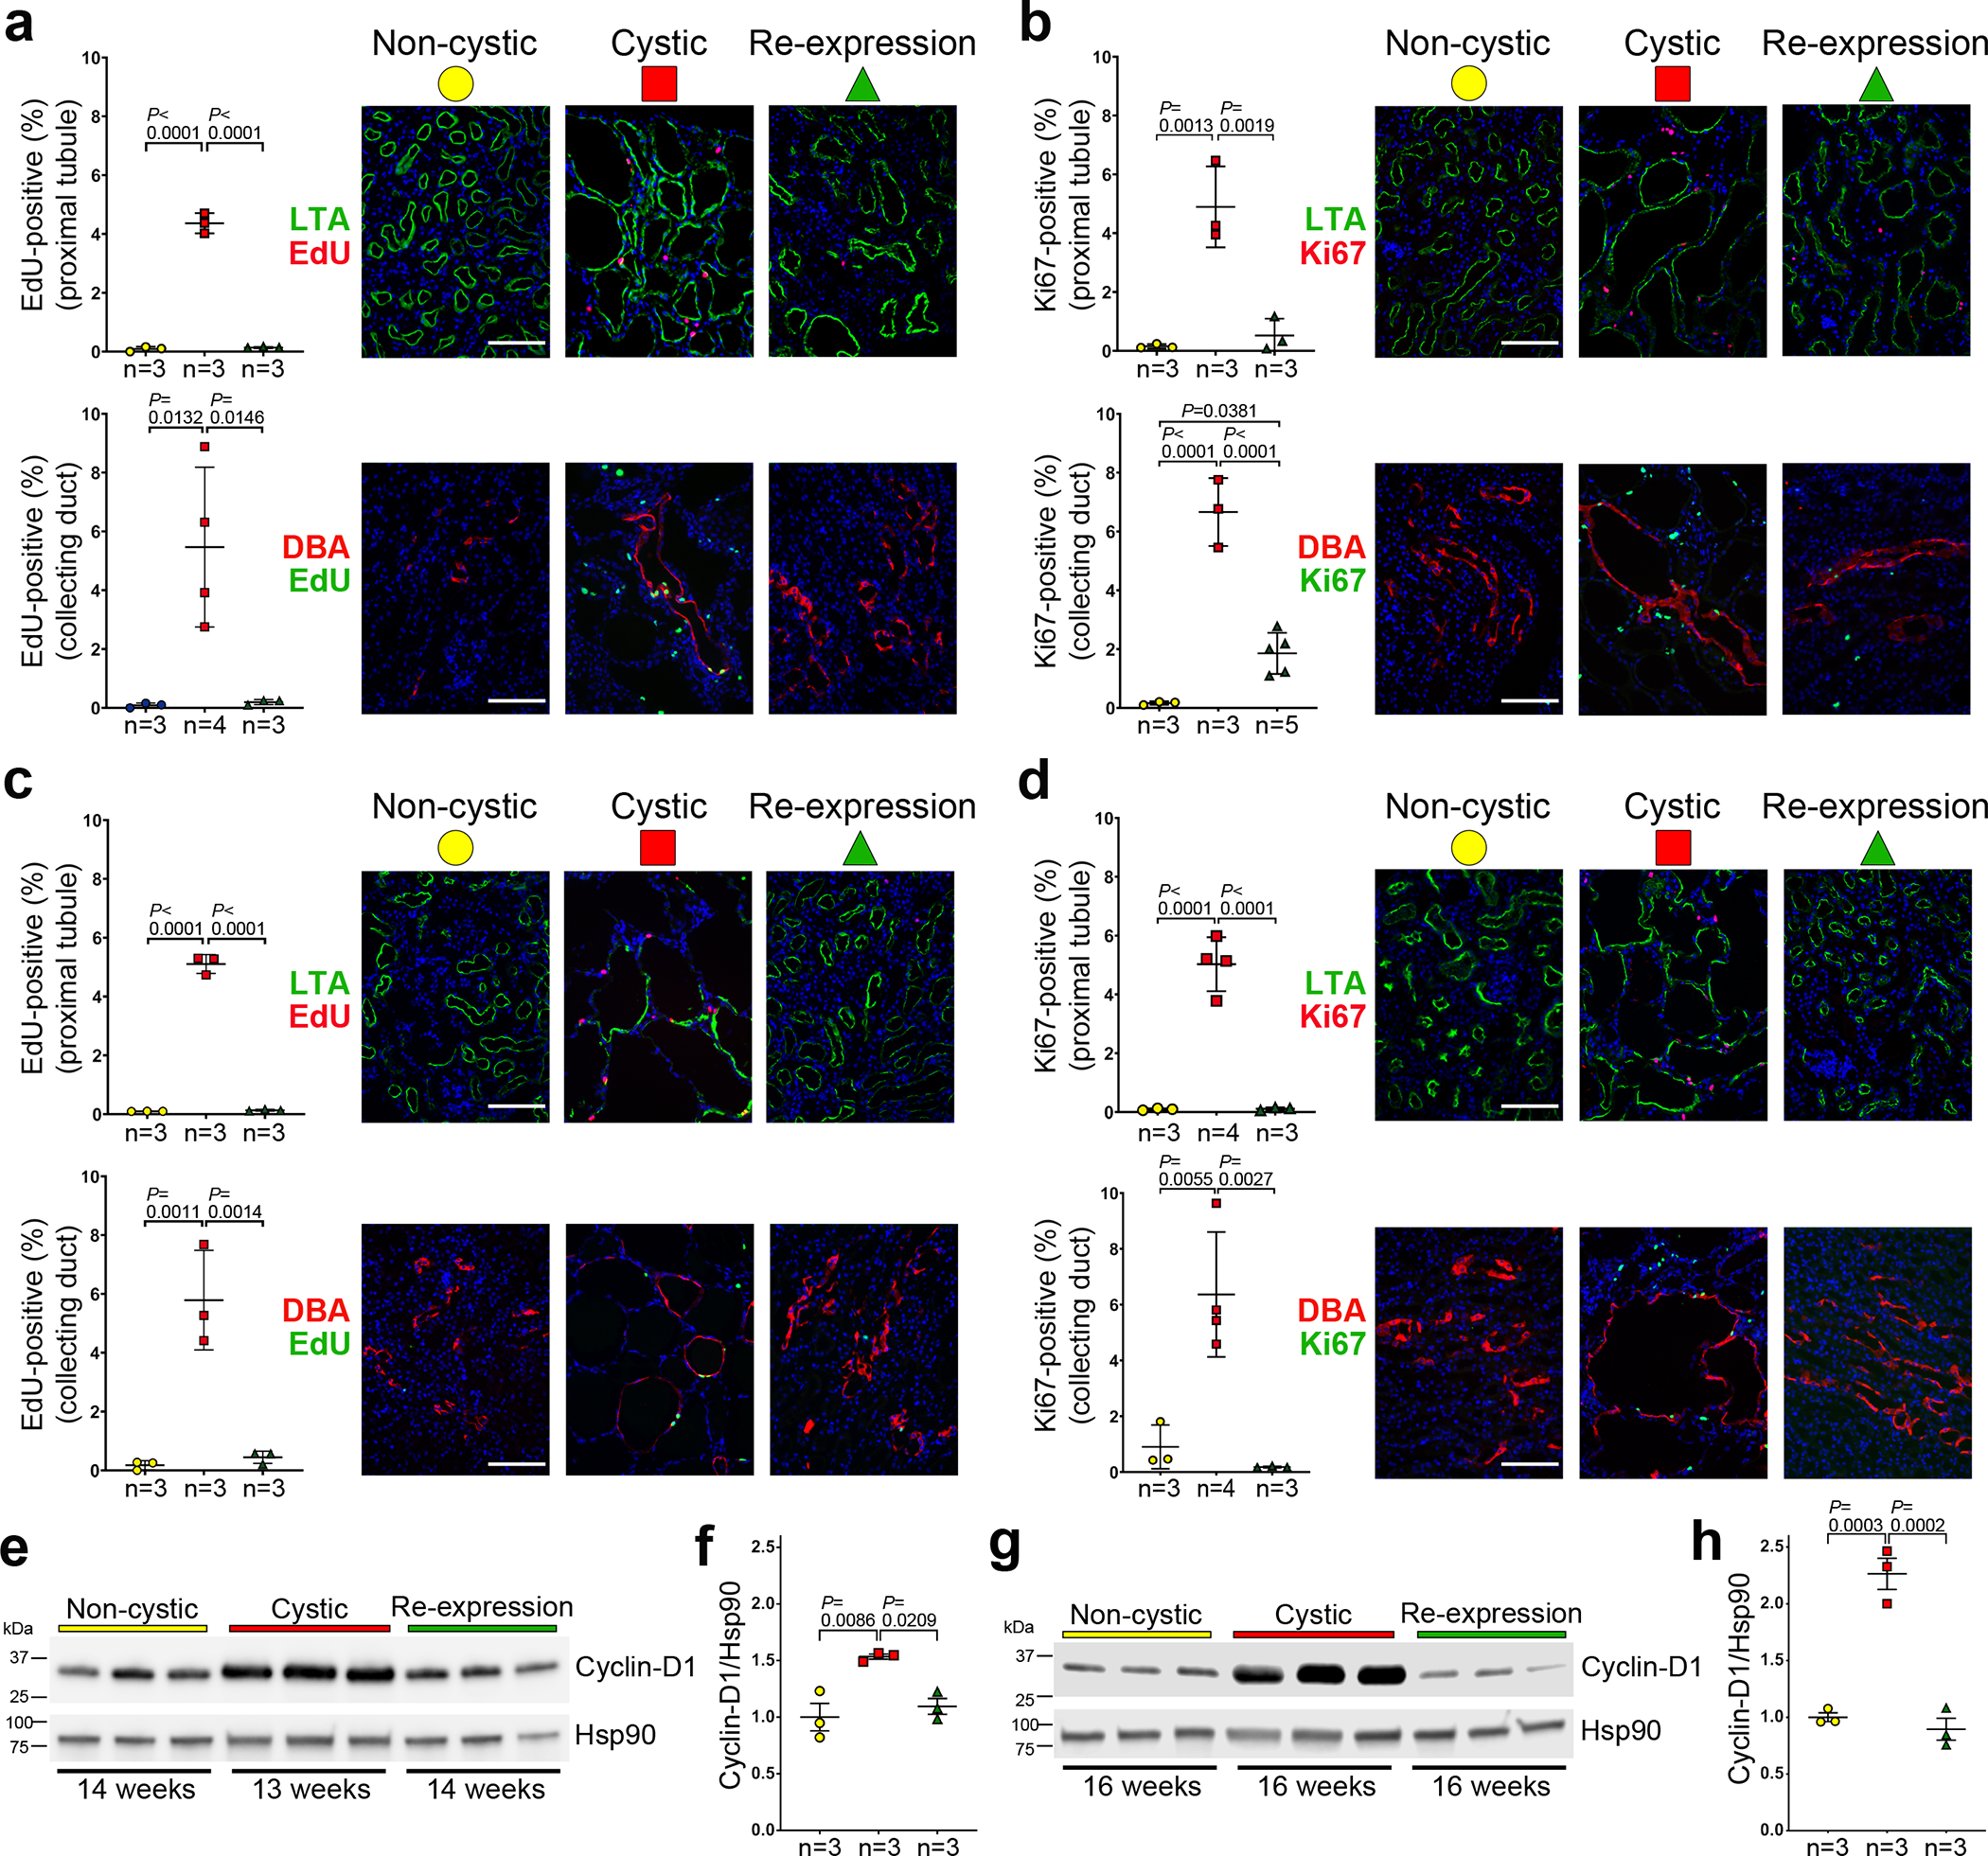
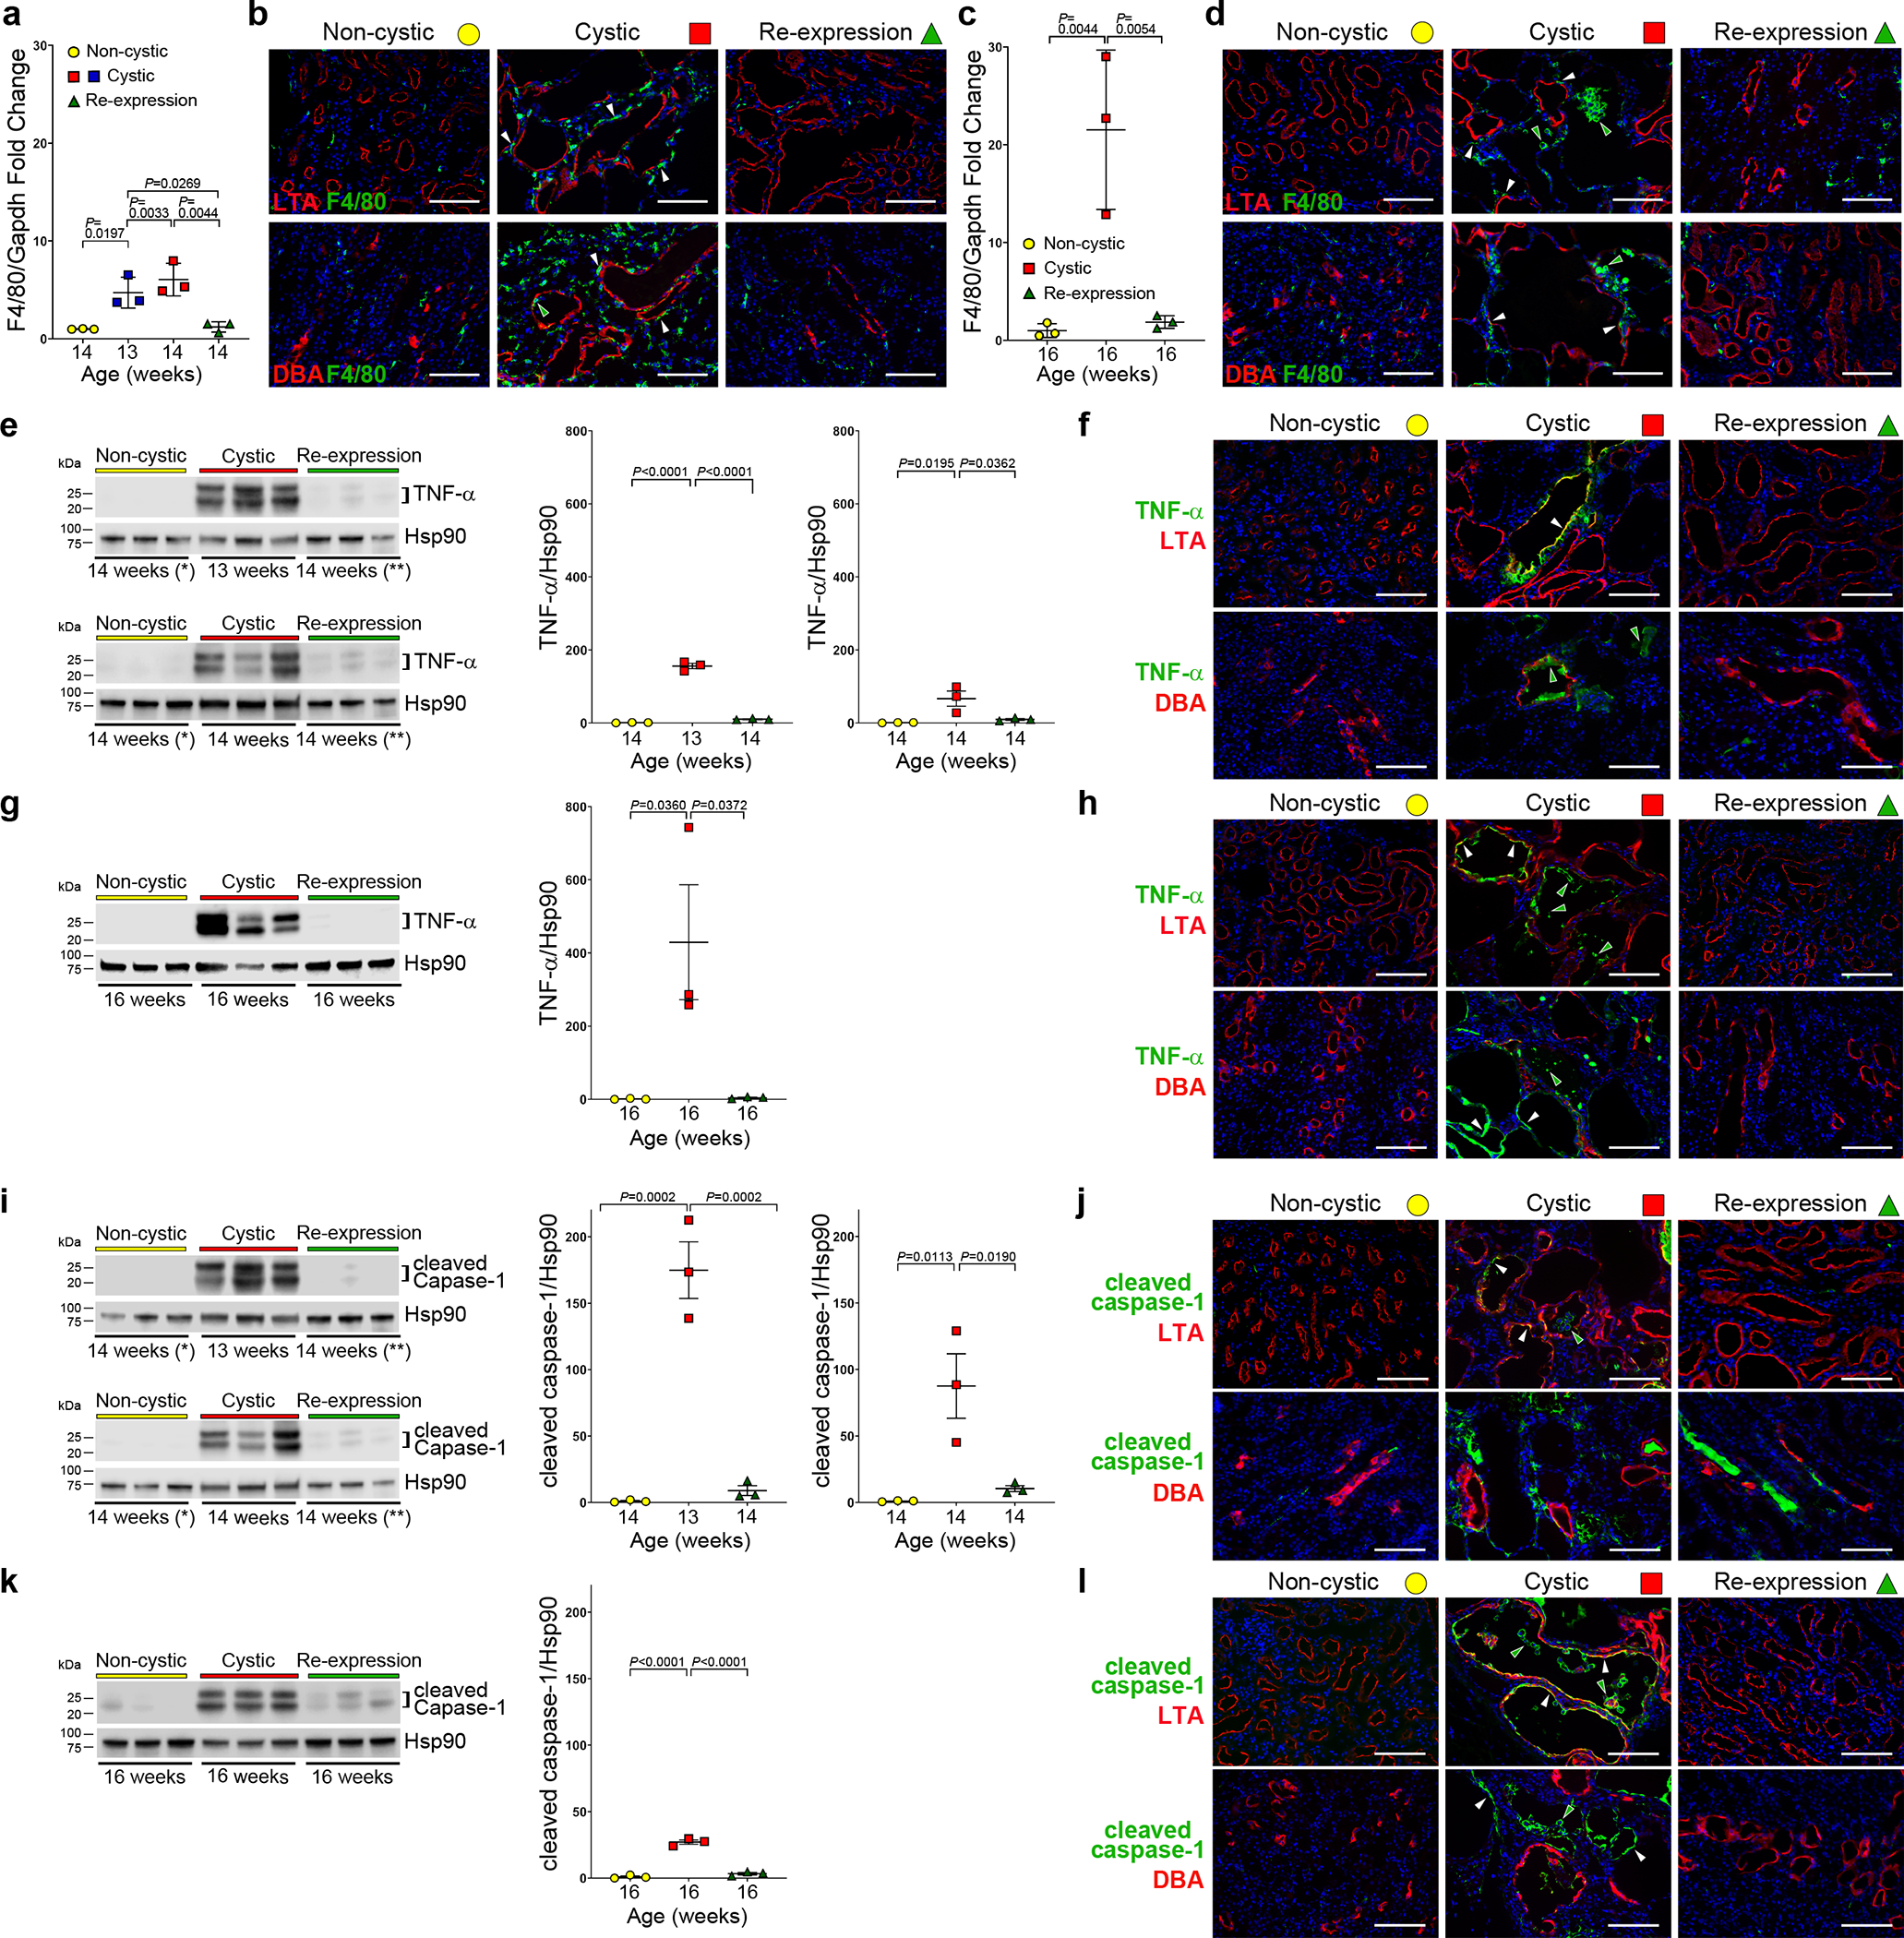
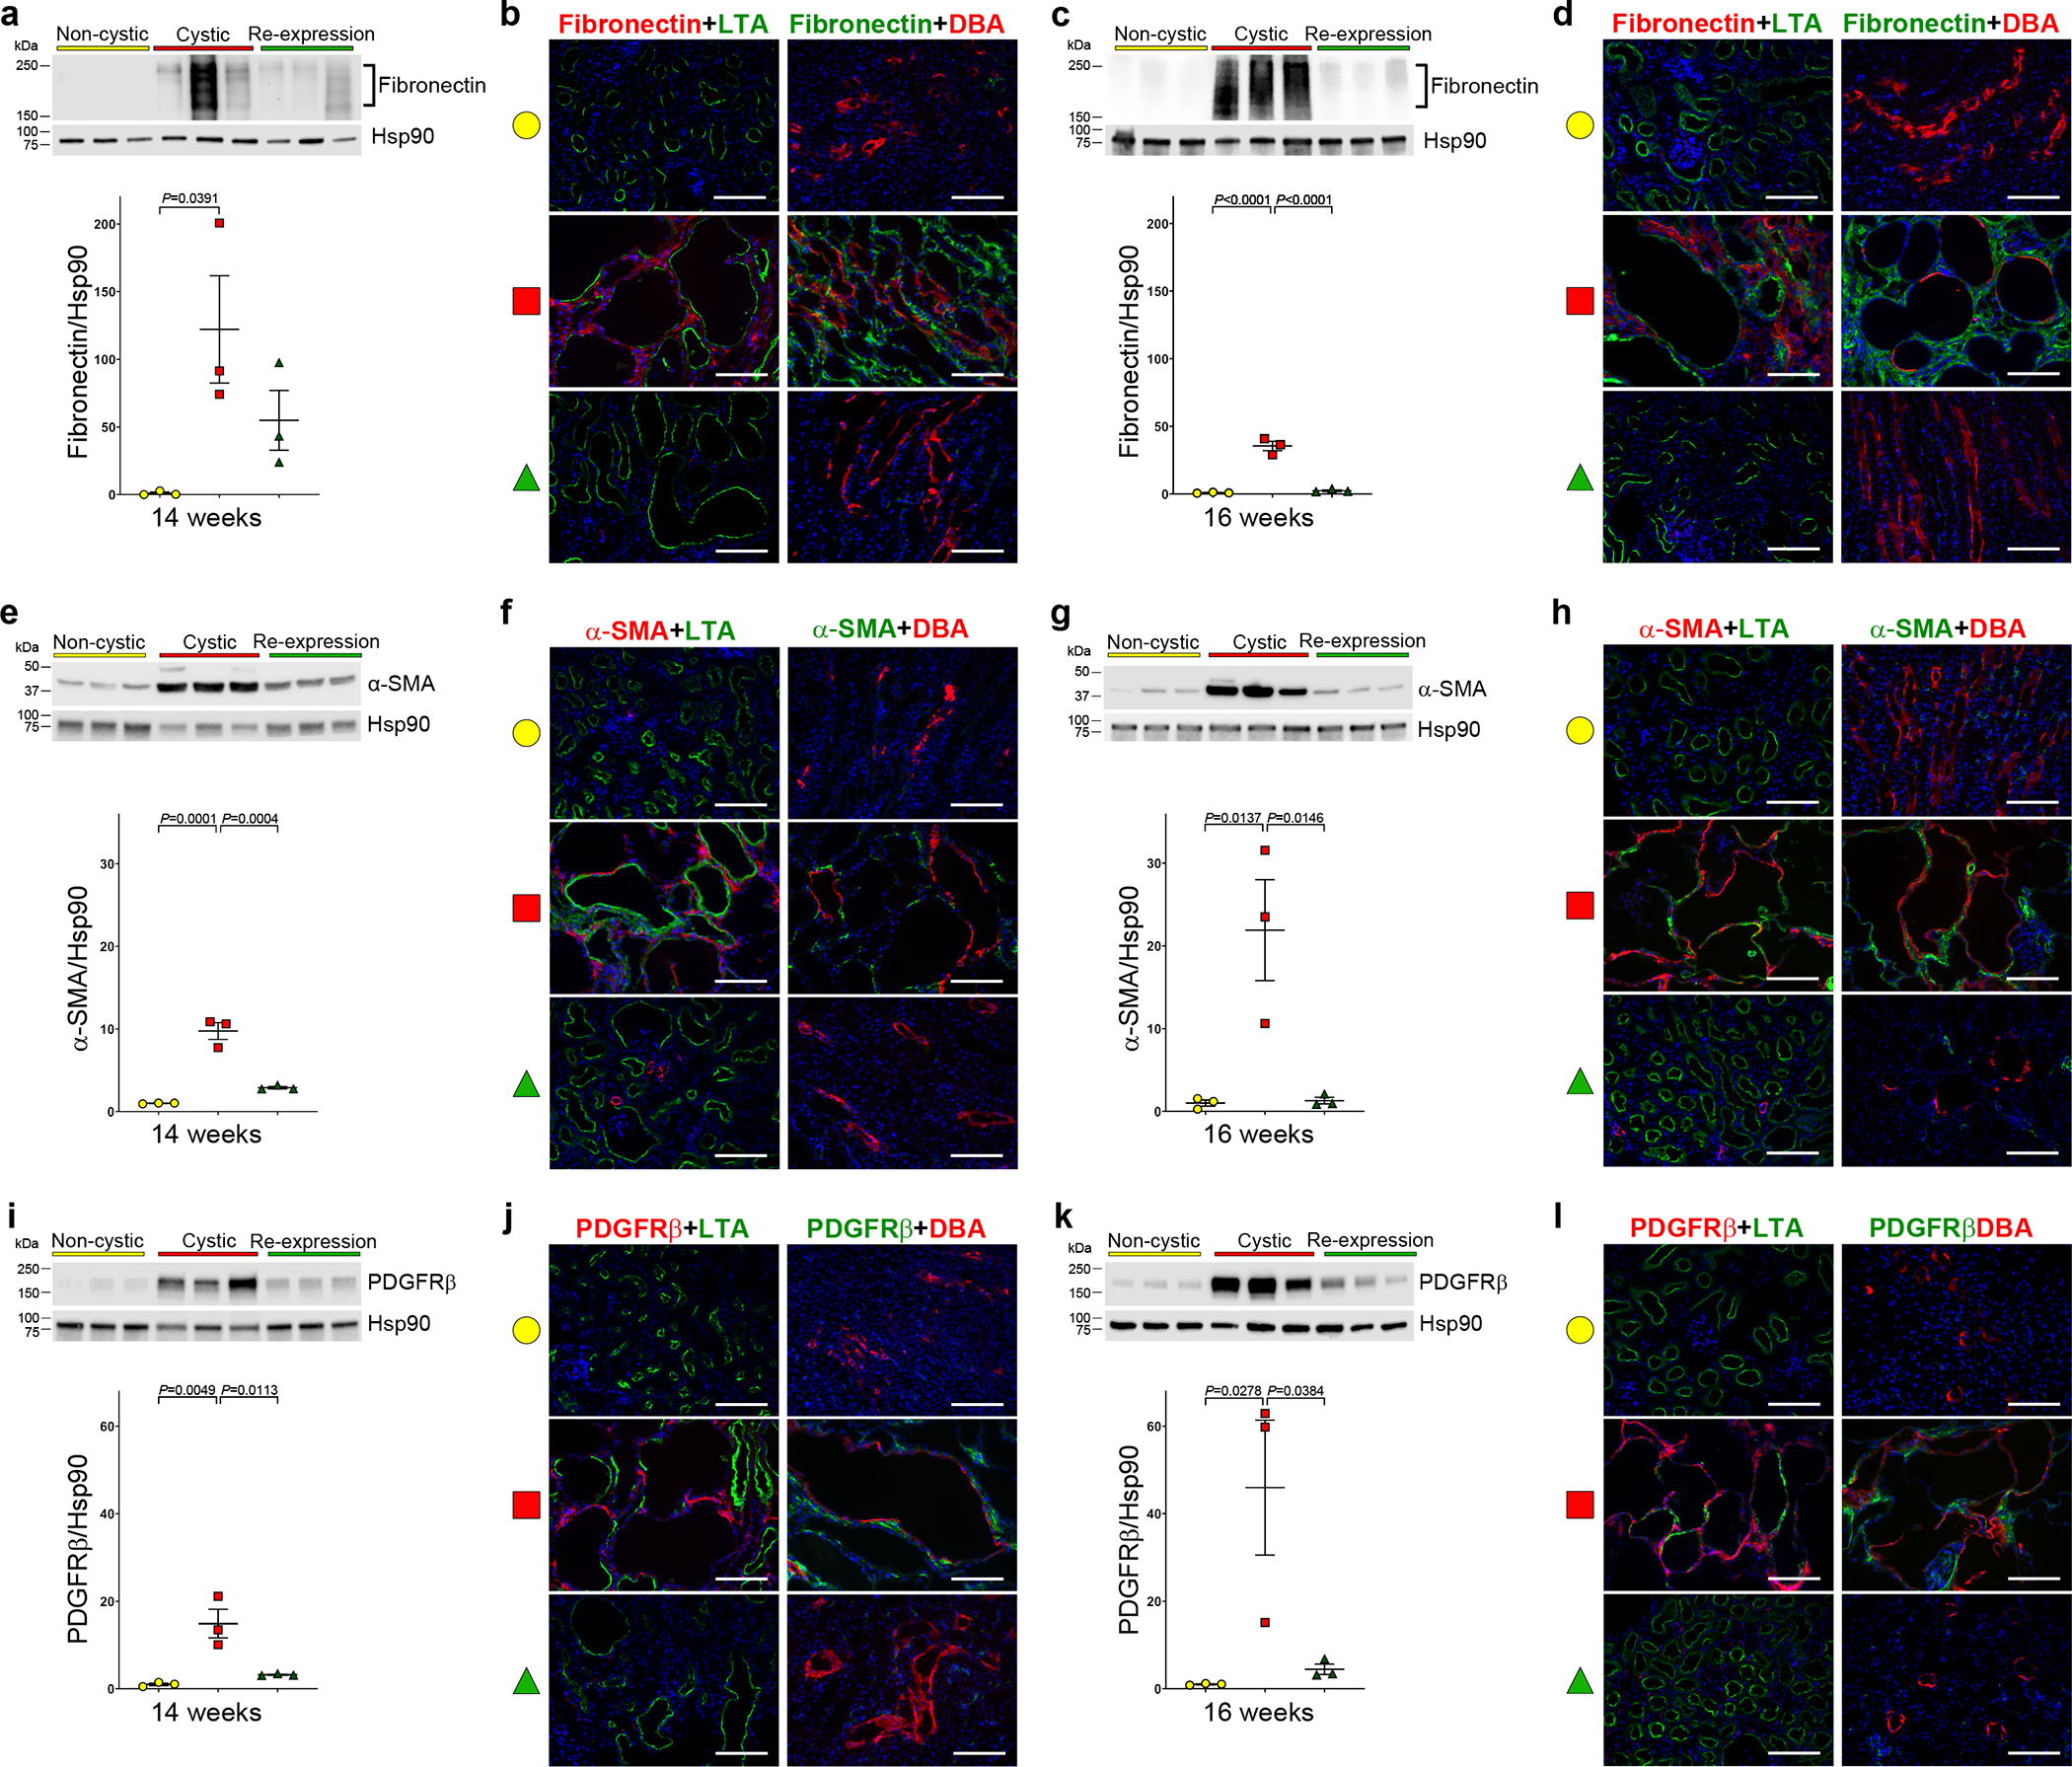
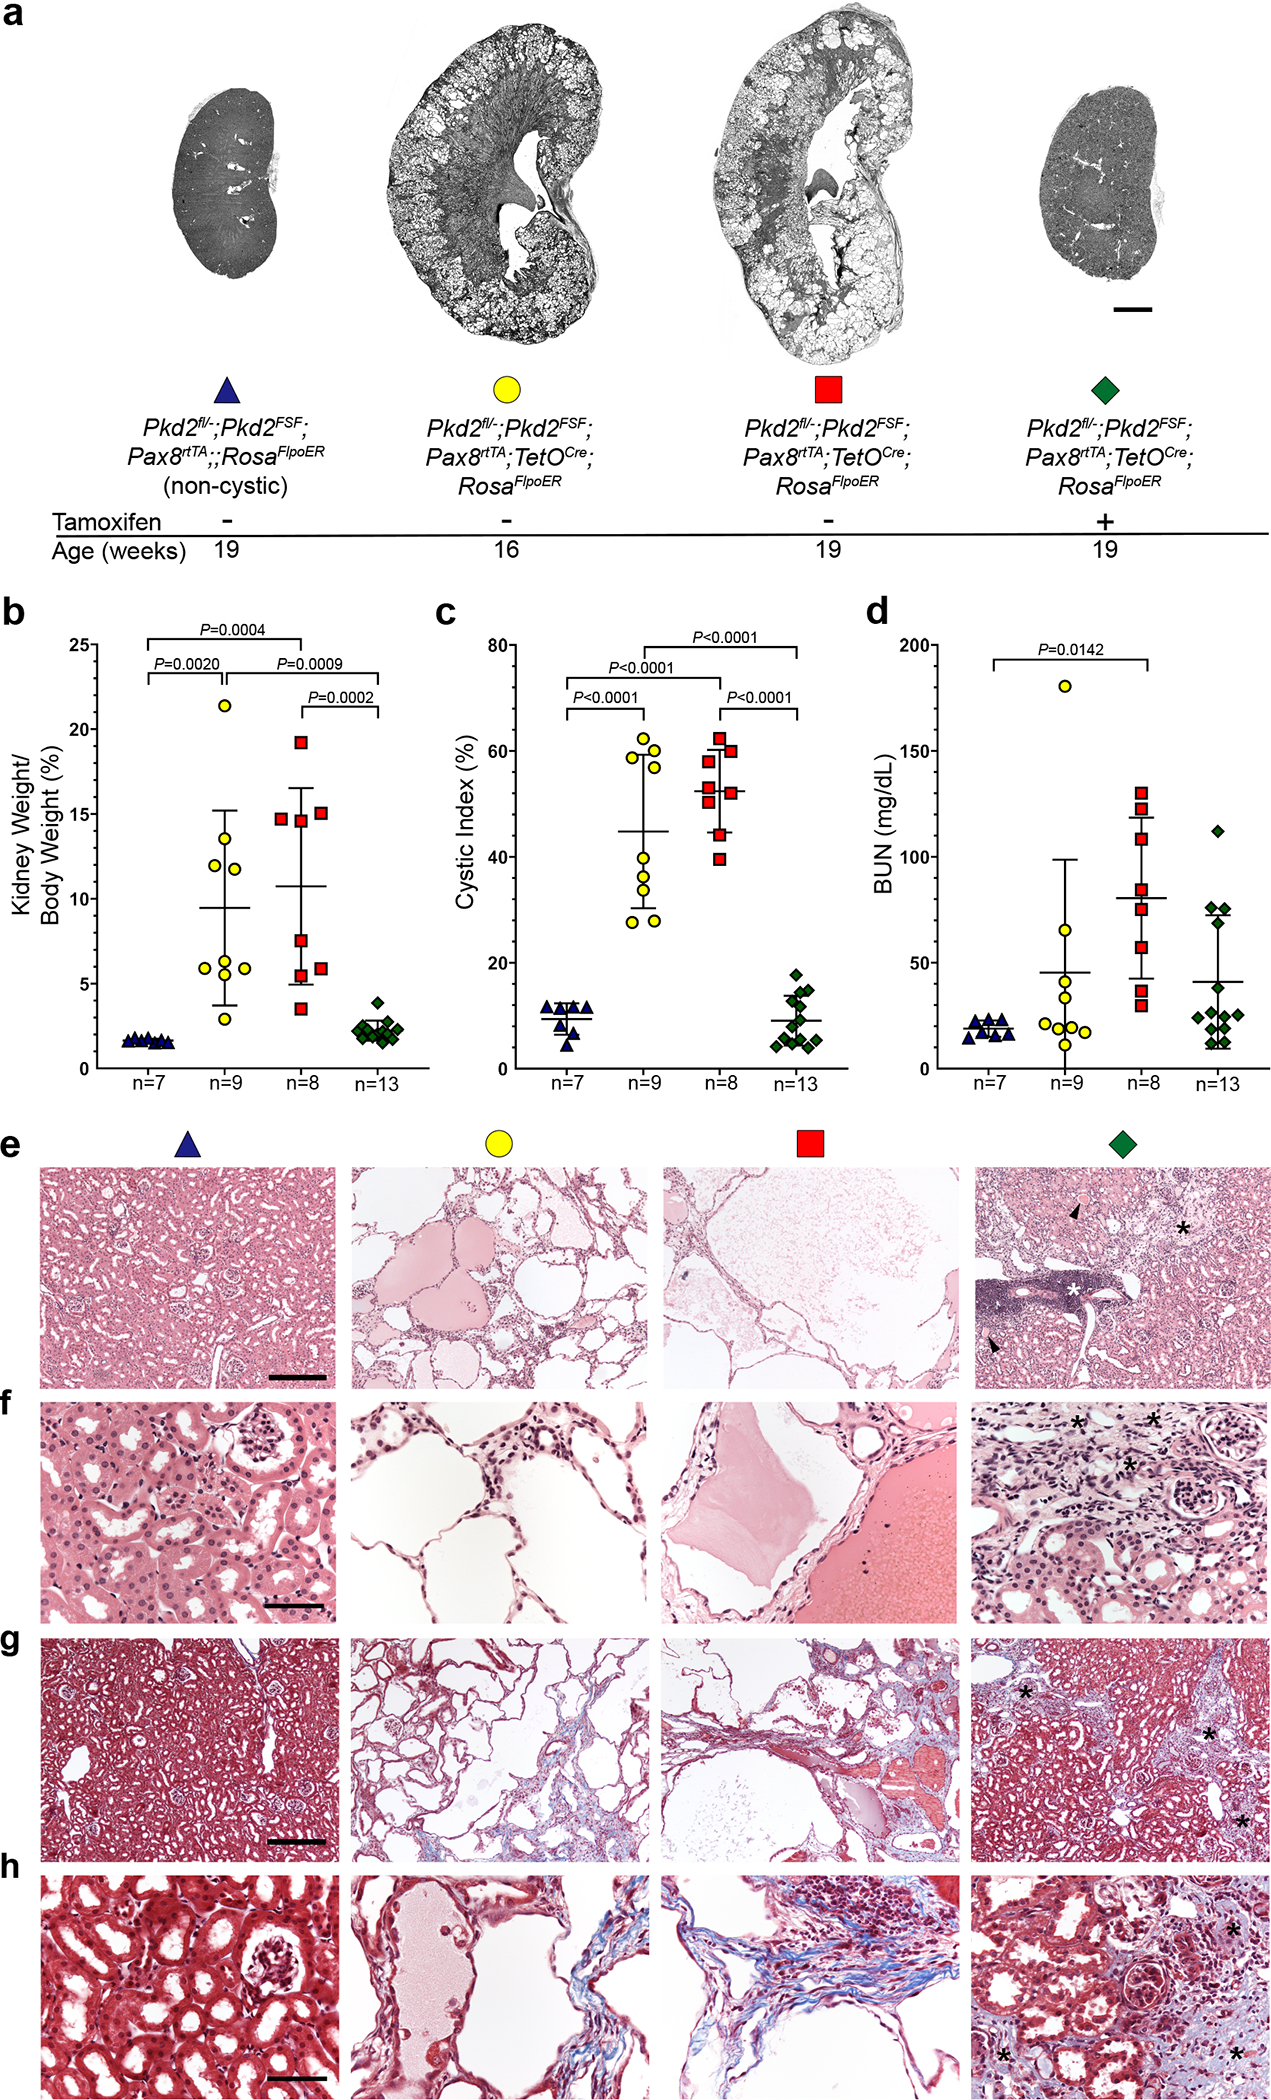
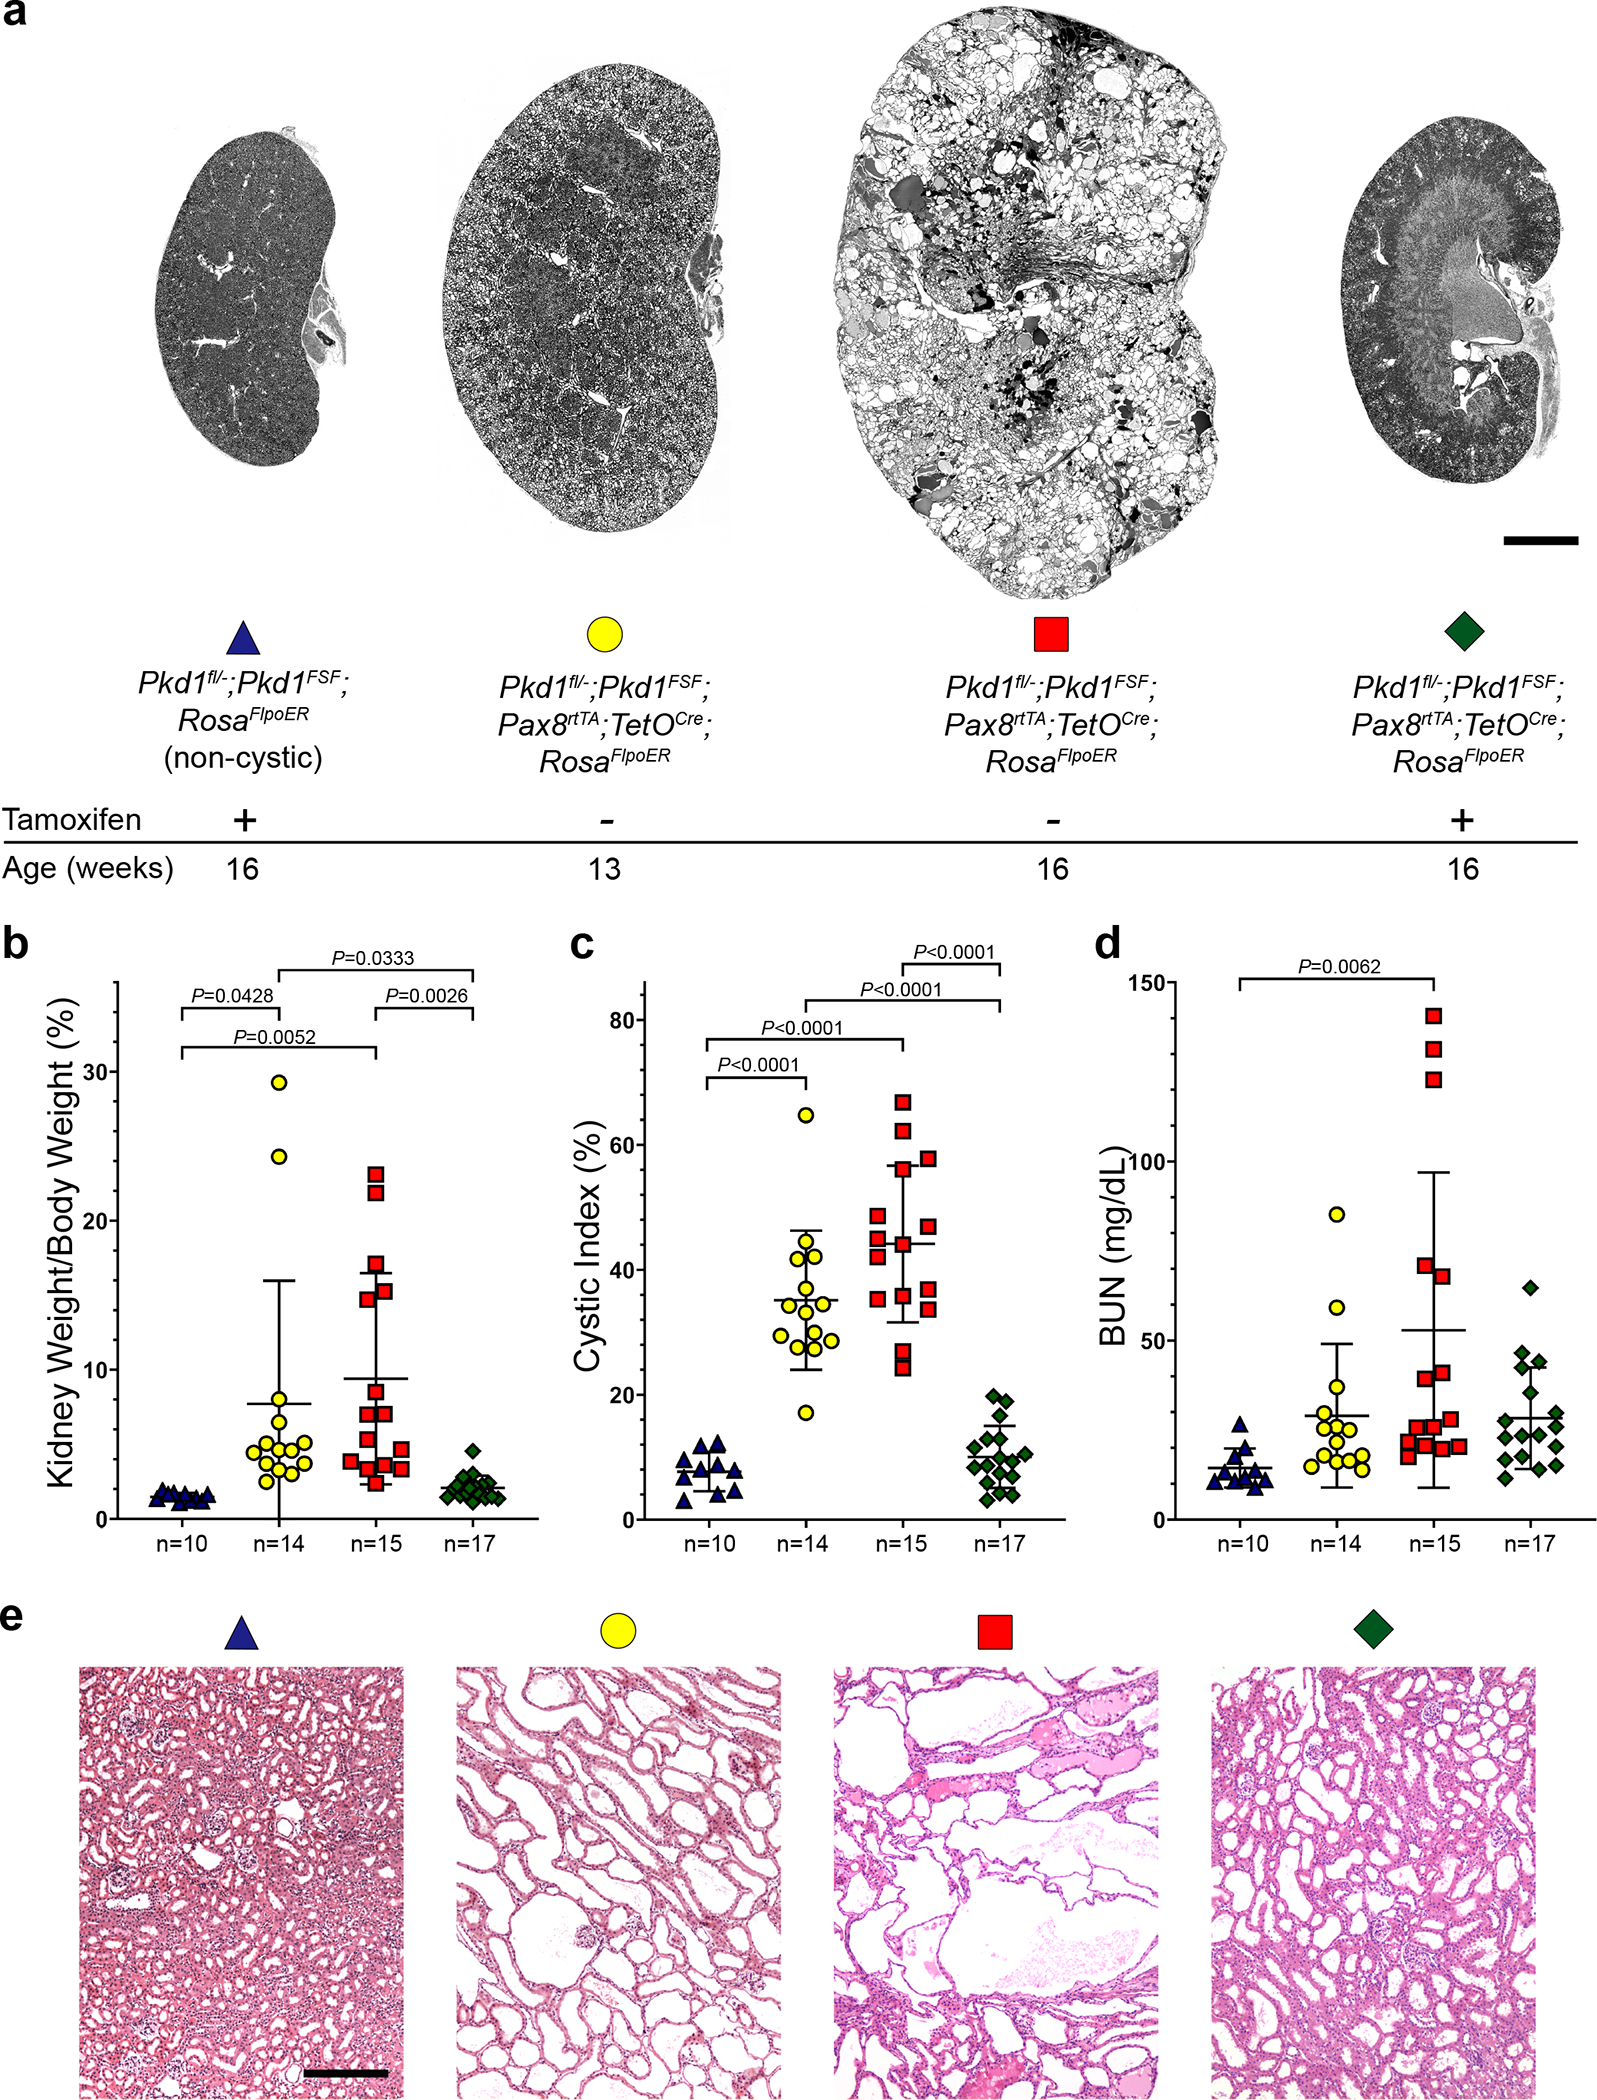
Initiation of cyst formation in autosomal dominant polycystic kidney disease (ADPKD) occurs when kidney tubule cells are rendered null for either PKD1 or PKD2 by somatic 'second hit' mutations. Subsequent cyst progression remodels the organ through changes in tubule cell shape, proliferation and secretion. The kidney develops inflammation and fibrosis. We constructed a mouse model in which adult inactivation of either Pkd gene can be followed by reactivation of the gene at a later time. Using this model, we show that re-expression of Pkd genes in cystic kidneys results in rapid reversal of ADPKD. Cyst cell proliferation is reduced, autophagy is activated and cystic tubules with expanded lumina lined by squamoid cells revert to normal lumina lined by cuboidal cells. Increases in inflammation, extracellular matrix deposition and myofibroblast activation are reversed, and the kidneys become smaller. We conclude that phenotypic features of ADPKD are reversible and that the kidney has an unexpected capacity for plasticity controlled at least in part by ADPKD gene function.


Conflict of interest statement

Competing Interests

The authors declare no competing interests.

Figures

Figure 1 |
Figure 1 |. Reactivation of Pkd2 reverses cyst formation.
a, PC2-HA expression detected by anti-HA immunoblotting of multiple tissue lysates at 16 weeks age from Pkd2fl/—; Pkd2FSF; Pax8rtTA; TetOCre; RosaFlpoER (“Pkd2Cre/Flpo”) treated either only with oral doxycycline from P28-P42 (tamoxifen (−)) or followed by tamoxifen (+) for 7 days beginning at 13 weeks age. Expression of PC2-HA only occurs in mice that received tamoxifen. b, Kidney lysates from mice with the same genotype and treatment as a but examined at 14 weeks age showing PC-HA expression within 1 week after starting tamoxifen (+). Experiments in a and b were done 3 times, each with tissue lysates from different mice. c,d, Immunohistochemistry using anti-HA antibody with DAB staining in kidney sections from 16-week-old mice with the genotypes in a showing diffuse PC2-HA expression (brown) following tamoxifen induction (c) and absence of PC2-HA expression without tamoxifen induction (d). Experiments in c and d were done 3 times, each with tissue sections from different mice. Scale bar, 200 μm. e, Representative images of kidneys from mice with the indicated genotypes and ages. All mice received doxycycline (P28–42). Tamoxifen was administered daily for 7 days beginning at 13 weeks age to induce Pkd2 re-expression in the groups indicated (+). Scale bar, 2 mm. f-h, Aggregate quantitative data for KW/BW ratio (f), CI (g) and BUN (h). Colors and symbol shapes correspond to genotype, age and treatment groups defined in e; n, number of mice in each group. Sex information is provided in Supplementary Figure 4. Multiple-group comparisons by one-way ANOVA followed by Tukey’s multiple-comparison test, presented as mean ± s.e.m. i, Representative hematoxylin and eosin stained histological sections from kidneys with the genotypes, ages and doxycycline/tamoxifen regimens corresponding to the color and symbol shape coding in e. At least one histological section from at least one kidney of each mouse in f-h was examined. Scale bar, 200 μm. j, Time course of change in KW/BW ratio for Pkd2fl/−; Pkd2FSF; TetOCre; RosaFlpoER mice treated with doxycycline and tamoxifen (non-cystic, blue) and Pkd2Cre/Flpo mice treated only with doxycycline from P28–42 to inactivate Pkd2 (cystic, red) or with doxycycline followed by tamoxifen for 7 days beginning at 13 weeks (re-expression, green). Each data point is presented as the mean ± s.e.m.; the Hill slope is +0.22 for the cystic model (red) and −1.70 for the re-expression model (green). Reduction of kidney volume following re-expression of PC2 occurs more rapidly than the increase in volume following inactivation of PC2. Full-length blots are provided as Source Data.
Figure 2 |
Figure 2 |. Serial imaging shows reduction in total kidney volume following PC2 re-expression.
a, Representative images from MRI studies of individual mice at the indicated ages. All mice had the Pkd2Cre/Flpo genotype. “Non-cystic” mice (black square) received neither doxycycline nor tamoxifen; “cystic” mice (red square) received only doxycycline from P28–42; “re-expression” mice (blue square) received doxycycline from P28–42 and tamoxifen for 1 week beginning after the initial MRI at 13 weeks age. Kidneys in the frontal plane are outlined in dashed red lines. The 19-week re-expression mouse (bottom right panel) was rotated during imaging so the frontal plane for each kidney was obtained from different slices of the same MRI acquisition. b, Log transformed kidney total volumes over time plotted for individual mice. c, Mean log transformed kidney volumes for each treatment group. Colors in b and c correspond to treatment groups labeled in a. Multiple group comparisons were performed using two-way ANOVA followed by Tukey’s multiple comparison test and are presented as the mean ± s.e.m. Representative frontal plane MR images for all mice are provided in Supplementary Figure 6 and absolute kidney volume measurements are provided in Supplementary Table 1. d, Representative histological sections from mice at 19 weeks age with treatments denoted by the colored squares. Hematoxylin and eosin stain for each group and Masson’s trichrome stain for the re-expression group (rightmost panel). Absence of significant blue staining in the latter indicates absence of fibrosis after re-expression. Asterisks show proteinaceous deposits in cysts; open arrowheads indicate inflammatory infiltrates occurring near blood vessels marked by black arrowheads; g, glomerulus. At least one histological section from each kidney of the 10 mice in b was examined with each stain. Scale bars: upper panels, 200 μm; lower panels, 50 μm. e, Hematoxylin and eosin (left four panels) and Masson’s trichrome (right four panels) from the mouse in the MRI study with the markedly enlarged kidneys at 13 weeks that showed >6-fold reduction in volume at 19 weeks (see text and images in red box in Supplementary Fig. 6). While some areas appear histologically normal, the incomplete functional recovery in this mouse (elevated BUN, Supplementary Table 1) is correlated with areas of fibrosis and disappearance of tubules (white arrows), occasional inflammatory infiltrates (open arrowheads) sometimes associated with nearby blood vessels (black arrowheads) and dilated tubules with proteinaceous casts (asterisks). At least 3 sections from each kidney of this mouse were examined with each stain.
Figure 3 |
Figure 3 |. Changes of tubule cell shapes following re-expression of PC2.
a-j, Immunohistochemistry of kidneys from doxycycline-treated Pkd2Cre/Flpo mice at the indicated ages in the absence (a, b, i, j,) or presence (c-h) of PC2 re-expression beginning at 13 weeks. Proximal tubules are marked by Lotus tetragonolobus agglutinin (LTA; a, c, e, g, i) and collecting ducts are marked by Dolichos biflorus agglutinin (DBA; b, d, f, h, j). Tubular basement membranes are marked by laminin γ1 in all images to highlight the relative changes in cell shape from flattened squamoid morphology (a, b, i, j) to progressively more cuboidal shape (c-h). Nuclei are stained with Hoechst stain (blue). At least one section from 3 kidneys for each treatment and age group were examined with each nephron segment marker. The lower image in each panel is an enlarged view of the white-boxed regions in the respective upper panel. Scale bars: upper panels, 40 μm; lower panels, 10 μm. k, Schematic drawing illustrating the pattern of changes in cell shapes in the corresponding column of images above. l,m, Changes in autophagy with Pkd2 inactivation and re-expression. Immunoblots (l) and quantitation of changes in LC3-II expression (m). All mice received doxycycline from P28–42 and were fasted for 20 hours and treated with bafilomycin A1 for 2 hours before harvesting kidney tissue at the indicated ages, which apply to both upper and lower blots. Non-cystic (yellow), no Pax8rtTA allele; cystic (red), Pkd2Cre/Flpo mice; re-expression (green), Pkd2Cre/Flpo mice also treated with tamoxifen at 13 weeks. In l, two immunoblots were run to allow comparison of additional samples. The lower immunoblot has the same samples and loading as the upper blot except for two lanes marked by the red octagon at 13 weeks age and one lane marked with the green octagon at 14 weeks which are different biological samples. In m, densitometric ratios of LC3-II to Hsp90 for each lane are shown relative to the mean of the ratio in the non-cystic samples, which is set a value of 1.0 to normalize expression in each blot. Hexagons, data from lower blot. Multiple group comparisons were performed using one-way ANOVA followed by Tukey’s multiple comparison test and are presented as the mean ± s.e.m. Full-length blots are provided as Source Data.
Figure 4 |
Figure 4 |. Decreased cyst cell proliferation following re-expression of PC2.
a-d, Aggregate quantitative data and representative images showing the percentage of EdU-positive nuclei (a, c) and Ki67-positive nuclei (b, d) in the kidneys of mice at 14 weeks (a, b) and 16 weeks (c, d) age. All mice have the Pkd2Cre/Flpo genotype. “Non-cystic” mice (yellow circle) received neither doxycycline nor tamoxifen; “Cystic” mice (red square) received only doxycycline from P28–42; “Re-expression” mice (green triangle) received doxycycline from P28–42 and tamoxifen for 1 week beginning at 13 weeks age. The rate of EdU and Ki67 positive nuclei amongst 1,000 nuclei marked by DAPI (blue) in cells positive for Lotus tetragonolobus agglutinin (LTA; proximal tubule) and Dolichos biflorus agglutinin (DBA; collecting duct), respectively, was determined in each mouse. The indicated “n” are the number of mice in each group. Scale bars, 100 μm. e-h, Changes in cyclin-D1 expression in kidneys with Pkd2 inactivation and re-expression. Immunoblots (e, g) and quantitation using densitometric ratios (f, h) of three biological samples for each treatment indicated by the color key in a-d. Ages are indicated below the immunoblots. Densitometric ratios of cyclin-D1 to Hsp90 for each lane are shown relative to the mean of the ratio in the non-cystic samples, which is set a value of 1.0. Multiple group comparisons were performed using one-way ANOVA followed by Tukey’s multiple comparison test and are presented as the mean ± s.e.m. Full-length blots are provided as Source Data.
Figure 5 |
Figure 5 |. Reversal of inflammatory changes in cystic kidneys following PC2-HA re-expression.
a-d, F4/80 mRNA expression in whole kidney lysates (a, c) and representative images of F4/80 stained kidney sections (b, d) at 14 (b) and 16 (d) weeks. All mice have the Pkd2Cre/Flpo genotype (a-l). Color key: non-cystic (yellow), no treatment; cystic (red), doxycycline from P28–42; re-expression (green), doxycycline from P28–42 and tamoxifen for 7 days beginning at 13 weeks. a,c, Fold-change mRNA expression at the indicated ages, normalized to Gapdh relative to the mean for non-cystic kidneys which is set to 1.0. b,d, F4/80 positive macrophages are increased in cystic kidneys; they appear both in the pericystic regions (white arrowheads) and on the luminal aspect of cysts (green arrowheads). Macrophages revert to normal expression in kidneys with PC2 re-expression. e-k, Changes in TNF-α (e-h) and cleaved caspase-1 (i-l) expression with Pkd2 inactivation and re-expression. Shown are immunoblots with quantitation using densitometric ratios (e, g, i, k). Samples marked with * and ** (e, i) were reloaded on both upper and lower immunoblots to allow comparison to both 13-week (top) and 14-week (bottom) cystic kidneys. Densitometric ratios include both bands for TNF-α (e, g) and cleaved caspase-1 (i, k) relative to Hsp90; fold-change is shown relative to the mean of the ratio in the non-cystic samples, which is set to 1.0. Multiple group comparisons were performed using one-way ANOVA followed by Tukey’s multiple comparison test and are presented as the mean ± SEM. Representative kidney immunocytochemistry images (f, h, j, l) from 14 week (f, j) and 16 week (h, l) kidneys. Cystic kidneys have increased TNF-α (f, h) and increased cleaved caspase-1 (j, l) expression in a subset of cyst cells (white arrowheads) and cyst lumens (green arrowheads). TNF-α and cleaved caspase-1 immunofluorescence returned to control levels in tissues after re-expression of PC2. LTA, Lotus tetrogonolobus agglutinin (proximal tubule); DBA, Dolichos biflorus agglutinin (collecting duct); nuclei are stained with DAPI (blue). At least one section from 3 kidneys for each treatment and age group were examined for all representative images. Scale bars, 100 μm. Full-length blots are provided as Source Data.
Figure 6 |
Figure 6 |. Reversal of fibrotic changes in cystic kidneys following PC2-HA re-expression.
a-k, Changes in fibronectin (a-d), α-SMA (e-h) and PDGFRβ (i-l) expression as a function of Pkd2 inactivation and re-expression. All mice have the Pkd2Cre/Flpo genotype. Color key in all panels are: non-cystic (yellow), no treatment; cystic (red), doxycycline from P28–42; re-expression (green), doxycycline from P28–42 and tamoxifen for 7 days beginning at 13 weeks. Shown are immunoblots and quantitation using densitometric ratios at the indicated ages (a, c, e, g, i, k). Densitometric ratios relative to Hsp90; fold-change in expression is shown relative to the mean of the ratio in the non-cystic samples on each blot, which is set to a value of 1.0. Multiple group comparisons were performed using one-way ANOVA followed by Tukey’s multiple comparison test and are presented as the mean ± s.e.m. Representative kidney immunohistochemistry images (b, d, f, h, j, l) from 14-week-old (b, j, f) and 16-week-old kidneys (d, h, l). Increased fibronectin (b, d), α-SMA (f, h) and PDGFRβ (j, l) expression is present in interstitial areas in cystic kidneys at both time points; these changes are absent after re-expression of PC2. Each panel in b, d, f, h, j and l is representative of at least one section stained from each of 3 separate kidneys. Scale bars, 100 μm. Full-length blots are provided as Source Data.
Figure 7 |
Figure 7 |. Later stage reactivation of Pkd2 reverses cyst formation but kidney repair is less complete.
a, Representative images of kidneys with the indicated genotypes and ages. All mice received doxycycline (P28–42). Tamoxifen was administered daily for 7 days beginning at 16 weeks age to induce Pkd2 reactivation in the group indicated with +. Scale bar, 2 mm. b-d, Aggregate quantitative data for the indicated parameters; n, number of mice in each group. Colors and symbol shapes correspond to genotype and treatment groups indicated in a. Sex information is provided in Supplementary Figure 14; Pkd2 models have not been reported to have sex dimorphism in disease severity. Multiple-group comparisons by one-way ANOVA followed by Tukey’s multiple-comparison test, presented as mean ± SEM. e-h, Representative hematoxylin and eosin (e, f) and Masson’s trichrome (g, h) stained histological sections from kidneys with the genotypes, ages and doxycycline/tamoxifen regimens corresponding to the color coding defined in panel a. Kidneys with PC2 re-expression beginning at 16 weeks age (green diamond) show areas of normal morphology with marked resolution of tubule dilation but also have areas of focal inflammation (white asterisks), tubule dilation with protein casts (black arrowheads) and persistence of fibrosis (black asterisks and blue stained areas in g and h). At least one histological section from at least one kidney of each mouse in b-d was examined with both stains. Scale bars: 200 μm (e, g); 50 μm (f, h).
Figure 8 |
Figure 8 |. Reactivation of Pkd1 reverses cyst formation.
a, Representative images of kidneys with the indicated genotypes and ages. All mice received doxycycline (P28–42). Tamoxifen was administered daily for 7 days beginning at 13 weeks age to induce Pkd1 reactivation in the group indicated with +. Scale bar, 2 mm. b-d, Aggregate quantitative data for the indicated parameters; n, number of mice in each group. Colors and symbol shapes correspond to genotype and treatment groups defined in a. Sex information is provided in Supplementary Figure 16. Multiple-group comparisons by one-way ANOVA followed by Tukey’s multiple-comparison test, presented as mean ± s.e.m. e, Representative hematoxylin and eosin stained histological sections from kidneys with the genotypes, ages and doxycycline/tamoxifen regimens corresponding to the color coding defined in panel a. Mild persistent tubular dilation is present in areas of the 16-week-old kidneys following re-expression of Pkd1 (green diamond). At least one histological section from at least one kidney of each mouse in b-d was examined. Scale bar, 200 μm.

Comment in

  • Reversal of PKD in mice.
    Carney EF. Carney EF. Nat Rev Nephrol. 2021 Dec;17(12):794. doi: 10.1038/s41581-021-00509-0. Nat Rev Nephrol. 2021. PMID: 34697488 No abstract available.
  • Reversing polycystic kidney disease.
    Boletta A. Boletta A. Nat Genet. 2021 Dec;53(12):1623-1624. doi: 10.1038/s41588-021-00963-3. Nat Genet. 2021. PMID: 34737430 No abstract available.

References

    1. Harris PC & Torres VE Genetic mechanisms and signaling pathways in autosomal dominant polycystic kidney disease. J. Clin. Invest. 124, 2315–2324 (2014). - PMC - PubMed
    1. Qian F, Watnick TJ, Onuchic LF & Germino GG The molecular basis of focal cyst formation in human autosomal dominant polycystic kidney disease type I. Cell 87, 979–987 (1996). - PubMed
    1. Wu G et al. Somatic inactivation of Pkd2 results in polycystic kidney disease. Cell 93, 177–188 (1998). - PubMed
    1. Leonhard WN, Happe H & Peters DJ Variable cyst development in autosomal dominant polycystic kidney disease: the biologic context. J. Am. Soc. Nephrol. 27, 3530–3538 (2016). - PMC - PubMed
    1. Piontek K, Menezes LF, Garcia-Gonzalez MA, Huso DL & Germino GG A critical developmental switch defines the kinetics of kidney cyst formation after loss of Pkd1. Nat. Med. 13, 1490–1495 (2007). - PMC - PubMed

Publication types