. 2021 Dec;27(23):6025-6058.
doi: 10.1111/gcb.15873. Epub 2021 Oct 11.

Land-based measures to mitigate climate change: Potential and feasibility by country

Affiliations

Land-based measures to mitigate climate change: Potential and feasibility by country

Stephanie Roe et al. Glob Chang Biol. 2021 Dec.

Abstract

Land-based climate mitigation measures have gained significant attention and importance in public and private sector climate policies. Building on previous studies, we refine and update the mitigation potentials for 20 land-based measures in >200 countries and five regions, comparing "bottom-up" sectoral estimates with integrated assessment models (IAMs). We also assess implementation feasibility at the country level. Cost-effective (available up to $100/tCO2 eq) land-based mitigation is 8-13.8 GtCO2 eq yr-1 between 2020 and 2050, with the bottom end of this range representing the IAM median and the upper end representing the sectoral estimate. The cost-effective sectoral estimate is about 40% of available technical potential and is in line with achieving a 1.5°C pathway in 2050. Compared to technical potentials, cost-effective estimates represent a more realistic and actionable target for policy. The cost-effective potential is approximately 50% from forests and other ecosystems, 35% from agriculture, and 15% from demand-side measures. The potential varies sixfold across the five regions assessed (0.75-4.8 GtCO2eq yr-1 ) and the top 15 countries account for about 60% of the global potential. Protection of forests and other ecosystems and demand-side measures present particularly high mitigation efficiency, high provision of co-benefits, and relatively lower costs. The feasibility assessment suggests that governance, economic investment, and socio-cultural conditions influence the likelihood that land-based mitigation potentials are realized. A substantial portion of potential (80%) is in developing countries and LDCs, where feasibility barriers are of greatest concern. Assisting countries to overcome barriers may result in significant quantities of near-term, low-cost mitigation while locally achieving important climate adaptation and development benefits. Opportunities among countries vary widely depending on types of land-based measures available, their potential co-benefits and risks, and their feasibility. Enhanced investments and country-specific plans that accommodate this complexity are urgently needed to realize the large global potential from improved land stewardship.

Keywords: AFOLU; co-benefits; demand management; feasibility; land management; land sector; mitigation; natural climate solutions; nature-based solutions.


Figures

FIGURE 1
FIGURE 1
Method and comparison of mitigation potentials using two approaches: Sectoral and IAM. The sectoral approach aggregates 10 studies and 25 datasets, each with a technical and cost‐effective (possible up to $100/tCO2eq) potential estimate for 1 of 20 land‐based mitigation measures in >200 countries. The mitigation potentials are averaged over the next 30 years (2020–2050). Data with * represent those that were adapted from their original source, and thus represent new country‐level data. Mean and min‐max range values were used for the five mitigation measures with more than one data source. BECCS and Clean cookstoves are excluded from the aggregate potential to avoid double counting. Demand‐side measures with ** exclude emissions from land‐use change to avoid double counting. Substitution options to calculate total potentials are indicated by symbols. The descriptions and methodologies for each measure are detailed in Table 1. The IAM approach estimates economic mitigation potential in 2050, up to $100/tCO2eq in our assessment to compare to the sectoral data. The intermodel median and min‐max range is reported for seven land sector measures from six IAM models and 131 scenario runs in the ENGAGE (Riahi et al., 2021) database. Each IAM measure is described in Section 2.1.2. The flow sizes are illustrative and do not reflect relative mitigation potential sizes; however, the size of the aggregated technical and cost‐effective boxes represent the data. [Correction added on 19 October 2021, after first online publication: Figure 1 has been modified.]
FIGURE 2
FIGURE 2
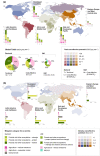
Regional land‐based mitigation potentials. (a) Country‐level map of total cost‐effective ($100/tCO2eq) mitigation potential (taking the average potentials for measures with more than one dataset). The five colors on the map correspond to the five IPCC regions assessed in our study. Bar charts show the share of mean technical, cost‐effective, and integrated assessments model (IAM) mitigation by mitigation category, aggregated into the five IPCC regions. Pie charts illustrate global total potentials and share of mitigation potential by mitigation category for sectoral and IAM approaches. Sectoral aggregate potentials exclude BECCS and clean cookstoves to avoid double counting. (b) Country‐level map of cost‐effective mitigation potential density (potential per hectare in 2020–2050). Bar charts show the regional mitigation density by category (cumulative potential divided by total land area per measure per region) for 2020 to 2050. “Protect” measures in Developed Countries show high density due to the very small land area associated with high potential from peatland protection
FIGURE 3
FIGURE 3
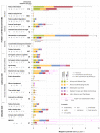
Climate mitigation potentials for 20 land‐based measures in 2020–2050, by region. Technical and cost‐effective ($100/tCO2eq) mitigation potentials are provided for each measure using a sectoral approach according to Table 1 and Figure 1. The 20 measures are grouped into four systems‐level mitigation categories, and seven management‐level categories. For measures with more than one dataset, the bar graph represents the mean estimate, and the error bars represent the min and max potential range. Global mitigation potentials of substituting fossil fuels were estimated for BECCS, biochar, and manure management, shown in pink outline bars, illustrating the median and 90th percentile values. IAM estimates (range and median, up to $100/tCO2eq) are provided for the seven measures where data are available in the ENGAGE database (Riahi et al., 2021). Potential co‐benefits are indicated with icons, and the average global mitigation “density” (cumulative mitigation potential divided by total hectares in 2020–2050) is noted for measures with available data
FIGURE 4
FIGURE 4
Country feasibility and cost‐effective mitigation potential as a share of total emissions. (a) Boxplot of feasibility scores by region (b) Feasibility score (0–100) by total cost‐effective mitigation potential as percent of total country emissions. Circles show relative size of total cost‐effective potential in GtCO2eq yr−1. The vertical dashed lines represent the interquartile range and median feasibility scores, and the horizontal lines represent the share of cost‐effective mitigation potential that land‐based measures can deliver over 30% (in line with global 1.5℃ trajectory) and over 100% (can achieve net zero emissions or negative emissions with land‐based measures only). Countries are grouped and numbered into 1–9 categories (except for 5 and 8 to improve data visibility), according to their relative mitigation potential as a share of total emissions and feasibility score. In six countries, the proportion of cost‐effective potential relative to total emissions is higher than the y‐axis of 250%: Papua New Guinea, Republic of Congo, Cameroon, Guyana, Suriname, and Rwanda; these can be seen in Figures 5, 6, 7, 8, 9
FIGURE 5
FIGURE 5
Africa and Middle East (AME) land‐based mitigation potentials and feasibility. (a) Total cost‐effective mitigation potential by mitigation category (colored bars) and mitigation density of cost‐effective potentials (gray bars), by country; (b) Total cost‐effective mitigation potential by mitigation category and measure in AME; c) Feasibility score by cost‐effective mitigation potential as a share of total country GHG emissions (%) in AME
FIGURE 6
FIGURE 6
Asia & Developing Pacific (ADP) land‐based mitigation potentials and feasibility. (a) Total cost‐effective mitigation potential by mitigation category (colored bars) and mitigation density of cost‐effective potentials (gray bars), by country; (b) Total cost‐effective mitigation potential by mitigation category and measure in ADP; (c) Feasibility score by cost‐effective mitigation potential as a share of total country GHG emissions (%) in ADP
FIGURE 7
FIGURE 7
Developed countries (DC) land‐based mitigation potentials and feasibility. (a) Total cost‐effective mitigation potential by mitigation category (colored bars) and mitigation density of cost‐effective potentials (gray bars), by country. EU27 represents the 27 European Union countries as of 2021; (b) Total cost‐effective mitigation potential by mitigation category and measure in DC; (c) Feasibility score by cost‐effective mitigation potential as a share of total country GHG emissions (%) in DC
FIGURE 8
FIGURE 8
Eastern Europe and West‐Central Asia (EEWA) land‐based mitigation potentials and feasibility. (a) Total cost‐effective mitigation potential by mitigation category (colored bars) and mitigation density of cost‐effective potentials (gray bars), by country; (b) Total cost‐effective mitigation potential by mitigation category and measure in EEWA; (c) Feasibility score by cost‐effective mitigation potential as a share of total country GHG emissions (%) in EEWA
FIGURE 9
FIGURE 9
Latin America & Caribbean (LAC) land‐based mitigation potentials and feasibility. (a) Total cost‐effective mitigation potential by mitigation category (colored bars) and mitigation density of cost‐effective potentials (gray bars), by country; (b) Total cost‐effective mitigation potential by mitigation category and measure in LAC; (c) Feasibility score by cost‐effective mitigation potential as a share of total country GHG emissions (%) in LAC

References

    1. Ahenkan, A. (2019). Financing climate change mitigation: An assessment of the private sector investment opportunities in Ghana. Business Strategy and Development, 3(1), 143–150. 10.1002/bsd2.84 - DOI
    1. Austin, K. G. , Baker, J. S. , Sohngen, B. L. , Wade, C. M. , Daigneault, A. , Ohrel, S. B. , Ragnauth, S. , & Bean, A. (2020). The economic costs of planting, preserving, and managing the world’s forests to mitigate climate change. Nature Communications, 11(1), 5946. 10.1038/s41467-020-19578-z - DOI - PMC - PubMed
    1. Bailis, R. , Drigo, R. , Ghilardi, A. , & Masera, O. (2015). The carbon footprint of traditional woodfuels. Nature Climate Change, 5(3), 266–272. 10.1038/nclimate2491 - DOI
    1. Bajželj, B. , Richards, K. S. , Allwood, J. M. , Smith, P. , Dennis, J. S. , Curmi, E. , & Gilligan, C. A. (2014). Importance of food‐demand management for climate mitigation. Nature Climate Change, 4(10), 924–929. 10.1038/nclimate2353 - DOI
    1. Barlow, J. , Gardner, T. A. , Araujo, I. S. , Avila‐Pires, T. C. , Bonaldo, A. B. , Costa, J. E. , Esposito, M. C. , Ferreira, L. V. , Hawes, J. , Hernandez, M. I. M. , Hoogmoed, M. S. , Leite, R. N. , Lo‐Man‐Hung, N. F. , Malcolm, J. R. , Martins, M. B. , Mestre, L. A. M. , Miranda‐Santos, R. , Nunes‐Gutjahr, A. L. , Overal, W. L. , … Peres, C. A. (2007). Quantifying the biodiversity value of tropical primary, secondary, and plantation forests. Proceedings of the National Academy of Sciences, 104(47), 18555–18560. 10.1073/pnas.0703333104 - DOI - PMC - PubMed