. 2021 Nov 16;144(20):1612-1628.
doi: 10.1161/CIRCULATIONAHA.121.053960. Epub 2021 Oct 12.

Interferon-γ Impairs Human Coronary Artery Endothelial Glucose Metabolism by Tryptophan Catabolism and Activates Fatty Acid Oxidation

Affiliations

Interferon-γ Impairs Human Coronary Artery Endothelial Glucose Metabolism by Tryptophan Catabolism and Activates Fatty Acid Oxidation

Laurel Yong-Hwa Lee et al. Circulation. .

Abstract

Background: Endothelial cells depend on glycolysis for much of their energy production. Impaired endothelial glycolysis has been associated with various vascular pathobiologies, including impaired angiogenesis and atherogenesis. IFN-γ (interferon-γ)-producing CD4+ and CD8+ T lymphocytes have been identified as the predominant pathological cell subsets in human atherosclerotic plaques. Although the immunologic consequences of these cells have been extensively evaluated, their IFN-γ-mediated metabolic effects on endothelial cells remain unknown. The purpose of this study was to determine the metabolic consequences of the T-lymphocyte cytokine, IFN-γ, on human coronary artery endothelial cells.

Methods: The metabolic effects of IFN-γ on primary human coronary artery endothelial cells were assessed by unbiased transcriptomic and metabolomic analyses combined with real-time extracellular flux analyses and molecular mechanistic studies. Cellular phenotypic correlations were made by measuring altered endothelial intracellular cGMP content, wound-healing capacity, and adhesion molecule expression.

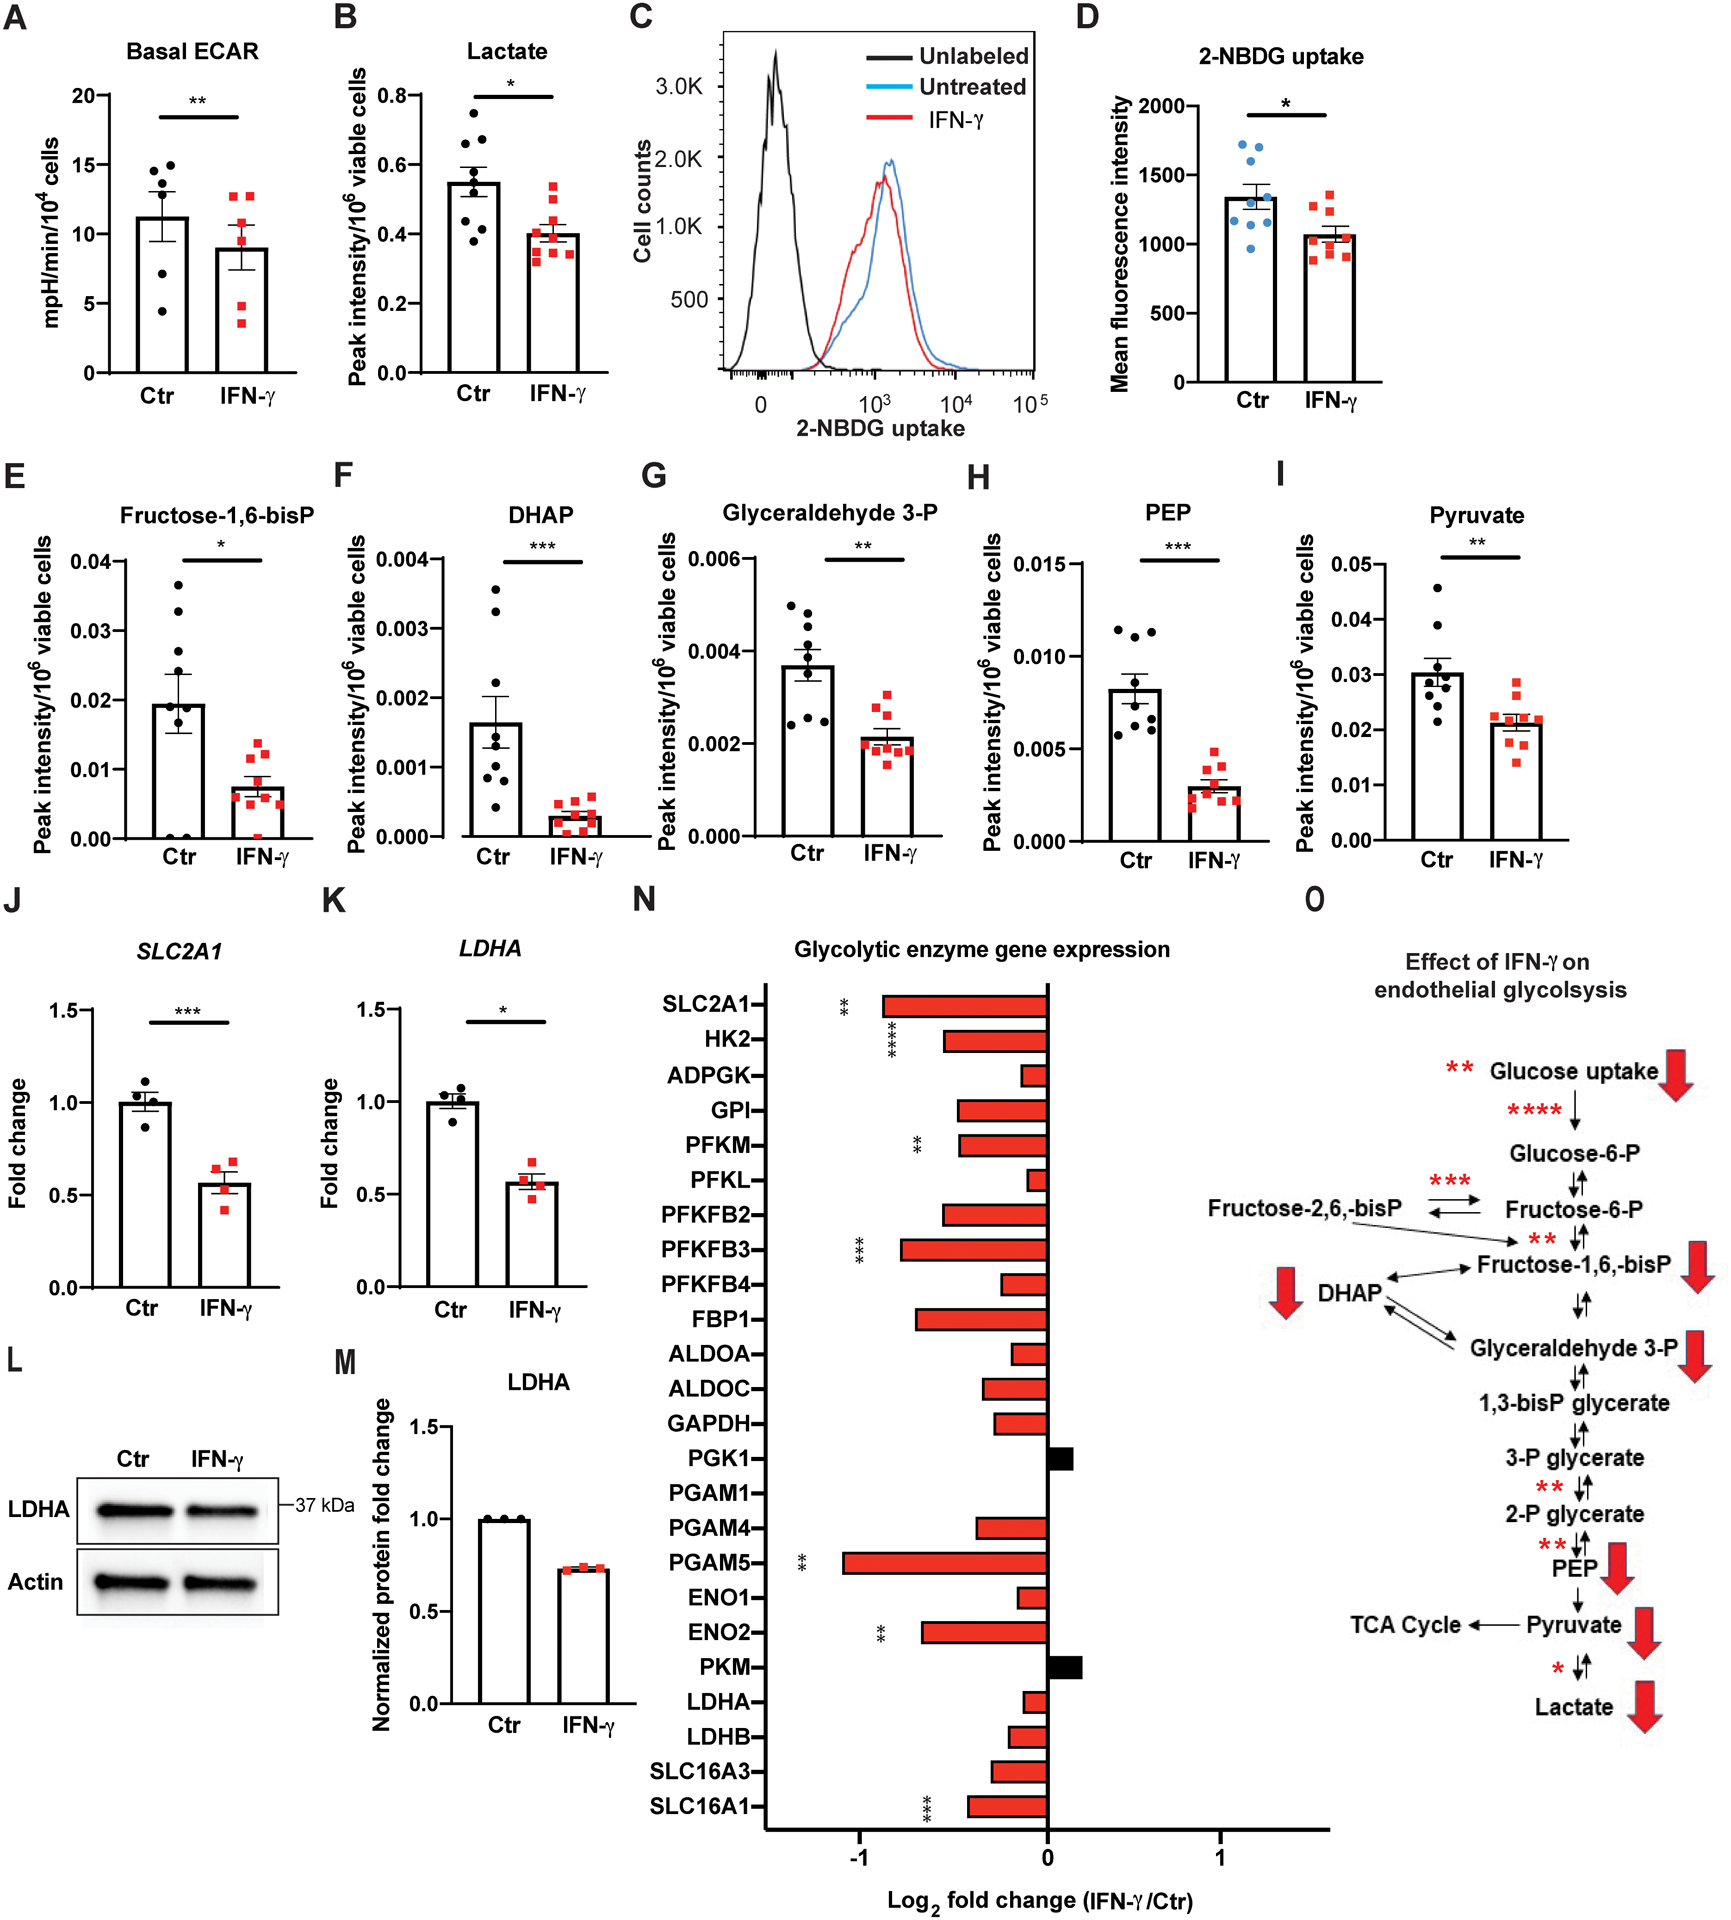
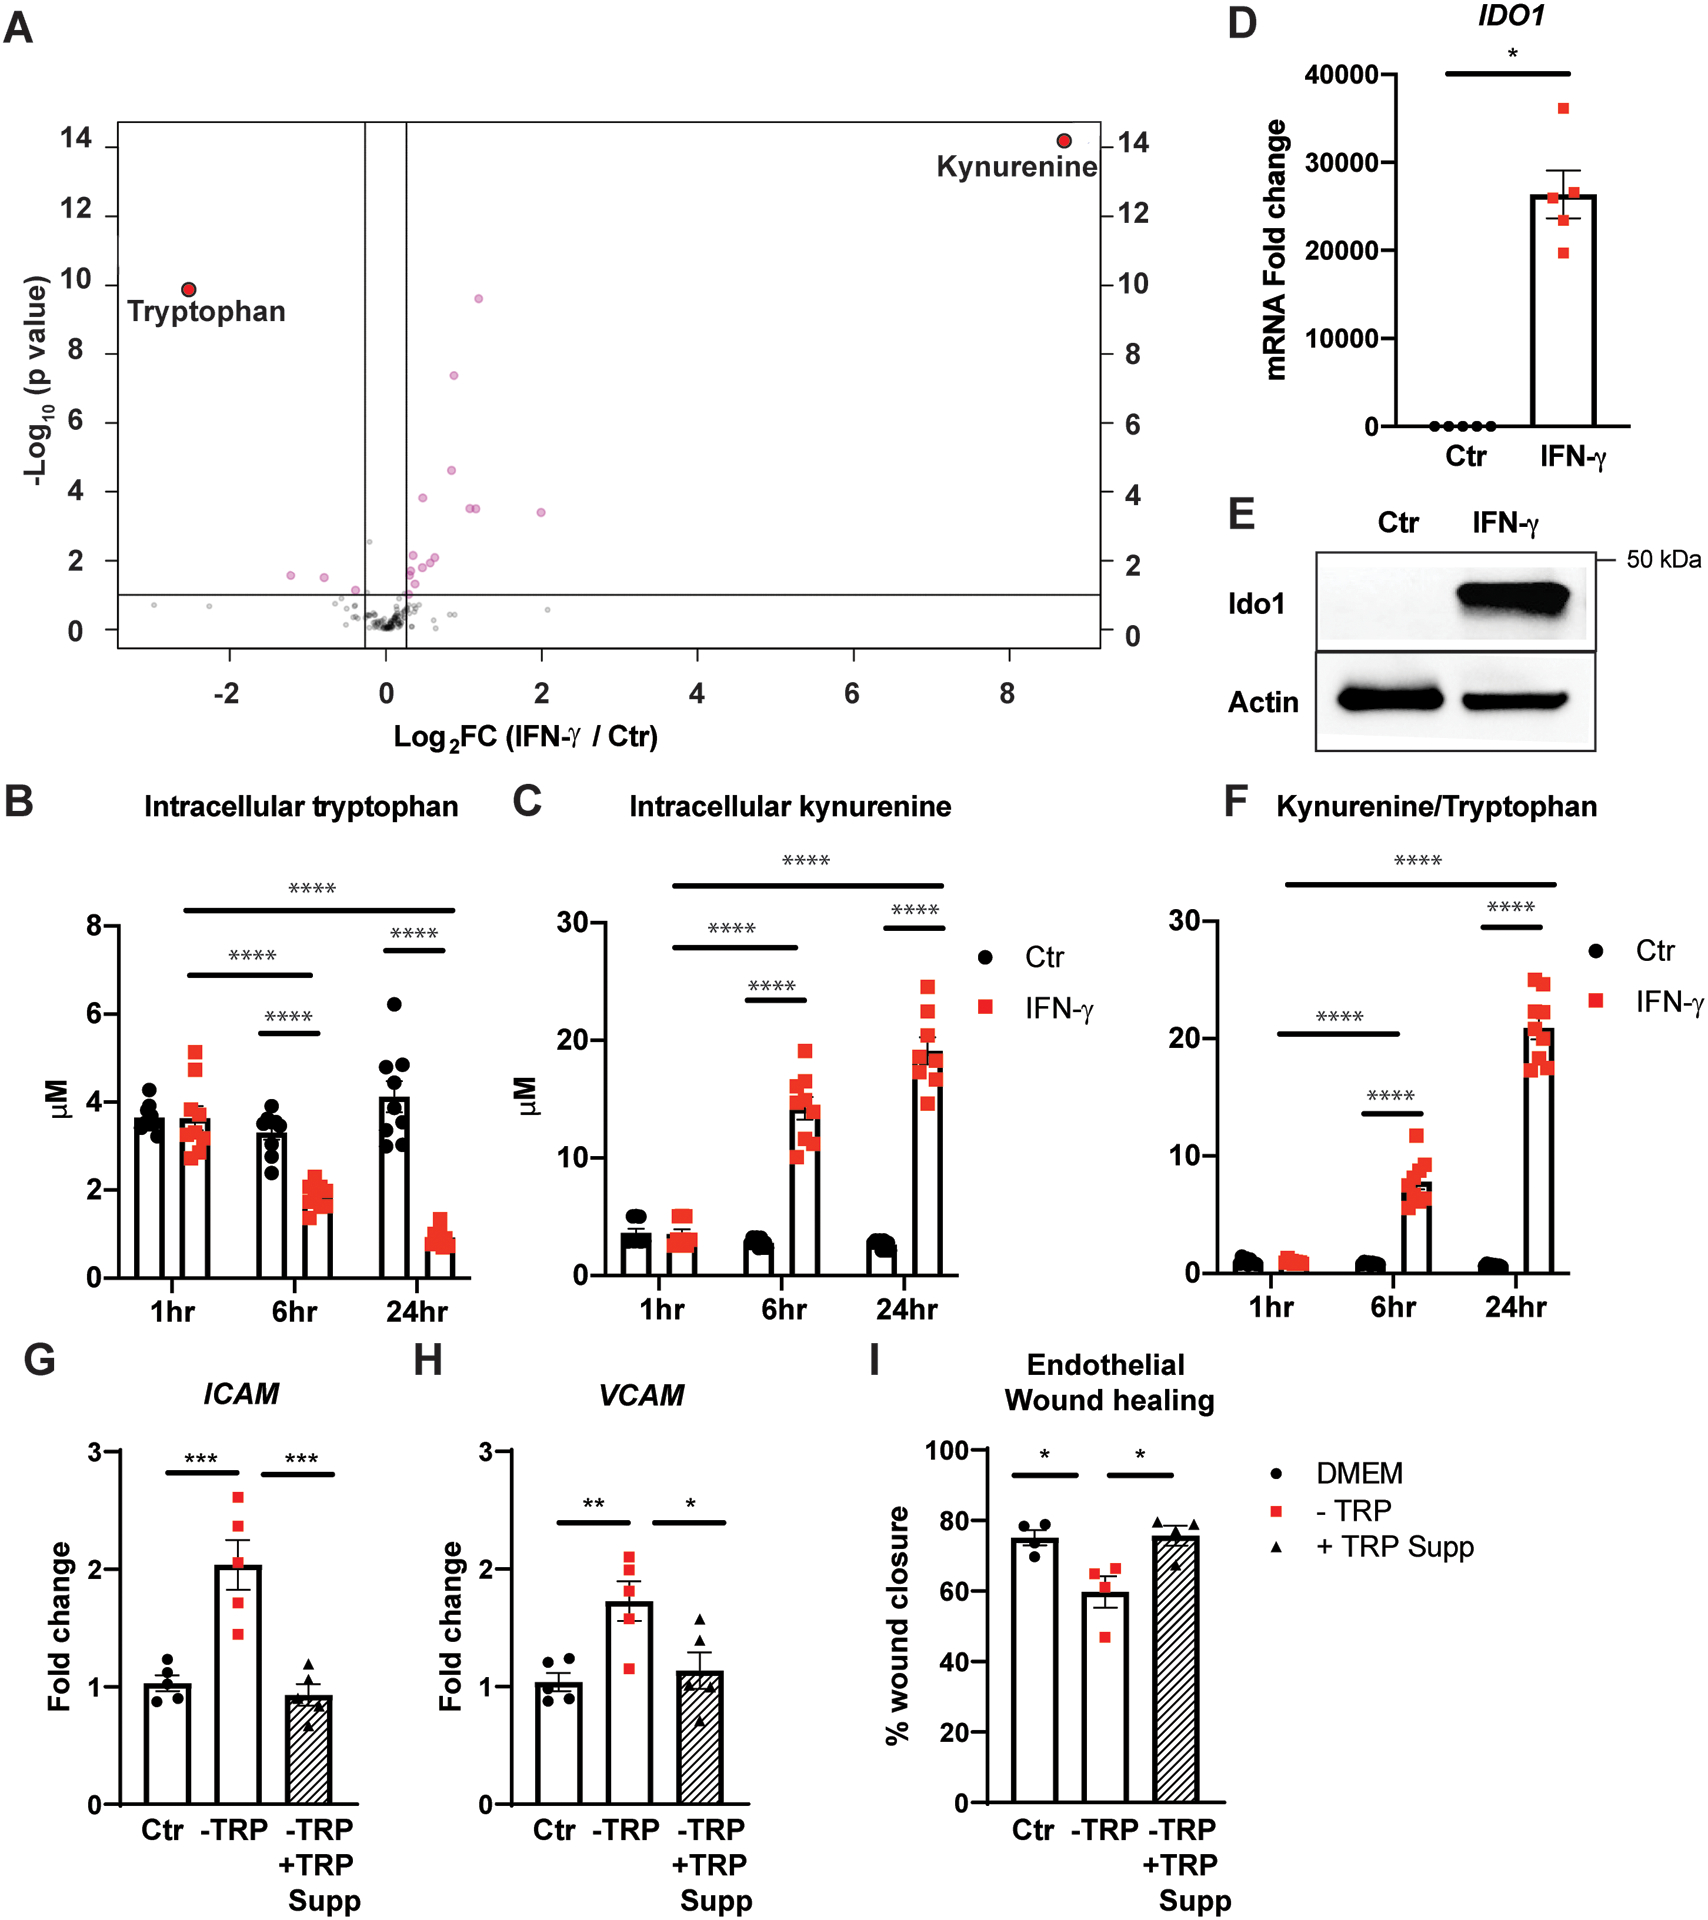
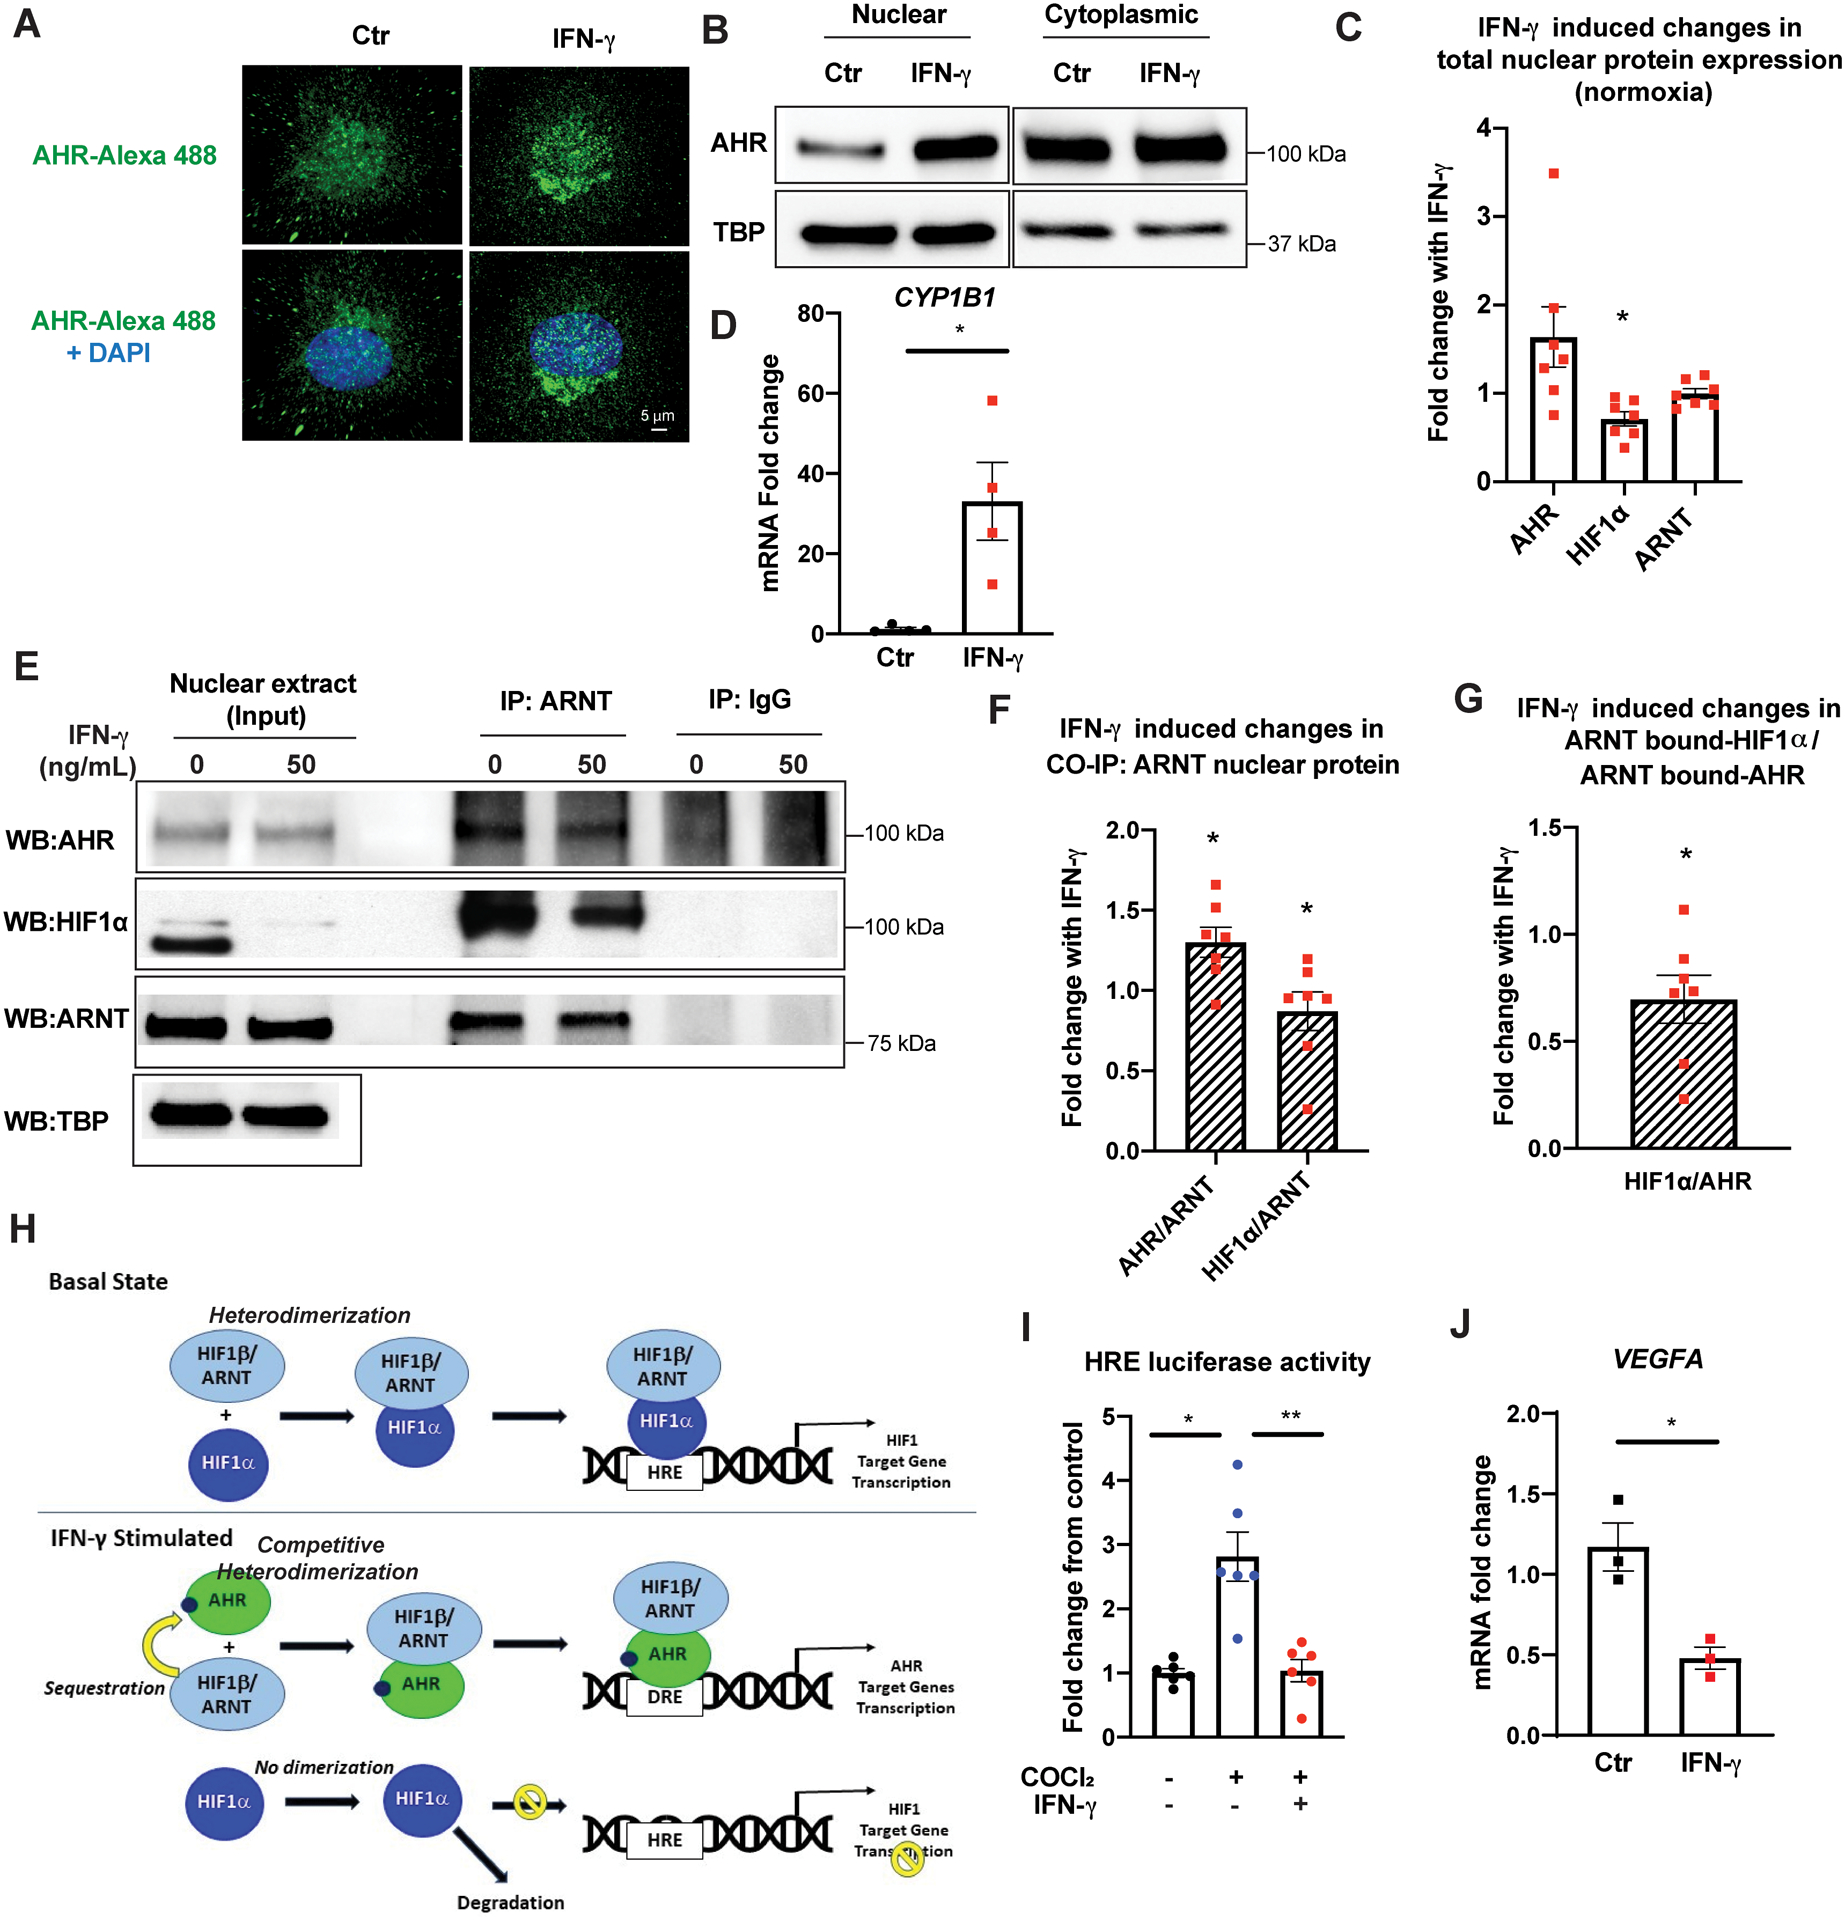
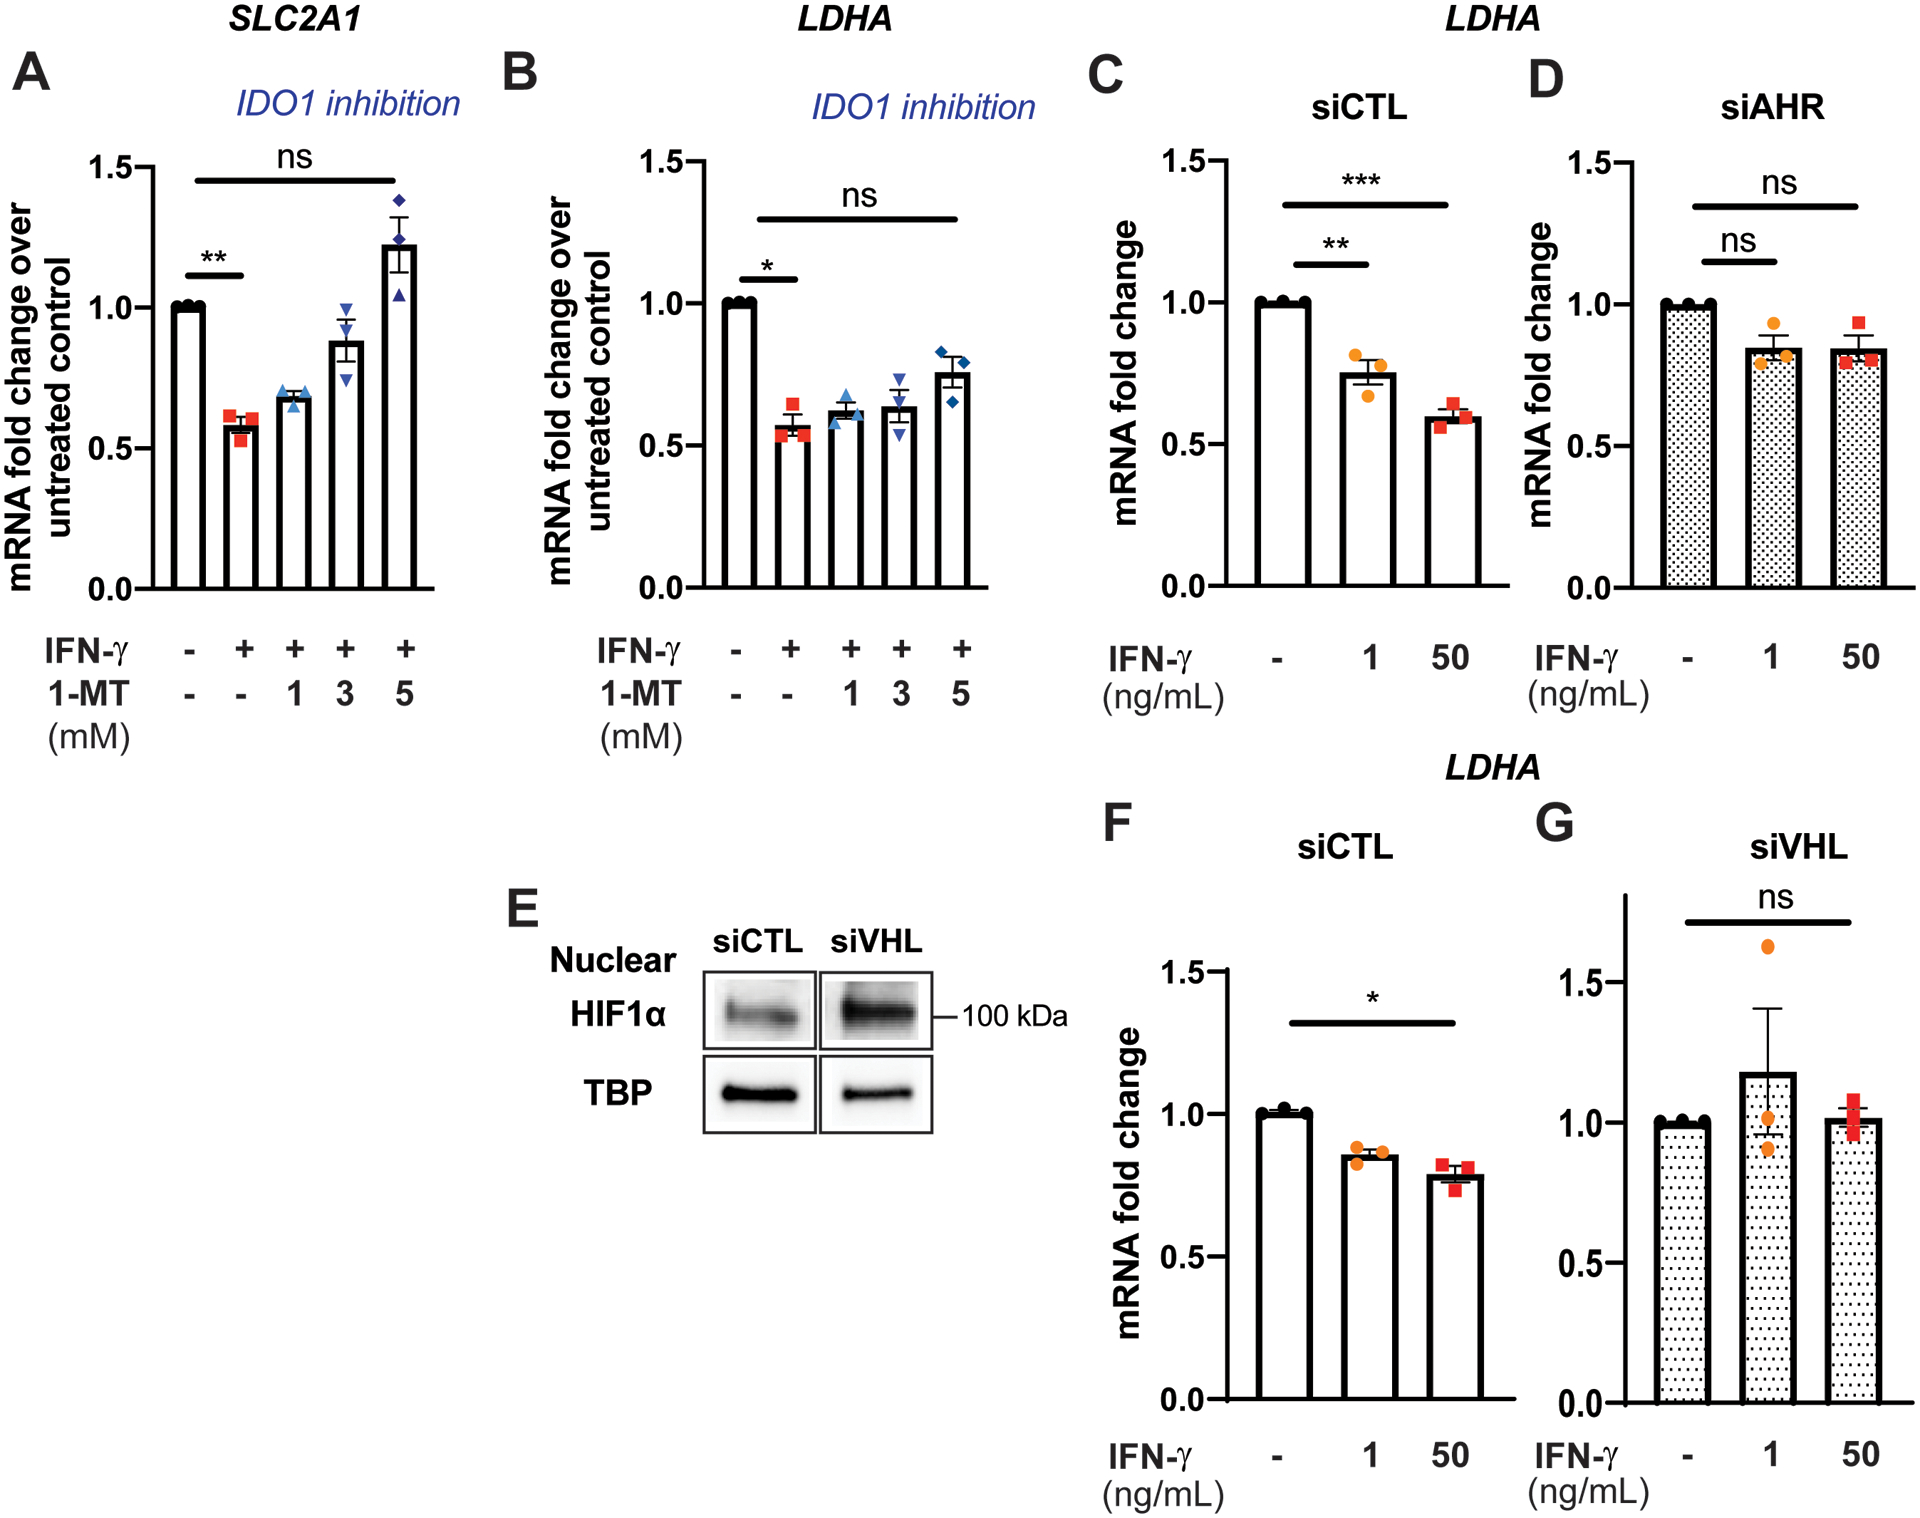
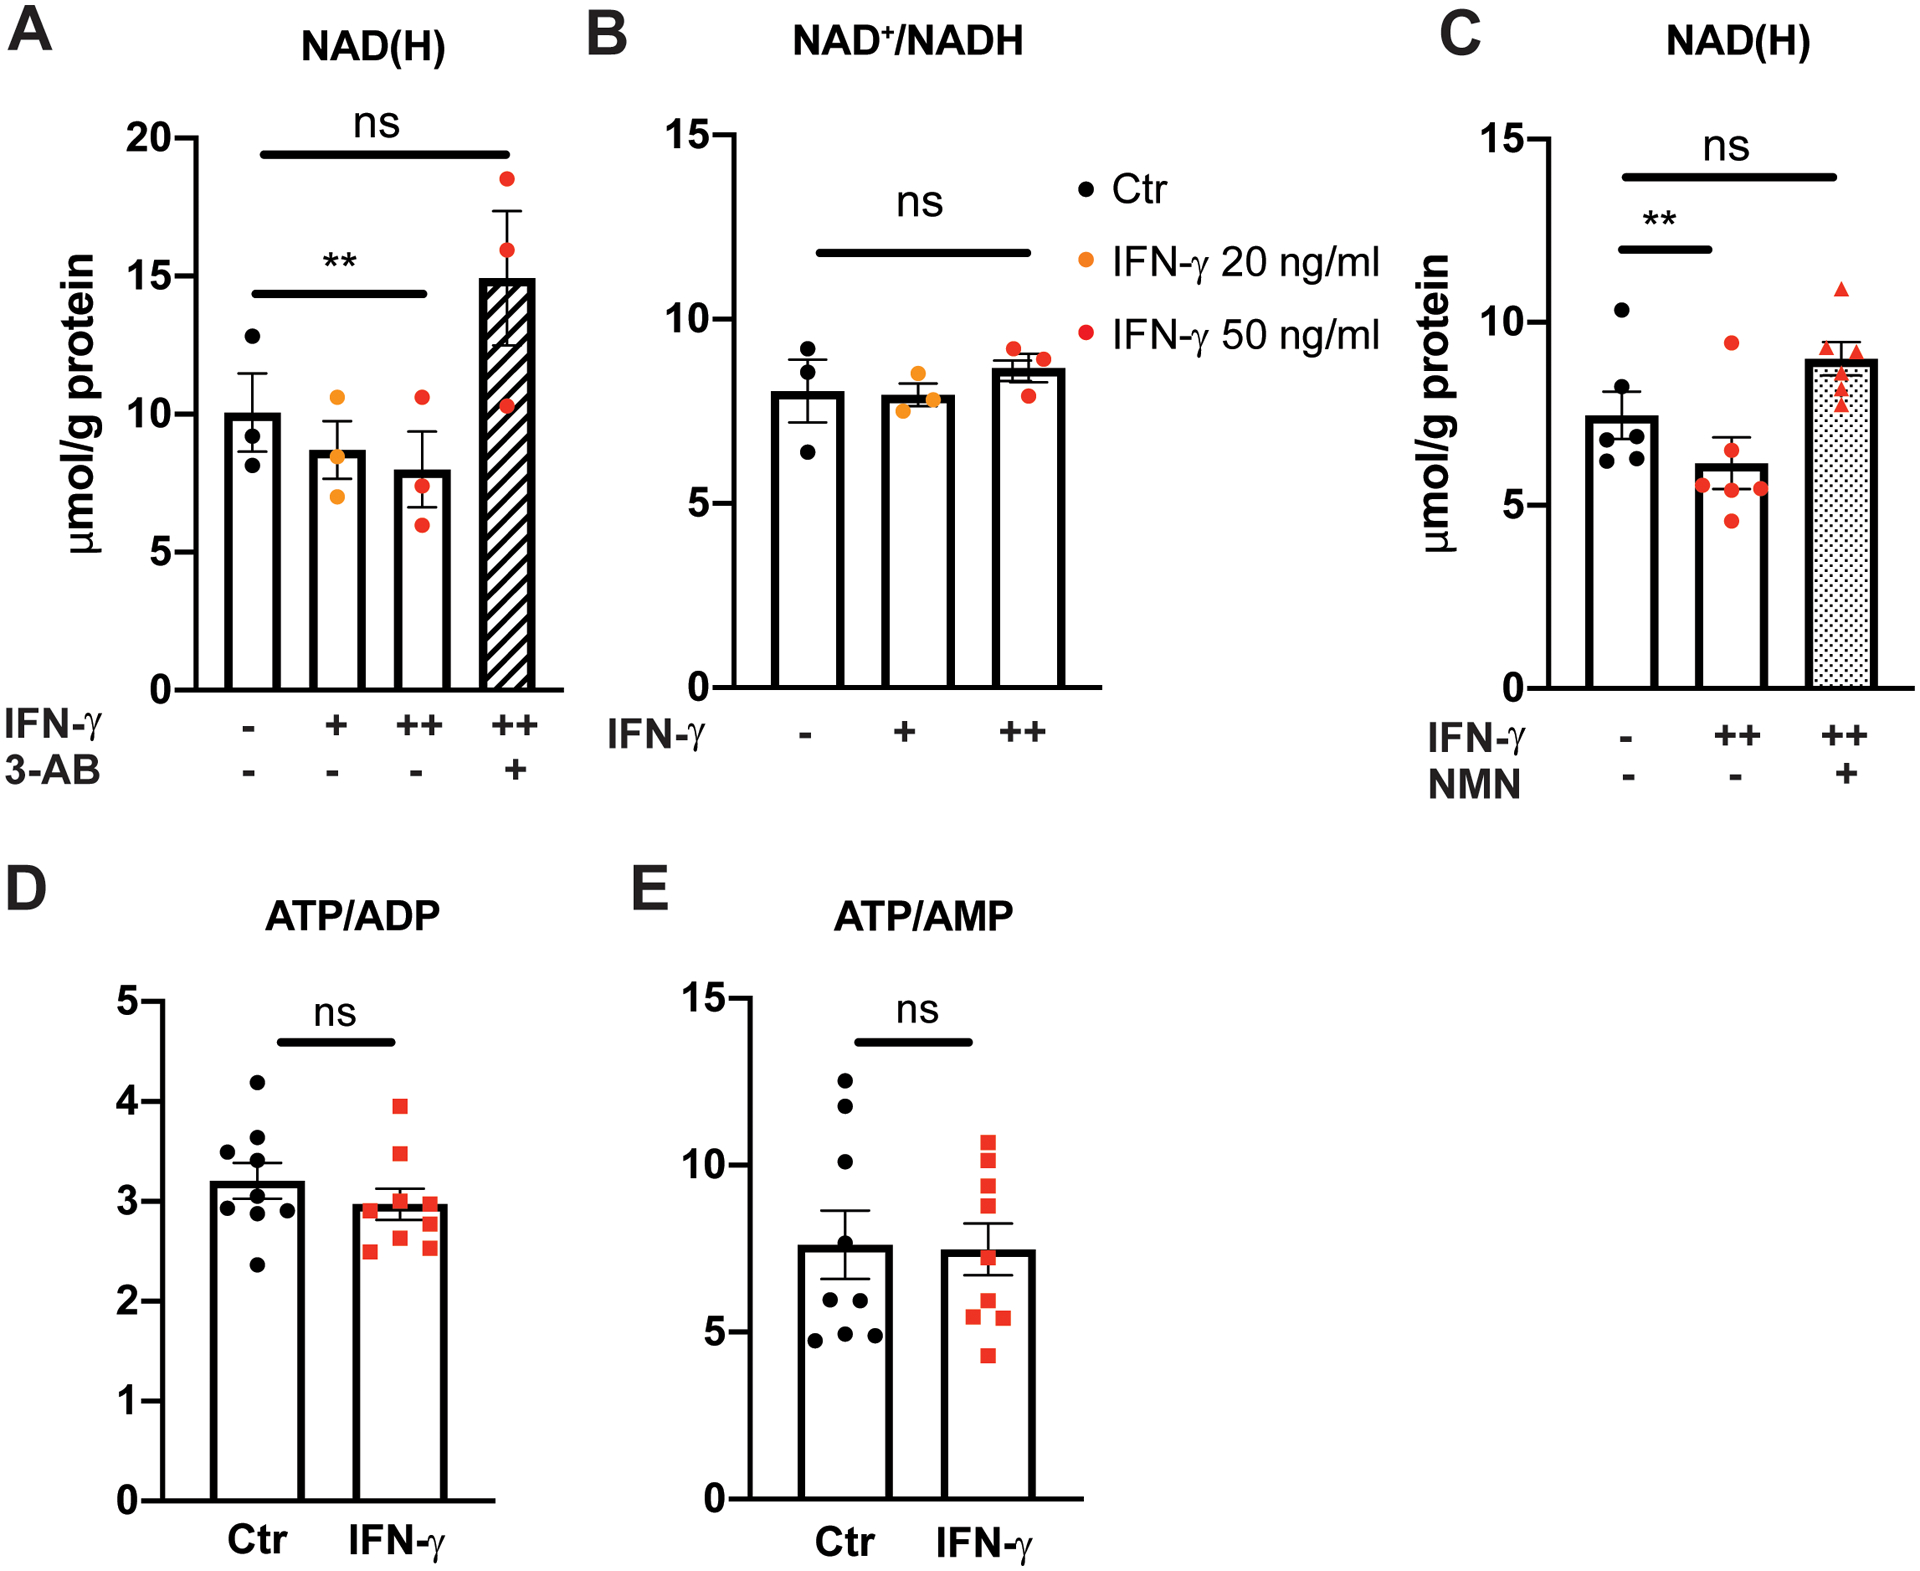
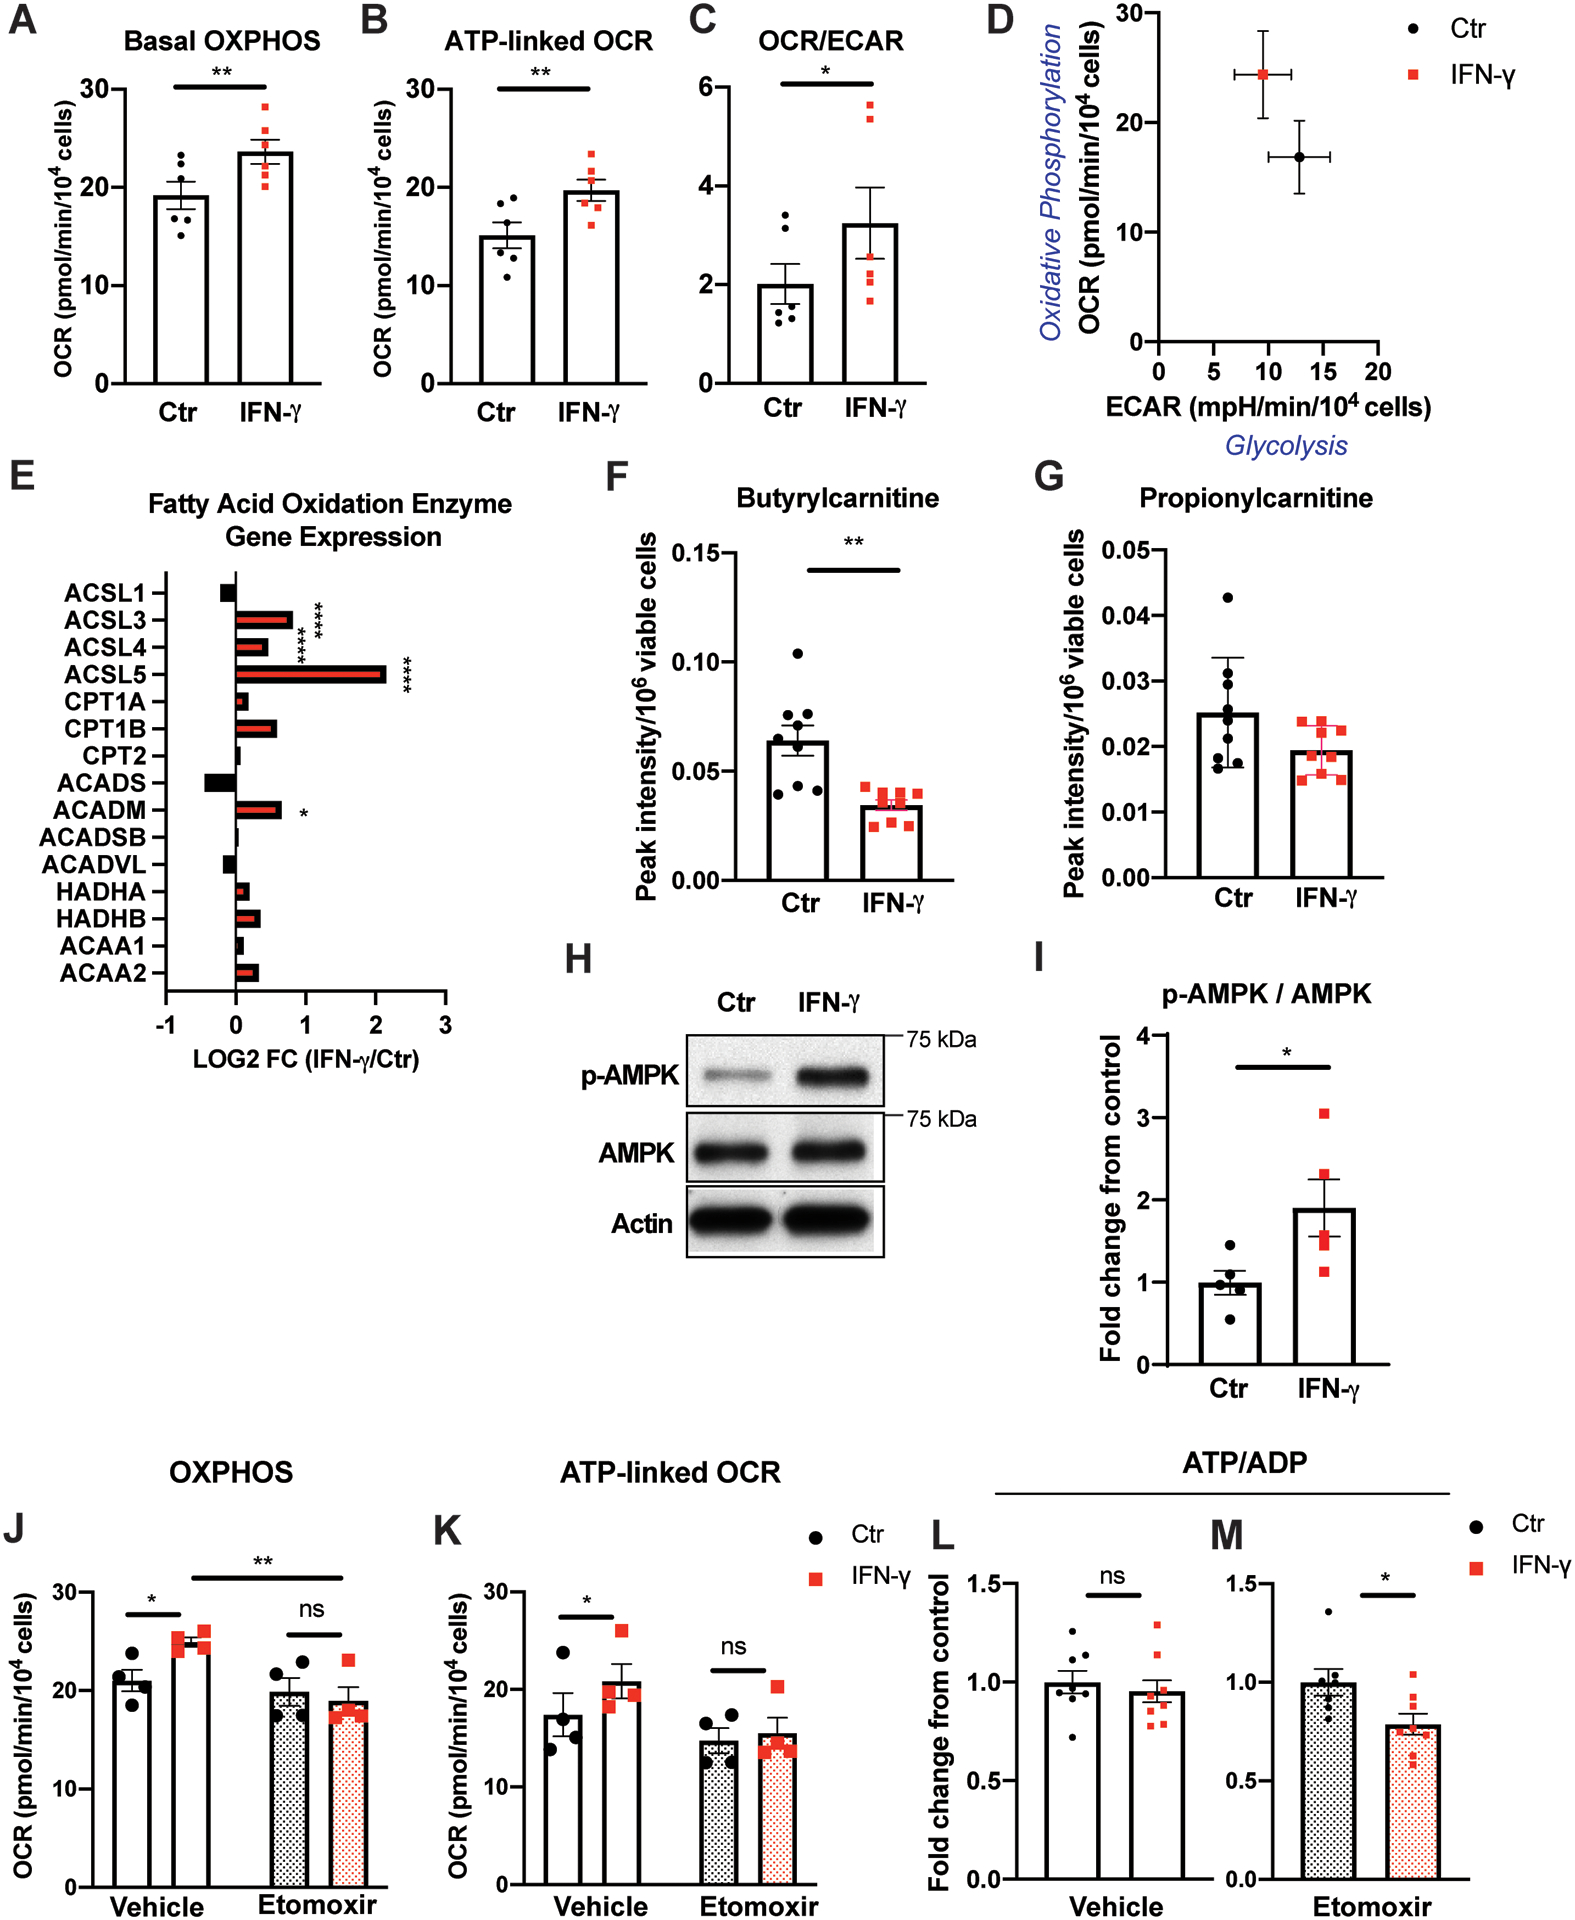
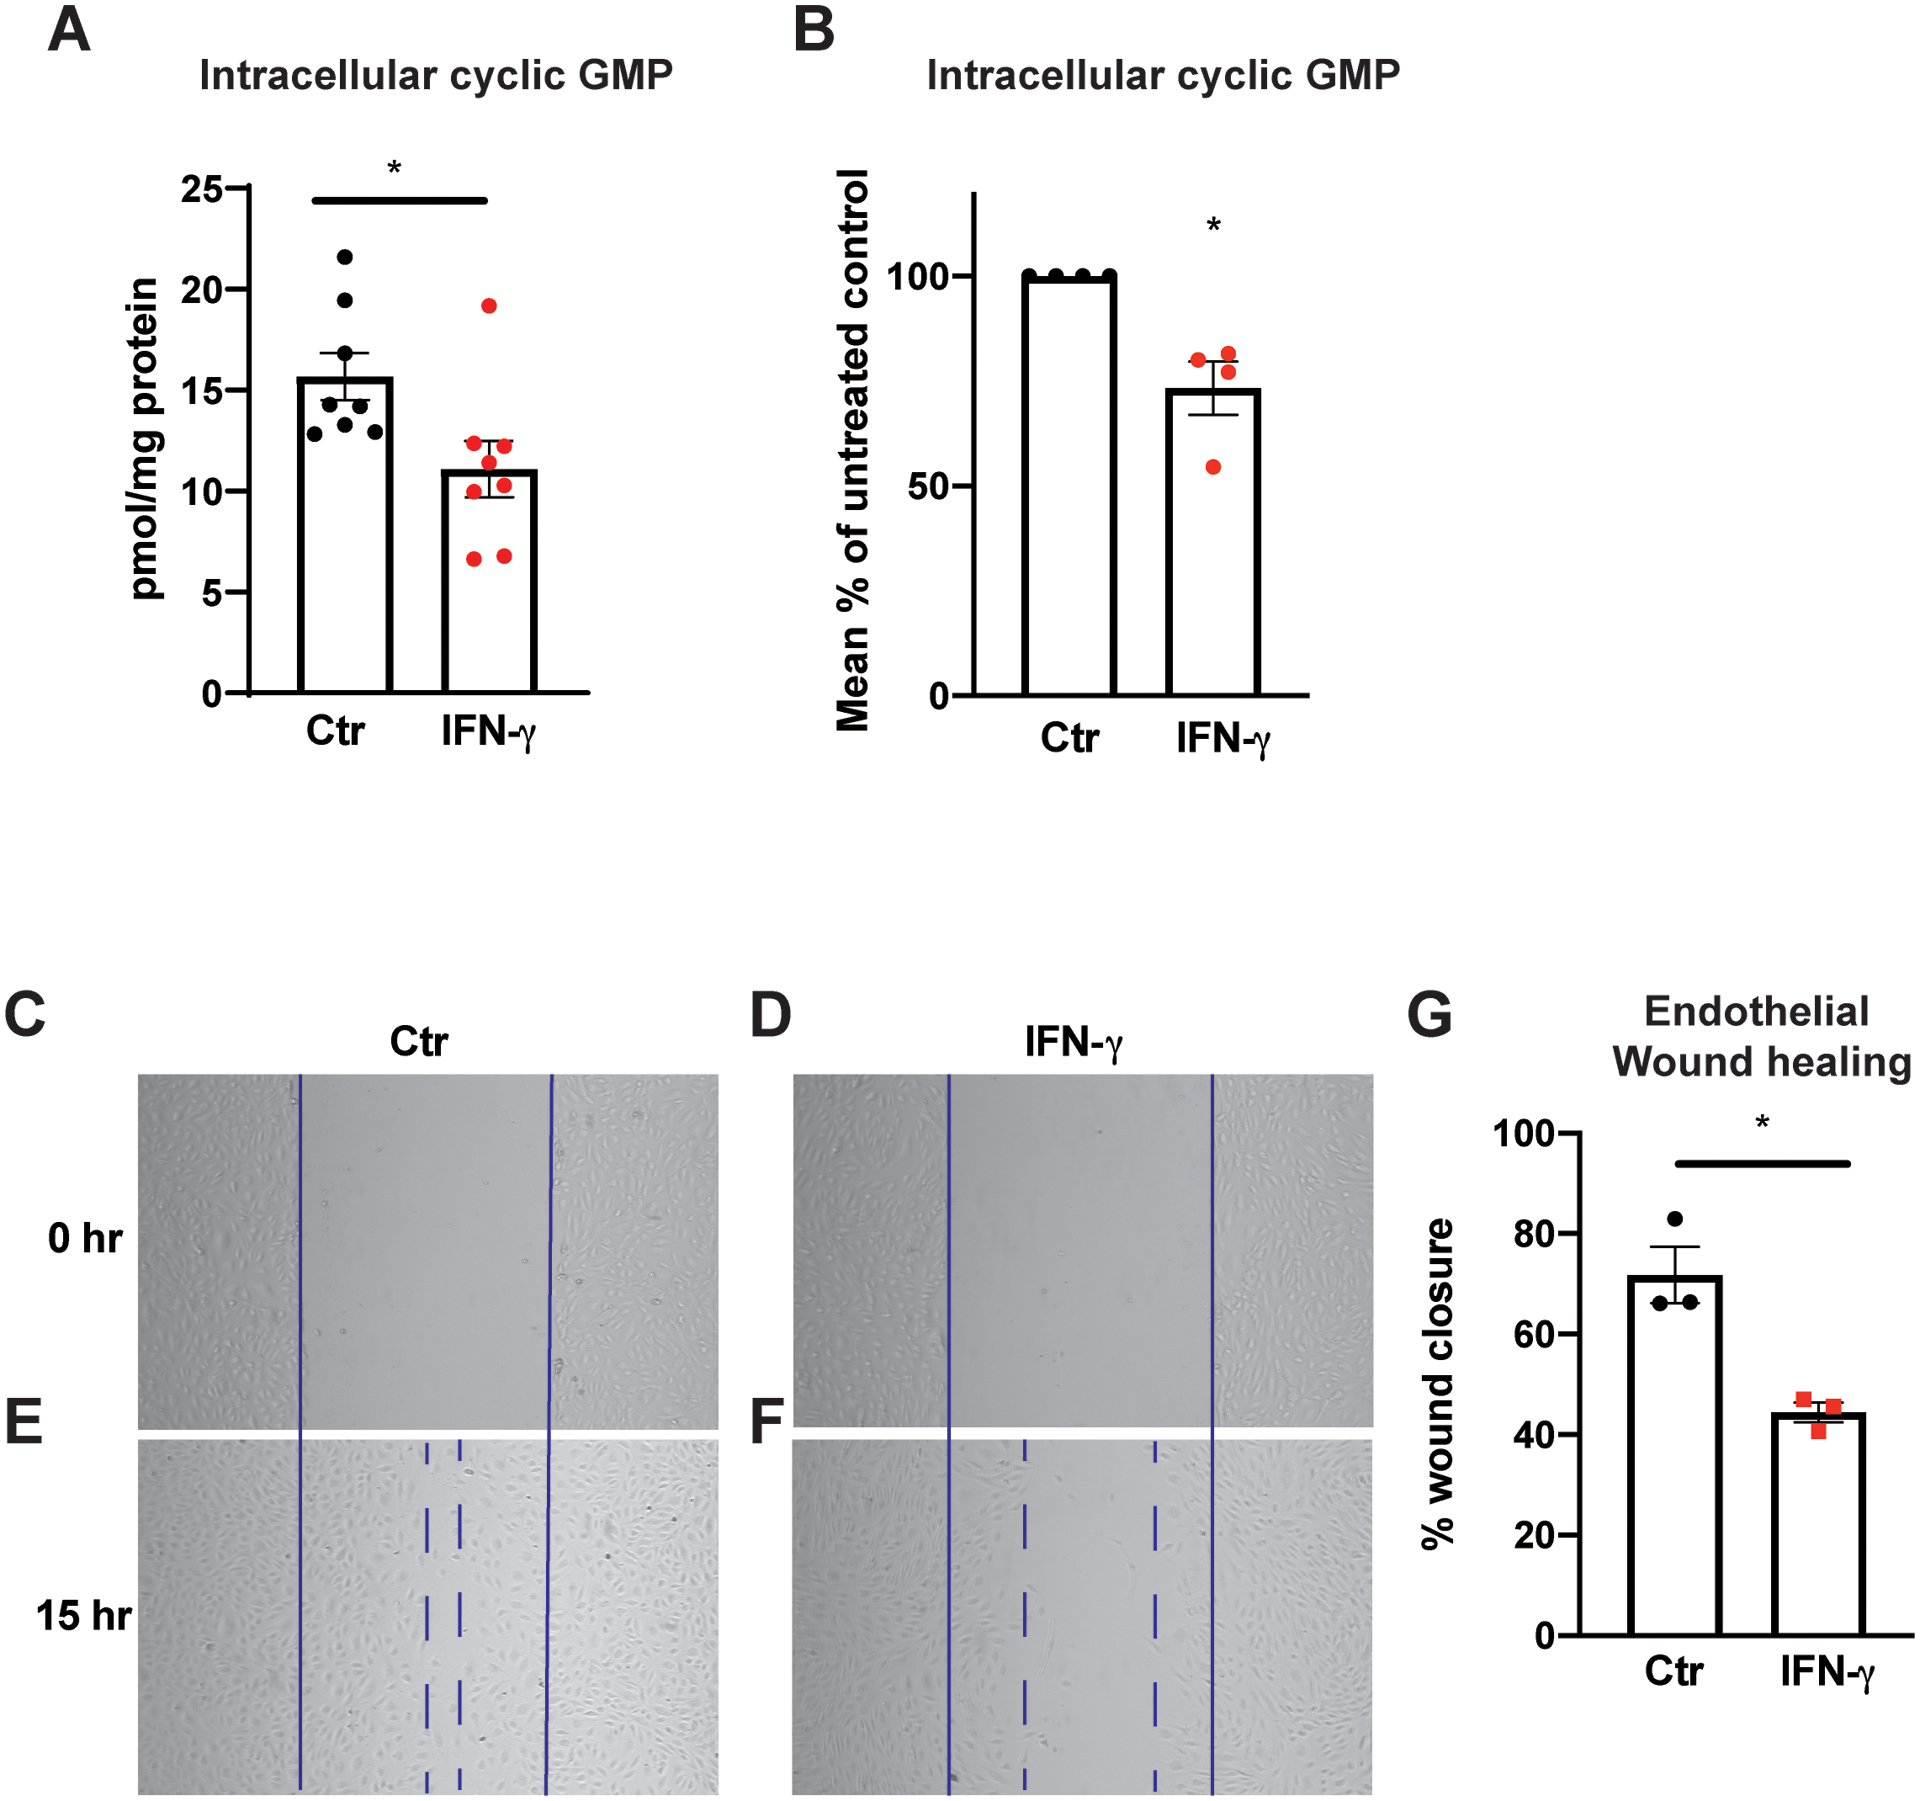
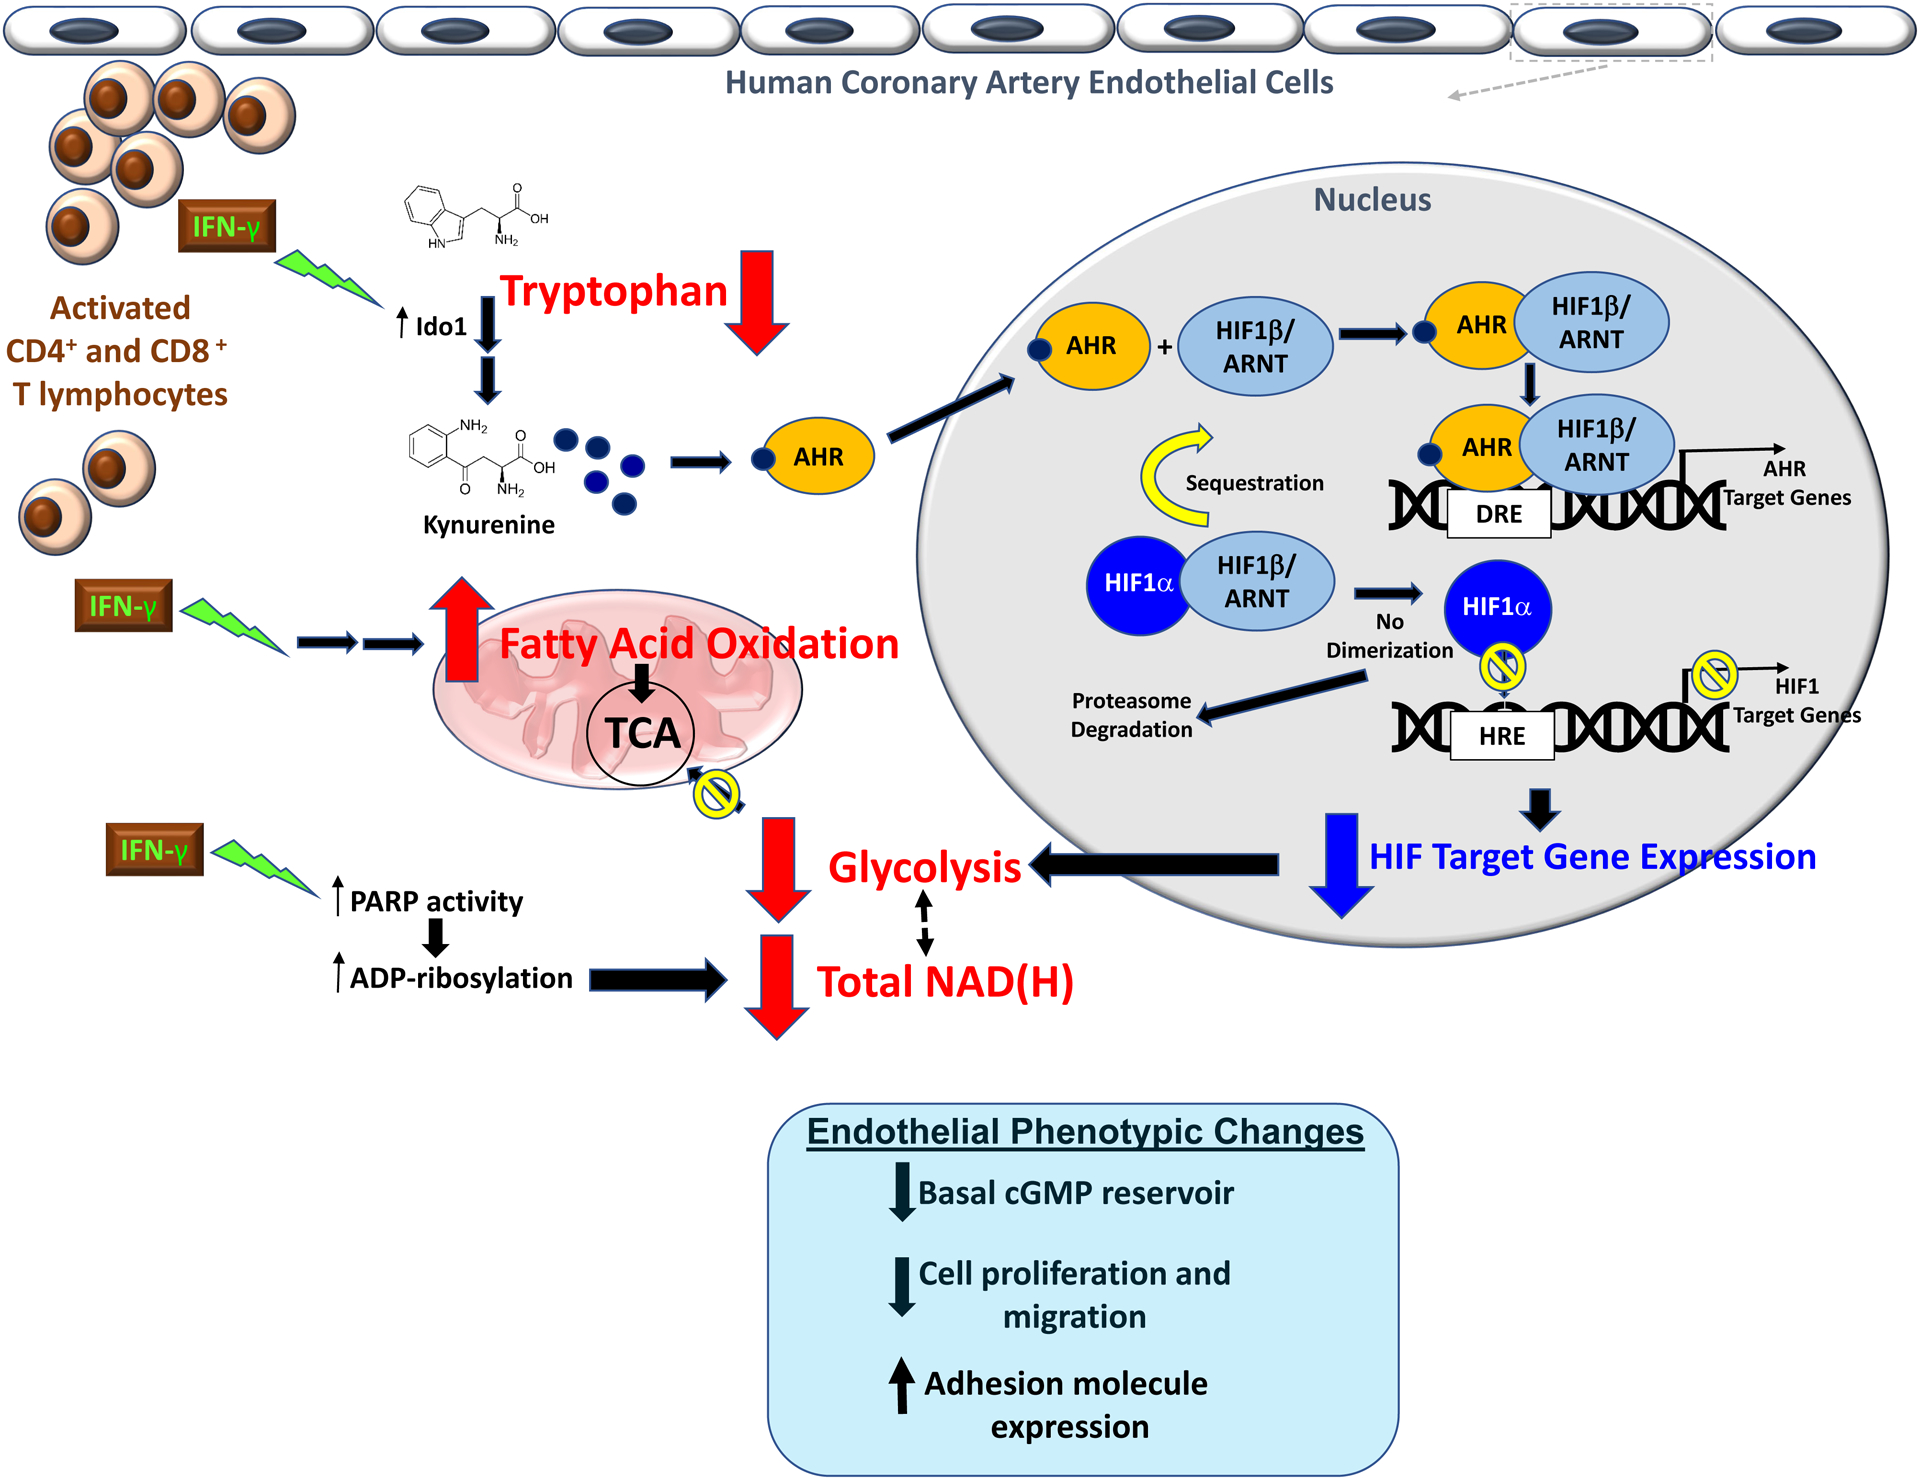
Results: IFN-γ exposure inhibited basal glycolysis of quiescent primary human coronary artery endothelial cells by 20% through the global transcriptional suppression of glycolytic enzymes resulting from decreased basal HIF1α (hypoxia-inducible factor 1α) nuclear availability in normoxia. The decrease in HIF1α activity was a consequence of IFN-γ-induced tryptophan catabolism resulting in ARNT (aryl hydrocarbon receptor nuclear translocator)/HIF1β sequestration by the kynurenine-activated AHR (aryl hydrocarbon receptor). In addition, IFN-γ resulted in a 23% depletion of intracellular nicotinamide adenine dinucleotide in human coronary artery endothelial cells. This altered glucose metabolism was met with concomitant activation of fatty acid oxidation, which augmented its contribution to intracellular ATP balance by >20%. These metabolic derangements were associated with adverse endothelial phenotypic changes, including decreased basal intracellular cGMP, impaired endothelial migration, and a switch to a proinflammatory state.

Conclusions: IFN-γ impairs endothelial glucose metabolism by altered tryptophan catabolism destabilizing HIF1, depletes nicotinamide adenine dinucleotide, and results in a metabolic shift toward increased fatty acid oxidation. This work suggests a novel mechanistic basis for pathological T lymphocyte-endothelial interactions in atherosclerosis mediated by IFN-γ, linking endothelial glucose, tryptophan, and fatty acid metabolism with the nicotinamide adenine dinucleotide balance and ATP generation and their adverse endothelial functional consequences.

Keywords: coronary artery; endothelium; fatty acid oxidation; glycolysis; interferon-γ; metabolism; tryptophan.


Figures

Figure 1.
Figure 1.. IFN-γ impairs basal glucose metabolism in HCAEC via global transcriptional suppression of glycolytic enzymes
A, Real time extracellular flux analysis of extracellular acidification rate (ECAR) of HCAEC following 24 h of IFN-γ treatment at 50 ng/ml. Data represent mean ± SEM from 6 independent experiments. B, Intracellular lactate levels in HCAEC measured by LC-MS following the same IFN-γ treatment. Mean ± SEM from 9 biological replicates from 3 independent experiments. C-D, Cellular uptake of the glucose analogue 2-NBDG by HCAEC assessed by flow cytometry following 48 h of IFN-γ treatment. Mean ± SEM from 9 biological replicates from 3 independent experiments. E-I, Intracellular metabolites of the glycolytic pathway in HCAEC measured by LC-MS following 24 h of IFN-γ treatment. Mean ± SEM from 9 biological replicates from 3 independent experiments. J-K, Gene expression changes of SLC2A1 (J) and LDHA (K) measured by real-time PCR in HCAEC following the same IFN-γ treatment. Mean ± SEM from 4 independent experiments. Statistical significance was assessed using paired (A) or unpaired (D) two-tailed Student’s t-tests, unpaired Welch’s t-tests (B, E, I-J), and Mann-Whitney U tests (F-H, K). L-M, Protein expression changes of LDHA by western blot in HCAEC following 24–48 h of IFN-γ (L) and densitometric quantification of 3 independent experiments (M). N, IFN-γ induced gene expression changes involving the glycolytic enzymes by RNASeq analysis of HCAEC obtained in biological triplicates. Statistical significance was determined based on the p-values adjusted for multiple test hypotheses by Benjamini-Hochberg procedure with a false discovery rate threshold of < 0.05. O, Summary of IFN-γ impairment of HCAEC glycolysis at the transcriptional (asterisks) and metabolite (red arrows) levels. Red arrows denote the significantly decreased intracellular metabolites measured by LC-MS while asterisks indicate the significantly decreased gene expressions of the enzymes involved in the reactions and the extents of the statistical significance. * p < 0.05, ** p < 0.01, *** p < 0.001, **** p < 0.0001 ADPGK: ADP dependent glucokinase, ALDO: Aldolase, DHAP: Dihydroxyacetone phosphate, ENO: Enolase, FBP1: Fructose-bisphosphatase 1, Fructose-1,6-bisP: Fructose-1,6,-bisphospate, Fructose-2,6-bisP: Fructose-2,6,-bisphospate, Fructose-6-P: Fructose-6-phosphate, GAPDH: Glyceraldehyde 3-phosphate dehydrogenase, GPI: Glucose-6-phosphate isomerase, Glucose-6-P: glucose-6-phosphate, Glyceraldehyde 3-P: glyceraldehyde 3-phosphate, HK: Hexokinase, IFN: Interferon, PFK: Phosphofructokinase, SLC2A1: Solute carrier family 2 Member 1, PEP: Phosphoenolpyruvate, PFKFB: 6-Phosphofructo-2-kinase/fructose-2,6-biphosphatase, PGAM: Phosphoglycerate mutase 1, PGK: Phosphoglycerate kinase, PKM: Pyruvate kinase M, LDH: Lactate dehydrogenase, SLC16A1: Solute carrier family 16A member 1 (encodes monocarboxylate transporter 1), and SLC16A3: Solute carrier family 16A member 3 (encodes monocarboxylate transporter 4), TCA: tricarboxylic acid, 1, 3-bisP glycerate: 1,3-bisphosphoglycerate, 2-NBDG: 2-(N-(7-nitrobenz-2-oxa-1,3-diazol-4-yl)amino)-2-deoxyglucose, 2-P glycerate: 2-phosphoglycerate, 3-P glycerate: 3-phosphoglycerate.
Figure 2.
Figure 2.. IFN-γ accelerates tryptophan degradation to kynurenine in HCAEC
A, Targeted LC-MS analysis of 144 common intracellular metabolites. Log2 of fold changes in intracellular metabolites extracted from HCAEC following 24 h of IFN-γ at 50 ng/mL are depicted on the x-axis with their p values on the y-axis. Mean from 3 independent experiments. B-C, Intracellular tryptophan (B) and kynurenine (C) in HCAEC measured by LC-MS following 1, 6, 24 h of IFN-γ treatment. Mean ± SEM from 9 biological replicates from 3 independent experiments. D, IDO1 mRNA expression fold change in HCAEC following the same IFN-γ treatment. Mean ± SEM from 3 independent experiments. E, IDO1 protein expression changes in HCAEC following the same IFN-γ treatment. Representative Western blot. F, Intracellular kynurenine/tryptophan ratio over time indicating increased indoleamine 2,3-dioxygenase 1 (IDO1) activity. Mean ± SEM from 9 biological replicates from 3 independent experiments. G-H, Adhesion molecules, ICAM (G) and VCAM (H), mRNA expression fold changes in HCAEC measured by real-time PCR following 24 h incubation in control Dulbecco’s Modified Eagle Medium (DMEM) (Ctrl) or DMEM deficient in tryptophan (TRP) (−TRP) with (black triangles with hatched bars) or without (red squares) TRP supplementation (−TRP + TRP Supp). Mean ± SEM from 3 independent experiments. I, Percentages of wound closure of monolayer re-endothelialization following 24 h incubation in the above medium calculated by the following formula = [(open area at 0 h) - (open area at 48 h)]/(open area at 0 h) × 100. Mean ± SEM from 4 independent experiments. Statistical significance was determined by two-way ANOVA with post hoc Tukey’s multiple comparisons test (B-C, F), Welch’s t-test (D), or one-way ANOVA with post hoc Bonferroni’s pairwise comparisons test (G-I). * p < 0.05, ** p < 0.01, *** < 0.001, **** p < 0.0001 ICAM: intercellular adhesion molecule; VCAM: vascular cell adhesion molecule.
Figure 3.
Figure 3.. IFN-γ results in AHR activation, nuclear translocation, dimerization with ARNT, and transcriptional activation of its target gene and concomitantly decreases total nuclear HIF1α in HCAEC
A, Confocal microscopy analysis of intracellular AHR (green: Alexa Flour 488) superimposed with DAPI nuclei as staining (blue) following 24 h of IFN-γ treatment at 50 ng/mL. Representative images. B, Protein expression of AHR in the nuclear and cytoplasmic extracts following IFN-γ treatment. Representative Western blots. C, IFN-γ-induced fold changes in total nuclear protein expression levels of AHR, HIF1α, and ARNT in HCAEC following 38 h of IFN-γ treatment in normoxia. Densitometric quantification of each protein level was normalized by loading control protein, TATA binding protein (TBP), before the IFN-γ-treated group was compared to the untreated control within each experiment. Mean ± SEM from 7 independent experiments. AHR: fold change (FC) 1.64; p= 0.11. HIF1α: FC 0.71; p= 0.012. ARNT: FC 1.0; p= 0.97. D, Transcriptional activation of a canonical AHR target gene CYP1B1 by qPCR by IFN-γ. Mean ± SEM from 3 independent experiments. E, Nuclear protein extracts of HCAEC were co-immunoprecipitated (CO-IP) with ARNT following IFN-γ treatment and probed with antibodies against AHR, HIF1α, and ARNT. The left panel represents protein detection in the 8% of the total unprocessed nuclear lysates (input) used for each CO-IP experiment. Representative Western blot. F, IFN-γ-induced fold changes in nuclear AHR and HIF1α co-immunoprecipitated with ARNT in normoxia. Densitometric quantification of each protein was normalized by the co-immunoprecipitated ARNT level before the IFN-γ-treated group was compared to the untreated control within each experiment. Mean ± SEM from 7 independent experiments. IP ARNT: AHR FC 1.30; p = 0.018. IP ARNT: HIF1α: FC 0.86; p = 0.036. G, Fold changes in the relative abundance of ARNT-bound nuclear HIF1α over ARNT-bound AHR in HCAEC following IFN-γ treatment over untreated control, p = 0.036. Mean ± SEM from 7 independent experiments. H, Schematic summary of the proposed mechanism. I, HRE luciferase activity after 48 h cobalt chloride (CoCl2) treatment with or without IFN-γ. HRE firefly luciferase activity was normalized by the cotransfected Renilla luciferase activity in each sample before quantifying the fold changes in the reporter activity from the untreated control group. Mean ± SEM from 3 independent experiments. J, Transcriptional suppression of a canonical HIF1 target gene VEGFA by qPCR by IFN-γ. Mean ± SEM from 3 independent experiments. Statistical significance was determined by one-sample t-test (C, F, G), Welch’s t-test (D), Welch’s ANOVA with post hoc Dunnett’s T3 multiple comparisons test (I), and unpaired two-tailed student’s t-test (J). AHR: Aryl hydrocarbon receptor, ARNT: Aryl hydrocarbon receptor nuclear translocator, HIF1α: Hypoxia inducible factor 1 alpha, CYP1B1: Cytochrome P450 family 1 subfamily B Member 1, TBP: Tata binding protein, DRE: digoxin responsive element, HRE: hypoxia responsive element, VEGFA: vascular endothelial growth factor A. * p <0.05, ** p < 0.01
Figure 4.
Figure 4.. IFN-γ-induced suppression of glycolytic gene expression is mediated by the interactions between the IDO1-AHR-HIF1 transcriptional regulatory pathways
A-B, Pharmacological inhibition of IDO1 by 1-methyltryptophan (1-MT) abrogates IFN-γ induced suppression of SLC2A1 gene expression (A) and partially attenuates suppression of LDHA (B) in HCEAC. Data represent mean ± SEM from 3 independent experiments. C-D, Gene silencing of AHR attenuates IFN-γ induced suppression of LDHA gene expression in HCEAC. Data represent mean mRNA fold changes with IFN-γ treatment compared to those not exposed to IFN-γ within each siRNA treatment group ± SEM from 3 independent experiments. E, Gene silencing of von Hippel-Lindau tumor suppressor (VHL) stabilizes nuclear HIF1α protein expression in normoxia. TATA binding protein (TBP) was used as a loading control. Representative Western blot. F-G, HIF1α stabilization in normoxia by gene silencing of VHL abrogates IFN-γ induced suppression of LDHA gene expression in HCAEC. Data represent mean mRNA fold changes with IFN-γ treatment compared to those not exposed to IFN-γ within each siRNA treatment group ± SEM from 3 independent experiments. Statistical significance was determined by one-way ANOVA with post hoc Tukey’s multiple comparisons test (A-D) or Kruskal-Wallis test with post hoc Dunn’s multiple comparisons test (F-G). *p < 0.05, ** p < 0.01, *** < 0.001
Figure 5.
Figure 5.. IFN-γ exposure depletes basal intracellular NAD(H) via increased ADP-ribosylation in HCAEC
A, Intracellular NAD(H) (total NAD+ and NADH) in HCAEC following IFN-γ treatment for 24 h at 20 or 50 ng/mL detected by bioluminescent assay with or without 1 h pretreatment with a poly (ADP-ribose) polymerase inhibitor, 3 aminobenzamide (3-AB). B, Intracellular NAD+/NADH ratio following the same IFN-γ treatments. C, Intracellular NAD(H) in HCAEC following IFN-γ treatment for 24 h at 50 ng/mL with or without subsequent nicotinamide mononucleotide (NMN) supplementation at 0.5 mM for an additional 24 h. Data represent mean ± SEM from 3 independent experiments. D-E, Intracellular ATP/ADP (D) and ATP/AMP (E) ratios in HCAEC following 24 h of IFN-γ treatment measured by HPLC. Data represent mean ± SEM from 9 independent experiments. Statistical significance was assessed using one-way ANOVA with post hoc Tukey’s multiple comparisons (A-C) or an unpaired two-tailed Student’s t-test (D-E). ADP: Adenosine diphosphate, ATP: Adenosine triphosphate, HPLC: High performance liquid chromatography, NAD(H): Nicotinamide adenine dinucleotide. ** p < 0.01
Figure 6.
Figure 6.. IFN-γ activates fatty acid oxidation in HCAEC
A, Real time extracellular flux analysis of mitochondrial oxygen consumption rate reflecting oxidative phosphorylation (OXPHOS) of HCAEC following IFN-γ treatment at 50 ng/ml for 24 h. B, Mitochondrial oxygen consumption associated with ATP production from the same experiments. C, IFN-γ-induced changes in the ratio between mitochondrial OCR and ECAR representing decreased glycolysis and increased OXPHOS in HCAEC. Mean ± SEM from 6 independent experiments (A-C). Statistical significance was assessed using paired two-tailed Student’s t-tests (A-B) or Wilcoxon matched-pairs signed rank test (C). D, Representative plot demonstrating altered basal glycolysis and oxidative phosphorylation activities in HCAEC following the same IFN-γ treatment in a single experiment. Mean ± SEM from 9–10 biological replicates. E, IFN-γ induces gene expression changes in the fatty acid oxidation enzymes by RNASeq analysis of HCAEC obtained in biological triplicates. Statistical significance was determined based on the p-values adjusted for multiple test hypotheses by Benjamini-Hochberg procedure. F-G, Intracellular acylcarnitines (butyrylcarnitine (F) and propionylcarnitine (G)) in HCAEC measured by LC-MS following the same IFN-γ treatment. Mean ± SEM of 9 biological replicates from 3 independent experiments. Statistical significance was assessed using Welch’s t-test. H-I, Phosphorylation of AMP-activated protein kinase (AMPK) at Thr 172 following 7 h of IFN-γ treatment at 50 ng/mL. Representative Western blot (H) and densitometric analysis (I). Mean ± SEM from 3 independent experiments analyzed by two-tailed Student’s t-test. J, Real time extracellular flux analysis of basal OXPHOS of HCAEC following the same IFN-γ treatment with and without 1 h 10 μM etomoxir incubation just prior to analysis. K, Mitochondrial oxygen consumption associated with ATP production from the same experiments. Mean ± SEM from 4 independent experiments (J-K). Statistical significance was assessed by 2-way ANOVA with Sidak’s multiple comparison tests. L-M, Intracellular ATP/ADP ratios detected in HCAEC following the IFN-γ treatment with (M) and without (L) etomoxir. Data represent mean fold changes with IFN-γ treatment compared to those not exposed to IFN-γ within each inhibitor treatment group ± SEM from 7–9 independent experiments. Statistical significance was assessed using a two-tailed Student’s t-test. *p < 0.05, ** p < 0.01, **** p < 0.0001 ACAA: Acetyl-CoA acyltransferase, ACADM: Acyl-CoA dehydrogenase medium chain, ACADS: Acyl-CoA dehydrogenase short chain, ACADSB: Acyl-CoA dehydrogenase short/branched chain, ACADVL: Acyl-CoA dehydrogenase very long chain, ACSL: Acyl-CoA synthetase long chain family member, CPT: Carnitine palmitoyltransferase, HADH: Hydroxyacyl-CoA dehydrogenase trifunctional multienzyme complex.
Figure 7.
Figure 7.. IFN-γ exposure depletes endothelial basal intracellular cGMP and impairs proliferation and migratory capacity.
A-B, Intracellular cGMP levels from HCAEC quantified using ELISA following 25 h of IFN-γ treatment at 50 ng/mL. Absolute intracellular cGMP measurements normalized to total protein/plate (pmol/mg protein) (A) and relative intracellular cGMP levels expressed as the percentages of those of untreated control groups (B). Mean ± SEM from 8 biological replicates from 4 independent experiments. C-F, HCAEC proliferation and migration capacities were assessed by scratch assay after IFN-γ exposure for 30 h. Representative bright field images are shown at 0 h (C-D) and 15 h the scratch (E-F). G, Percentages of wound closure or monolayer re-endothelialization following IFN-γ treatment were calculated by the following formula = [(open area at 0 h) - (open area at 15 h)]/(open area at 0 h) × 100. Mean ± SEM from 3 independent experiments. Statistical significance was assessed using a two-tailed Student’s t-test (A,G) or one-sample t-test (B). * p < 0.05
Figure 8.
Figure 8.
Proposed mechanisms for the widespread IFN-γ-induced metabolic derangements in human coronary artery endothelial cells.

References

    1. Li X, Sun X and Carmeliet P. Hallmarks of Endothelial Cell Metabolism in Health and Disease. Cell Metabolism. 2019;30:414–433. - PubMed
    1. Krützfeldt A, Spahr R, Mertens S, Siegmund B and Piper HM. Metabolism of exogenous substrates by coronary endothelial cells in culture. J Mol Cell Cardiol. 1990;22:1393–404. - PubMed
    1. Culic O, Gruwel ML and Schrader J. Energy turnover of vascular endothelial cells. Am J Physiol. 1997;273:C205–13. - PubMed
    1. Yang Q, Xu J, Ma Q, Liu Z, Sudhahar V, Cao Y, Wang L, Zeng X, Zhou Y, Zhang M, et al. PRKAA1/AMPKα1-driven glycolysis in endothelial cells exposed to disturbed flow protects against atherosclerosis. Nature Communications. 2018;9:4667. - PMC - PubMed
    1. Cao Y, Zhang X, Wang L, Yang Q, Ma Q, Xu J, Wang J, Kovacs L, Ayon RJ, Liu Z, et al. PFKFB3-mediated endothelial glycolysis promotes pulmonary hypertension. Proc Natl Acad Sci U S A. 2019;116:13394–13403. - PMC - PubMed

Publication types

MeSH terms