. 2021 Oct 26;6(5):e0086421.
doi: 10.1128/mSystems.00864-21. Epub 2021 Oct 12.

Adaptation of Bacillus thuringiensis to Plant Colonization Affects Differentiation and Toxicity

Affiliations

Adaptation of Bacillus thuringiensis to Plant Colonization Affects Differentiation and Toxicity

Yicen Lin et al. mSystems. .

Abstract

The Bacillus cereus group (Bacillus cereus sensu lato) has a diverse ecology, including various species that are vertebrate or invertebrate pathogens. Few isolates from the B. cereus group have however been demonstrated to benefit plant growth. Therefore, it is crucial to explore how bacterial development and pathogenesis evolve during plant colonization. Herein, we investigated Bacillus thuringiensis (Cry-) adaptation to the colonization of Arabidopsis thaliana roots and monitored changes in cellular differentiation in experimentally evolved isolates. Isolates from two populations displayed improved iterative ecesis on roots and increased virulence against insect larvae. Molecular dissection and recreation of a causative mutation revealed the importance of a nonsense mutation in the rho transcription terminator gene. Transcriptome analysis revealed how Rho impacts various B. thuringiensis genes involved in carbohydrate metabolism and virulence. Our work suggests that evolved multicellular aggregates have a fitness advantage over single cells when colonizing plants, creating a trade-off between swimming and multicellularity in evolved lineages, in addition to unrelated alterations in pathogenicity. IMPORTANCE Biologicals-based plant protection relies on the use of safe microbial strains. During application of biologicals to the rhizosphere, microbes adapt to the niche, including genetic mutations shaping the physiology of the cells. Here, the experimental evolution of Bacillus thuringiensis lacking the insecticide crystal toxins was examined on the plant root to reveal how adaptation shapes the differentiation of this bacterium. Interestingly, evolution of certain lineages led to increased hemolysis and insect larva pathogenesis in B. thuringiensis driven by transcriptional rewiring. Further, our detailed study reveals how inactivation of the transcription termination protein Rho promotes aggregation on the plant root in addition to altered differentiation and pathogenesis in B. thuringiensis.

Keywords: Arabidopsis thaliana; Bacillus thuringiensis; experimental evolution; pathogenesis; plant-microbe interaction.


Figures

FIG 1
FIG 1
Experimental evolution setup and productivity assessment. (a) Experimental evolution model of root-associated biofilms. Parallel lineages of the Bt407 (Cry) strain were initiated on a 1-week-old A. thaliana seedling to form biofilm in MSNg medium in 48-well microliter plates agitated at 90 rpm. Colonized plants were subsequently transferred to a well containing a sterile seedling, and the steps were repeated for 40 transfers. (b) Productivity (CFU mm−1) of plant-colonized Bt407 (Cry) lineages are shown at roughly every fifth transfer. (c) Plant-colonized biofilm productivity (CFU mm−1) of evolved isolates (n = 6 biologically independent plantlet samples of similar length). The central values (horizontal lines) represent the means, and the error bars represent standard errors of the means. Asterisks indicate significant differences between the values for each group and the ancestor (Anc) (*, P < 0.05; **, P < 0.01; ***, P < 0.001; ****, P < 0.0001; two-tailed t test with Welch’s corrections). (d) Recolonized biofilm productivity (CFU mm−1) of the evolved isolates (n = 6 biologically independent plantlet samples of similar length). Statistical significance assessment was conducted as described above for panel C.
FIG 2
FIG 2
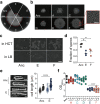
Certain evolved lineages demonstrate elongated and sessile bacterial traits. (a) Swimming motility of Bt407 ancestor (Anc) and representative evolved isolates. Images are representative of three independent biological replicates. Bar, 1 cm. (b) Swarming radius of the Bt407 ancestor and evolved isolates. The framed area in panel F shows filamentous growth at the colony edge. Bars indicate 1 cm and 10 μm, respectively. Images are representative of three independent biological replicates. (c) Cell morphology of planktonic cultures at an OD600 of 1 in HCT and LB media. Bar, 10 μm. Images are representative of three biologically independent bacterial cultures in HCT and LB media, respectively. (d) Sporulation of the ancestor strain and evolved lineages E and F (n = 3 independent biological samples per group). Vegetative cells and heat-resistant spores of three groups were counted after 48 h of incubation in HCT medium at 30°C. Error bars indicate the standard errors of the means. Statistically significant differences were examined using one-way analysis of variance (ANOVA) followed by Tukey’s multiple comparisons (*, P < 0.05). (e) Cryo-SEM imaging of the Bt407 ancestor and evolved lineage E (left). Calculated length of single bacterial cells (open symbols) and chains (closed symbols) are shown on the right. The central values (horizontal lines) indicate the means (n = 67 for Bt407 ancestor and n = 64 for evolved lineage E), and the error bars represent standard deviations. Asterisks indicate significant differences (****, P < 0.0001; two-tailed t test with Welch’s corrections). Bars, 1 μm. (f) Surface-attached (submerged) biofilm formation, quantitated by crystal violet staining and subsequent solubilization by 70% ethanol. The central values (horizontal lines) represent the means (n = 6 biologically independent samples), and the error bars represent the standard errors of the means. Asterisks indicate significant differences between each group and the ancestor (****, P < 0.0001; two-tailed t test with Welch’s corrections).
FIG 3
FIG 3
Biofilm formation induced by plant polysaccharides is promoted in evolved lineages. (A) Images of biofilm aggregates in response to MSN medium supplemented with the plant polysaccharide cellobiose (0.5%) (MSNc). Biofilm analyses are representative of three biological replicates. Bar, 3 mm. (B) Pellicle formation of the ancestor and evolved isolates induced in LB medium supplemented with the plant polysaccharide xylan (0.5%). Panels A and B have the same magnification. (C) A. thaliana roots colonized by a 1:1 mixture of Bt407 ancestor (magenta) and evolved isolates (green) imaged by CLSM. The top row shows an overlay of fluorescence channels and the bright-field image. Images are representative of three independent seedlings. Bars, 50 μm. (D) Frequencies of each strain in the root-colonized biofilm. Bars represent the means (n = 3), and the error bars represent standard deviations (*, P < 0.05; **, P < 0.01; ***, P < 0.001; ****, P < 0.0001; two-tailed t test with Welch’s corrections). Color codes are as in panel C. (E) B. thuringiensis cells that carried either mKate (magenta, ancestor) or GFP (green, evolved isolate) reporter were cocultured with A. thaliana seedlings at a one-to-one ratio. After 48 h of incubation, root biofilms were visualized by CLSM. Bt407 ancestor and evolved isolate demonstrate different cell morphologies in root biofilms. Bars, 50 μm.
FIG 4
FIG 4
Sporulation kinetics, aggregation response, and pathogenesis of the ancestor and evolved isolates. (A) Microscopic observations of strains in MSNc medium harvested at different time points. Images are representative of three independent cultures. Bar, 10 μm. (B) Sporulation percentage of strains in MSNc medium at three time points. Symbols represent the means of three replicative assays, and error bars represent the standard deviations. (C) Graphic representations of the three distinct cell morphologies observed.
FIG 5
FIG 5
Pathogenesis of the ancestor and evolved isolates. (A) Representative images of hemolytic activity from ancestor and evolved isolate colonies. Hi, Ha, and Cs represent hemolytic indices, hemolytic areas, and colony sizes, respectively. Bar, 10 mm. (B) Hemolytic indices (as described in Materials and Methods). The central values (horizontal lines) represent the means (n = 8), while the error bars represent the standard errors of the means. Asterisks indicate significant differences between the values for each group and the ancestor (*, P < 0.05; **, P < 0.01; ****, P < 0.0001; two-tailed t test with Welch’s corrections). (C) LD50 values of ancestor and evolved isolates based on mortality toward insect larvae (Galleria mellonella). Bars represent mean LD50 values (n = 3), and error bars represent standard deviations. Asterisks indicate significant differences between each group and the ancestor (****, P < 0.0001; two-tailed t test with Welch’s corrections).
FIG 6
FIG 6
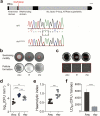
The Rho transcriptional terminator plays a crucial role in cell fate decisions. (a) Schematic illustration of the location of the rhoGlu54stop mutation. The conserved motifs were identified through the NCBI conserved domain database (https://www.ncbi.nlm.nih.gov/Structure/cdd/wrpsb.cgi). WT, wild type. Bar, 50 nt. (b) Motility and biofilm formation in the rhoGlu54stop strain. Images are representatives of at least three independent replicates. (c) The plant disaccharide cellobiose promotes aggregate formation. Images are representative of at least three independent replicates. Bar, 10 μm. (d) Increased plant colonization of the E lineage isolate and the rhoGlu54stop strain. The central values (horizontal lines) represent the means (n = 6 biologically independent seedlings for all groups), and the error bars represent the standard errors of the means. For multiple comparisons, ordinary one-way ANOVA and Tukey comparison tests were employed (**, P < 0.01; ***, P < 0.001; ****, P < 0.0001). (e) Hemolytic activity is increased in the rhoGlu54stop strain. The central values (horizontal lines) represent the means (n = 10 biologically independent sampled cultures), and the error bars represent the standard errors of the means (***, P < 0.001; two-tailed t test with Welch’s corrections). (F) In vivo toxicity of the rhoGlu54stop strain. The central values (horizontal lines) represent the means (n = 3), and the error bars represent standard deviations (****, P < 0.0001; two-tailed t test with Welch’s corrections).
FIG 7
FIG 7
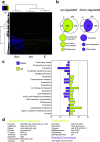
An evolved isolate from lineage E and the rhoGlu54stop strain share similar differences of gene expression pattern compared with the ancestor. (a) Heatmap showing the relative expression levels of differentially expressed genes (DEGs) among the strains (n = 3 biologically replicates for each strain). TMM-normalized FPKM gene expression values were hierarchically clustered according to samples and genes. In the map, FPKM values are log2 transformed and median centered by gene. The color key gives the log2 value scale (negative and positive values represent gene expression below and above the median, respectively). (b) Venn diagrams of genes up- or downregulated in the evolved isolate from lineage E and the reconstructed rhoGlu54stop strain compared with the ancestor. The top functions of grouped DEGs are listed underneath the Venn diagrams. (c) Gene Ontology (GO) terms of the corresponding DEGs in the evolved strain and the rhoGlu54stop strain. (D) Representative functions and related DEGs. Yellow and magenta indicate up- and downregulated expression, respectively, in the evolved strain and the rhoGlu54stop strain relative to the ancestor.

Similar articles

Cited by

References

    1. Ehling-Schulz M, Lereclus D, Koehler TM. 2019. The Bacillus cereus group: Bacillus species with pathogenic potential. Microbiol Spectr 7:10.1128/microbiolspec.GPP3-0032-2018. doi:10.1128/microbiolspec.GPP3-0032-2018. - DOI - PMC - PubMed
    1. Enosi Tuipulotu D, Mathur A, Ngo C, Man SM. 2021. Bacillus cereus: epidemiology, virulence factors, and host–pathogen interactions. Trends Microbiol 29:458–471. doi:10.1016/j.tim.2020.09.003. - DOI - PubMed
    1. Huang Y, Flint SH, Palmer JS. 2020. Bacillus cereus spores and toxins – the potential role of biofilms. Food Microbiol 90:103493. doi:10.1016/j.fm.2020.103493. - DOI - PubMed
    1. Helgason E, Økstad OA, Caugant DA, Johansen HA, Fouet A, Mock M, Hegna I, Kolstø AB. 2000. Bacillus anthracis, Bacillus cereus, and Bacillus thuringiensis—one species on the basis of genetic evidence. Appl Environ Microbiol 66:2627–2630. doi:10.1128/AEM.66.6.2627-2630.2000. - DOI - PMC - PubMed
    1. Helgason E, Tourasse NJ, Meisal R, Caugant DA, Kolstø AB. 2004. Multilocus sequence typing scheme for bacteria of the Bacillus cereus group. Appl Environ Microbiol 70:191–201. doi:10.1128/AEM.70.1.191-201.2004. - DOI - PMC - PubMed

LinkOut - more resources