Comparative Study
. 2021 Oct 12:10:e65846.
doi: 10.7554/eLife.65846.

Linking functional and molecular mechanisms of host resilience to malaria infection

Affiliations
Comparative Study

Linking functional and molecular mechanisms of host resilience to malaria infection

Tsukushi Kamiya et al. Elife. .

Abstract

It remains challenging to understand why some hosts suffer severe illnesses, while others are unscathed by the same infection. We fitted a mathematical model to longitudinal measurements of parasite and red blood cell density in murine hosts from diverse genetic backgrounds to identify aspects of within-host interactions that explain variation in host resilience and survival during acute malaria infection. Among eight mouse strains that collectively span 90% of the common genetic diversity of laboratory mice, we found that high host mortality was associated with either weak parasite clearance, or a strong, yet imprecise response that inadvertently removes uninfected cells in excess. Subsequent cross-sectional cytokine assays revealed that the two distinct functional mechanisms of poor survival were underpinned by low expression of either pro- or anti-inflammatory cytokines, respectively. By combining mathematical modelling and molecular immunology assays, our study uncovered proximate mechanisms of diverse infection outcomes across multiple host strains and biological scales.

Keywords: Malaria; Plasmodium chabaudi; bayesian hierarchical model; computational biology; infectious disease; innate immunity; microbiology; mouse; systems biology; within-host model.


Conflict of interest statement

TK, ND, MG, DS, NM No competing interests declared

Figures

Figure 1.
Figure 1.. Proportion of mice surviving over the course of infections initiated with 105P. chabaudi AJ parasites.
Eight mouse strains are shown (with total sample sizes given in parentheses): WSB/EiJ (30), 129S1/SvImJ (10), NZO/HILtJ (10), C57BL/6 (20), CAST/EiJ (32), NOD/ShiLtJ (15), A/J (15), and PWK/PhJ (22). The dataset is a compilation of two experiments (Davis et al., 2021 and Gupta et al. unpublished). The lines for WSB/EiJ, 129S1/SvImJ and NZO/HILtJ are jittered as 100% of mice of each strain survived for 15 days.
Figure 2.
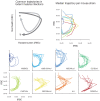
Figure 2.. Longitudinal data of infection contain features of within-host ecology that influence infection outcomes.
In a phase plot bound by parasite burden and host health (i.e. disease space, sensu [Schneider, 2011; Torres et al., 2016]), infection progresses clockwise from the top-left corner (i.e. many RBCs, few iRBCs). Top left panel illustrates common trajectories. Following a rapid parasite growth phase (rightward movement along the x-axis), host health deteriorates (downward movement along the y-axis) during acute malaria infection. In the meantime, the parasite density starts to decline due to resource limitation and/or upregulated immunity. If a host is resilient, the trajectory tends towards the starting healthy state as parasites further decline and RBCs are replenished (path a, light grey). In contrast, the damage to host health may be irreparable in non-resilient hosts (path b, dark grey) (Schneider, 2011). The small, coloured plots at the bottom show the empirically observed trajectories of the first wave of malaria infection in 80 mice across eight strains in disease space, with the densities of iRBCs and RBCs on the x- and y-axis, respectively. The top right panel shows the median trajectory of the eight strains. Generally speaking, highly resilient strains (WSB/EiJ, 129S1/SvImJ, NZO/HILtJ, C57BL/6) follow path a, and less resilient strains (CAST/EiJ, NOD/ShiLtJ, A/J, PWK/PhJ) follow path b.
Figure 3.
Figure 3.. Model schematics.
(a) A dynamical regulation model of host responses against blood-stage malaria. We condensed the complexity of the vertebrate acute innate response against malaria into two independent pathways responsible for general RBC clearance and targeted iRBC clearance (represented by the yellow and green block, respectively). Activation of each response occurs when the host detects the presence of pathogen-associated molecular patterns (PAMPs): f1 and f2 are linear functions of the iRBC density. For general RBC clearance, the activity resets daily. In contrast, the activity of the targeted responses against iRBCs accumulates over multiple days (see methods for further explanation). The output of each host response feeds back to influence the within-host infection dynamics (indicated by the coloured arrows in panel b). (b) Dynamics of RBCs and blood-stage malaria parasites within the host. Recruitment into and transitions among components of the asexual cycle are indicated with black arrows. Grey arrows indicate background mortality for different components. General clearance of RBCs and targeted clearance of iRBCs are marked with yellow and green arrows, respectively. Replenishment of RBCs (erythropoiesis) is indicated in blue.
Figure 4.
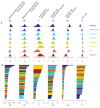
Figure 4.. Differences in within-host ecological parameters reveal functional diversity linked to resilience to malaria infection.
(a) Strain-specific variation, s, in each parameter of the set θ(μR,μR′′,ρ,ψN1,ψN2,β). The eight strains are ordered according to overall survival percentage from the top (see Figure 1). The average parameter value across the eight strains is indicated by s=0. (b) Ordered parameter stacks show functional similarities and differences between individual mice of different strains (indicated by colours). Each slice of a stack represents the median estimate for an individual mouse.
Figure 5.
Figure 5.. Within-host ecological parameters differentiate mouse strains with varying degrees of resilience to malaria infection.
The PCA biplot displays the relationship between individual mice in the first two principal components, which collectively account for 66.7% of the total variance in parameters describing within-host malaria ecology, θ(μR,μR′′,ρ,ψN1,ψN2,β). The direction and length of the grey arrows indicate the contribution of each parameter to the principal components. Parameter descriptions are found in Table 1.
Figure 6.
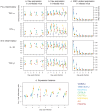
Figure 6.. Distinct expression patterns of pro (TNF-α and IFN-γ) and anti-inflammatory cytokines (IL-10 and TGF-β) in eight mouse strains infected with P. chabaudi show that host resilience to malaria infection is linked to the strength and balance in cytokine expressions.
Raw temporal expression intensity in (a) uninfected control and (b) infected mice between day 3 and 9 post-infection. (c) The intensity of cytokine expression scaled by the median iRBC density of the strain per day. A higher value indicates higher propensity to express cytokines against the same density of parasites on a given day. (d) The ratio of pro- to anti-inflammatory cytokine expressions. Shown are additive expressions (i.e. TNF-α + IFN-γ and IL-10 + TGF-β), but multiplicative expression patterns (i.e. TNF-α × IFN-γ and IL-10 × TGF-β) were qualitatively identical (results not shown). The points and error bars are the means and standard deviations, respectively. For each day, the strains are ordered from left to right according to host survival as listed in Figure 1.
Appendix 1—figure 1.
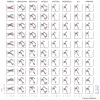
Appendix 1—figure 1.. The fit of the dynamical model to the density of RBCs (red) and iRBCs (blue).
Each column corresponds to a mouse strain. The crosses indicate data and grey bands correspond to 95% predictive intervals of the model, incorporating uncertainty in parameter estimation and sampling.
Appendix 1—figure 2.
Appendix 1—figure 2.. Standardised model residuals of the dynamical model.
Crosses indicate residuals for individual time series, while red dots indicate the mean; blue dotted lines indicate the Bonferroni-corrected 95% confidence intervals. Poor fits are indicated by the mean residuals deviating from confidence intervals.
Appendix 2—figure 1.
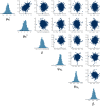
Appendix 2—figure 1.. Pairwise correlations of MCMC samples indicate that the parameter set θ(μR,μR′′,ρ,ψN1,ψN2,β) is likely identifiable.
The highest correlation coefficient observed was 0.54 between μR (daily background RBC mortality rate during infection) and μR′′ (density-independent RBC replenishment rate during infection).
Appendix 2—figure 2.
Appendix 2—figure 2.. The model parameters were estimated with accuracy, precision and identifiability.
Posterior z-score (y-axis) measures how closely the posterior recovers the parameters of the true data generating process and posterior contraction (x-axis) evaluates the influence of the likelihood function over the prior, respectively. Smaller absolute posterior z-scores indicate that the posterior accurately recovers the parameters of the true data generating process: the absolute value beyond three to four may indicate substantial bias (Schad et al., 2021). The posterior contraction values close to one indicate that data are much more informative than the prior.

Similar articles

Cited by

References

    1. Artavanis-Tsakonas K, Tongren JE, Riley EM. The war between the malaria parasite and the immune system: immunity, immunoregulation and immunopathology. Clinical and Experimental Immunology. 2003;133:145–152. doi: 10.1046/j.1365-2249.2003.02174.x. - DOI - PMC - PubMed
    1. Bogdan C, Röllinghoff M, Diefenbach A. Reactive oxygen and reactive nitrogen intermediates in innate and specific immunity. Current Opinion in Immunology. 2000;12:64–76. doi: 10.1016/s0952-7915(99)00052-7. - DOI - PubMed
    1. Bopp SE, Ramachandran V, Henson K, Luzader A, Lindstrom M, Spooner M, Steffy BM, Suzuki O, Janse C, Waters AP, Zhou Y, Wiltshire T, Winzeler EA. Genome wide analysis of inbred mouse lines identifies a locus containing Ppar-gamma as contributing to enhanced malaria survival. PLOS ONE. 2010;5:e10903. doi: 10.1371/journal.pone.0010903. - DOI - PMC - PubMed
    1. Bouharoun-Tayoun H, Oeuvray C, Lunel F, Druilhe P. Mechanisms underlying the monocyte-mediated antibody-dependent killing of Plasmodium falciparum asexual blood stages. Journal of Experimental Medicine. 1995;182:409–418. doi: 10.1084/jem.182.2.409. - DOI - PMC - PubMed
    1. Carpenter B, Gelman A, Hoffman MD, Lee D, Ben Goodrich MB, Brubaker M, Guo J, Li P, Riddell A. Stan: a probabilistic programming language. Journal of Statistical Software. 2017;76 doi: 10.18637/jss.v076.i01. - DOI - PMC - PubMed

Publication types

MeSH terms