. 2022 Jan 12;38(3):631-647.
doi: 10.1093/bioinformatics/btab703.

MCRL: using a reference library to compress a metagenome into a non-redundant list of sequences, considering viruses as a case study

Affiliations

MCRL: using a reference library to compress a metagenome into a non-redundant list of sequences, considering viruses as a case study

Arbel D Tadmor et al. Bioinformatics. .

Abstract

Motivation: Metagenomes offer a glimpse into the total genomic diversity contained within a sample. Currently, however, there is no straightforward way to obtain a non-redundant list of all putative homologs of a set of reference sequences present in a metagenome.

Results: To address this problem, we developed a novel clustering approach called 'metagenomic clustering by reference library' (MCRL), where a reference library containing a set of reference genes is clustered with respect to an assembled metagenome. According to our proposed approach, reference genes homologous to similar sets of metagenomic sequences, termed 'signatures', are iteratively clustered in a greedy fashion, retaining at each step the reference genes yielding the lowest E values, and terminating when signatures of remaining reference genes have a minimal overlap. The outcome of this computation is a non-redundant list of reference genes homologous to minimally overlapping sets of contigs, representing potential candidates for gene families present in the metagenome. Unlike metagenomic clustering methods, there is no need for contigs to overlap to be associated with a cluster, enabling MCRL to draw on more information encoded in the metagenome when computing tentative gene families. We demonstrate how MCRL can be used to extract candidate viral gene families from an oral metagenome and an oral virome that otherwise could not be determined using standard approaches. We evaluate the sensitivity, accuracy and robustness of our proposed method for the viral case study and compare it with existing analysis approaches.

Availability and implementation: https://github.com/a-tadmor/MCRL.

Supplementary information: Supplementary data are available at Bioinformatics online.


Figures

Fig. 1.
Fig. 1.
Schematic illustration of the MCRL algorithm. (a) Each reference gene ri is aligned against the given metagenome yielding a metagenomic signature. Metagenomic signatures are depicted as a set of vertical black dots inside rectangles (e.g. the dotted vertical green rectangle is the signature of reference gene r3), color-coded according to the E value yielded by each contig. Each horizontal line in this diagram represents a single contig, showing to which signatures the given contig belongs (e.g. the dotted horizontal blue rectangle represents a contig that is part of the signatures of r1, r2 and r3). In this example, the signatures of r1 and r2 have a 60% overlap based on Equation (1) using the stringent definition of overlap and a 100% overlap using the inclusive definition of overlap (overlap is indicated by the dashed black rectangle). The color bar shows the range of E values, indicating the threshold for detection of a reference gene (Eth), and the minimal threshold for defining homology (E0). (b) Illustration of the MCRL clustering algorithm using a stringent overlap condition. In this example, there are four reference genes. The diagram indicates which reference genes are related, and which reference genes were elected at each iteration. For example, r1 is related to itself and to r2 (denoted as r1r1, r2). Since the E value of r2 was lower than r1, r1  electedr2 as the delegate (denoted r1r2). In this manner, in the first iteration, r2 and r3 were elected, and in the second iteration, r3  electedr2. Therefore r2 was the reported reference gene for this cluster. Also shown are the reference gene cluster and the reference gene network that result from this set of reference genes. (c) An alternative representation of the diagram shown in panel (b). Each reference gene reported by MCRL lies at the epicenter (red star) of a network of reference genes (black dots). Each node in the network represents a reference gene, and each edge is directed and connects a reference gene to its delegate, forming tracks leading to the epicenter. A reference gene cluster is defined as the collection of nodes one edge away from the epicenter, and therefore by definition related to the reported reference gene (illustrated by overlapping signatures in the metagenome). The representative contig is denoted in this illustration as a red star in the metagenomic signature of the reported reference gene
Fig. 2.
Fig. 2.
MCRL and CD-HIT sensitivity determined by in silico spike-in experiments. Solid black and green lines show MCRL sensitivity to detect spiked TerL fragments in the signature of reported reference genes as a function of the simulated mutation rate. Shaded areas correspond to 1 SD. Dashed lines show sensitivity when additionally requiring uniqueness: i.e. requiring that signatures positive for a given spiked TerL fragment do not contain spiked fragments from other TerL gene families. Dotted lines further require that the spiked TerL fragments were the representative contigs. Dash-dotted lines show the sensitivity to detect spiked TerL fragments in the signature of reference gene clusters. The solid red line shows CD-HIT sensitivity to detect spiked TerL fragments when clustering the spiked metagenome together with the viral reference library using a sequence identity threshold of 30%. inc, inclusive overlap; str, stringent overlap
Fig. 3.
Fig. 3.
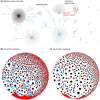
Viral reference gene networks computed for the oral metagenome. (a) Examples of viral reference gene networks computed for the oral metagenome. Each node represents a reference gene. The red node at the epicenter of each network is the reported reference gene, drawn to be proportional to the logarithm of its signature size in the metagenome. Edges of reference gene clusters are drawn in black, and edges leading to reference gene clusters are drawn in blue. For clarity, the directionally of selected edges is shown. Viral reference gene networks computed for the oral metagenome are shown for (b) symmetric clustering, and (c) asymmetric clustering. The figure shows all genes in the viral RefSeq database passing the E value threshold for detection, Eth (10-7), comprising in total ∼26 000 genes
Fig. 4.
Fig. 4.
Correspondence between MCRL and CD-HIT clusters. (a) For each reference gene reported by MCRL (red star in reference gene cluster) a mapping can be established between all contigs belonging to the signature of the reported reference gene and corresponding CD-HIT clusters. Black dots in CD-HIT clusters represent shared contigs, and green dots represent contigs that were unique to CD-HIT clusters. To establish the correspondence between MCRL and CD-HIT clusters, we determined the overlap between the signature of each reported reference gene (or reference gene cluster) and the corresponding CD-HIT clusters (arrows pointing left). Likewise, we determined the overlap between the corresponding CD-HIT clusters and signatures of other reported reference genes (arrow pointing right). (b) Percent of reported reference genes for which the representative contig uniquely mapped to a CD-HIT cluster, i.e. no other representative contig mapped to the same CD-HIT cluster. Results are shown for different CD-HIT sequence identity thresholds. (c) Mean overlap between CD-HIT clusters corresponding to a given reported reference gene and the signature of that reported reference gene (blue—oral virome, green—oral metagenome). Also shown is the mean overlap between CD-HIT clusters corresponding to a given reported reference gene and signatures of other reported reference genes (red—oral virome, orange—oral metagenome). Dotted lines correspond to signatures of reference gene clusters. Including the viral reference library in the CD-HIT clustering process did not impact results
Fig. 5.
Fig. 5.
Heat map of reference gene networks corresponding to TerL genes in the oral virome. Each node is color-coded according to the minimal E value yielded by the given reference gene, shown in logarithmic scale. Nodes corresponding to reported reference genes (yielding the minimal overall E value) are drawn proportional to the logarithm of the signature size

References

    1. Abubucker S. et al. (2012) Metabolic reconstruction for metagenomic data and its application to the human microbiome. PLoS comput. Biol., 8, e1002358. - PMC - PubMed
    1. Albanese D. et al. (2015) MICCA: a complete and accurate software for taxonomic profiling of metagenomic data. Sci. Rep., 5, 9743. - PMC - PubMed
    1. Altschul S.F. et al. (1997) Gapped BLAST and PSI-BLAST: a new generation of protein database search programs. Nucleic Acids Res., 25, 3389–3402. - PMC - PubMed
    1. Arango-Argoty G. et al. (2018) DeepARG: a deep learning approach for predicting antibiotic resistance genes from metagenomic data. Microbiome, 6, 1–15. - PMC - PubMed
    1. Arnold K. et al. (2006) The SWISS-MODEL workspace: a web-based environment for protein structure homology modelling. Bioinformatics, 22, 195–201. - PubMed

Publication types