. 2021 Dec 6;153(12):e202012635.
doi: 10.1085/jgp.202012635. Epub 2021 Oct 12.

Pannexin-1 and CaV1.1 show reciprocal interaction during excitation-contraction and excitation-transcription coupling in skeletal muscle

Affiliations

Pannexin-1 and CaV1.1 show reciprocal interaction during excitation-contraction and excitation-transcription coupling in skeletal muscle

Francisco Jaque-Fernández et al. J Gen Physiol. .

Abstract

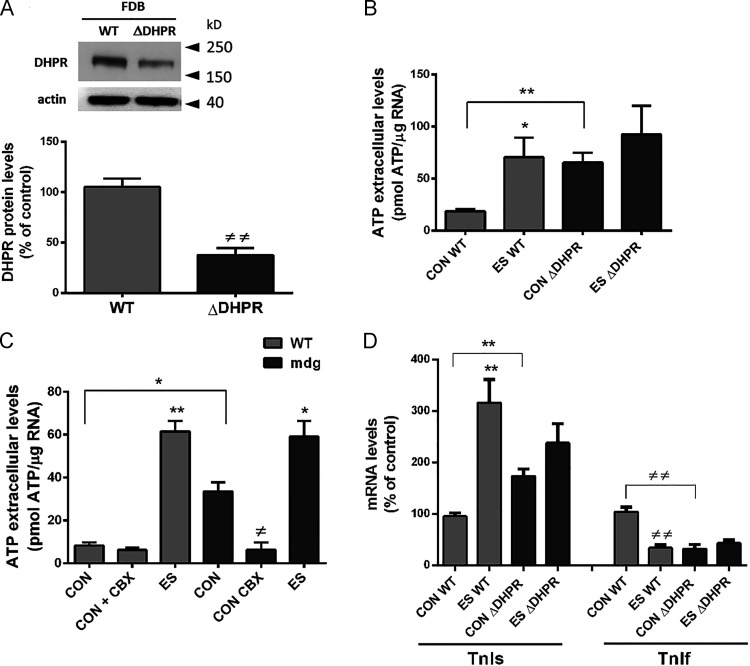
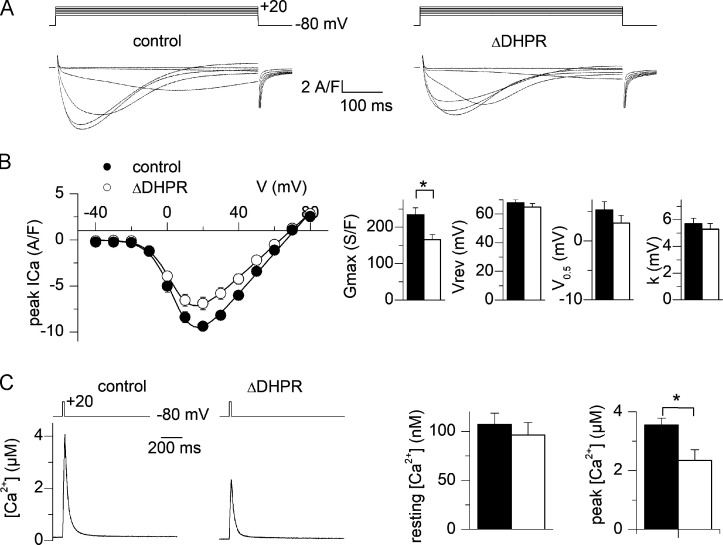
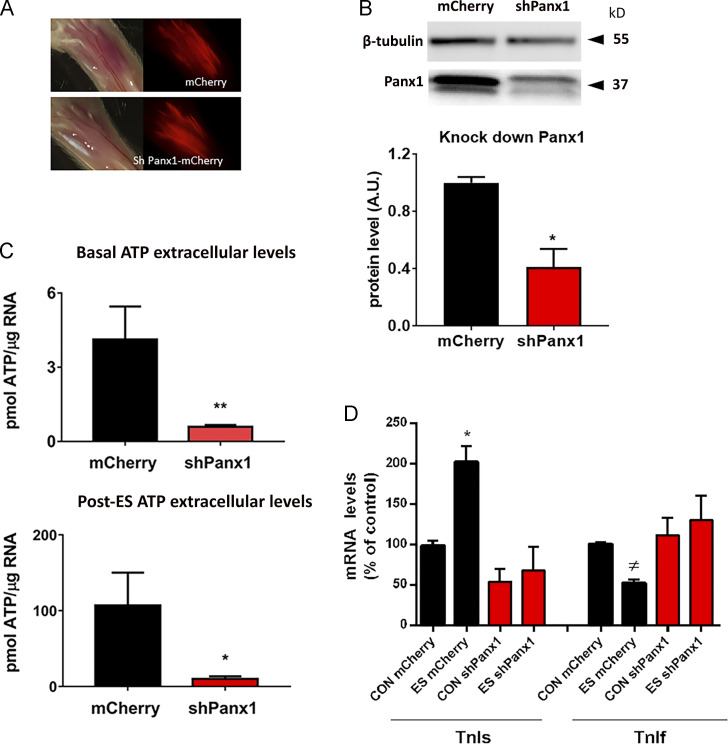
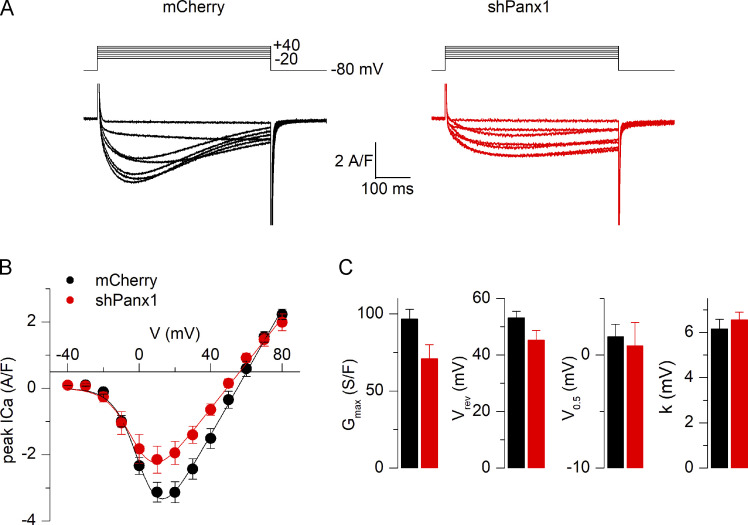
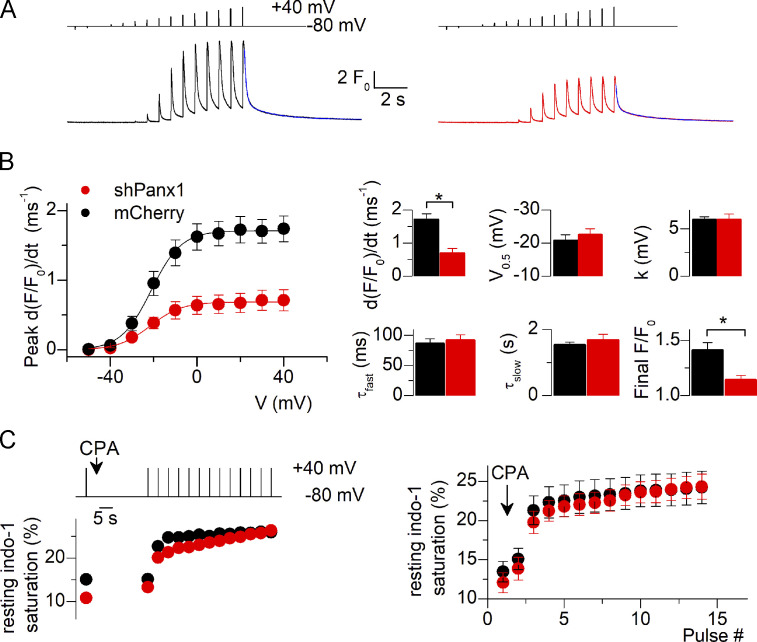
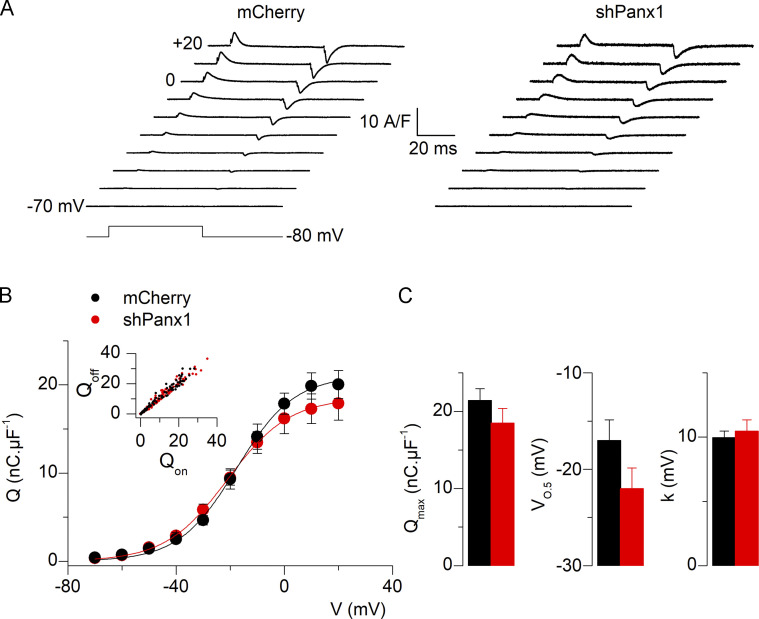
One of the most important functions of skeletal muscle is to respond to nerve stimuli by contracting. This function ensures body movement but also participates in other important physiological roles, like regulation of glucose homeostasis. Muscle activity is closely regulated to adapt to different demands and shows a plasticity that relies on both transcriptional activity and nerve stimuli. These two processes, both dependent on depolarization of the plasma membrane, have so far been regarded as separated and independent processes due to a lack of evidence of common protein partners or molecular mechanisms. In this study, we reveal intimate functional interactions between the process of excitation-induced contraction and the process of excitation-induced transcriptional activity in skeletal muscle. We show that the plasma membrane voltage-sensing protein CaV1.1 and the ATP-releasing channel Pannexin-1 (Panx1) regulate each other in a reciprocal manner, playing roles in both processes. Specifically, knockdown of CaV1.1 produces chronically elevated extracellular ATP concentrations at rest, consistent with disruption of the normal control of Panx1 activity. Conversely, knockdown of Panx1 affects not only activation of transcription but also CaV1.1 function on the control of muscle fiber contraction. Altogether, our results establish the presence of bidirectional functional regulations between the molecular machineries involved in the control of contraction and transcription induced by membrane depolarization of adult muscle fibers. Our results are important for an integrative understanding of skeletal muscle function and may impact our understanding of several neuromuscular diseases.


Figures

Figure 1.
Figure 1.
Leaky behavior of Pannexin-1 in adult muscle fibers down-expressing CaV1.1, mimics the effect induced by ATP after ES of fibers at 20 Hz. (A) CaV1.1 down-expression by the U7 exon–skipping strategy (ΔDHPR fibers) induces a reduction of >60% in CaV1.1 protein level. Top panel shows a representative blot image, while quantification of the reduction in CaV1.1 content is shown at the bottom (n = 3 fdb muscles from three distinct mice). FDB, flexor digitorum brevis. (B) Extracellular ATP levels was measured in basal condition (CON) and after ES in WT and ΔDHPR fibers. We observed an increase by more than three times of the basal extracellular ATP level in ΔDHPR muscle fibers compared with WT ones. WT and ΔDHPR fibers received ES consisted of 270 square pulses of 0.3-ms duration at 20 Hz. After ES, WT fibers experienced a significant increase in extracellular ATP levels; meanwhile, after ES, ΔDHPR fibers did not change extracellular ATP compared with CON condition (n = 3 cultures from three distinct mice). (C) A similar increase in basal extracellular ATP levels (CON) was observed in WT and lacking CaV1.1 (mdg) myotubes, which was suppressed by incubation with 5 µM of the Panx1 inhibitor carbenoxolone (CBX; n = 5 independent experiments). (D) Graph show that increased basal levels of mRNA for the slow isoform of TnI and decreased level for the fast isoform of TnI are observed in ΔDHPR fdb muscle fibers compared with WT fibers. 4 h after ES, TnIs mRNA levels increased, while TnIf mRNA levels diminished in WT fibers. ΔDHPR fibers did not show changes in TnIs and TnIf mRNA levels after ES (n = 4 cultures from four distinct mice). Gray bars represent WT muscles, and black bars represent ΔDHPR muscles. Significant differences within multiple groups were examined using a Kruskal–Wallis test for repeated measures, followed by a multiple comparison test. A Mann–Whitney test was used to detect significant differences between two groups. Data are expressed as mean ± SEM. */≠, P < 0.05; **/≠≠, P < 0.01.
Figure 2.
Figure 2.
Reduced voltage-activated Ca2+ current and intracellular Ca2+ release in muscle fibers down-expressing CaV1.1. (A) Ca2+ current records from a control fiber (left) and a fiber down-expressing CaV1.1 (right). Currents were recorded in response to the voltage pulses shown on top. (B) Mean voltage dependence of the peak CaV1.1 Ca2+ current density in control fibers and in fibers down-expressing CaV1.1. Graphs on the right show corresponding mean values for the current–voltage parameters obtained by fitting individual series of data points with Eq. 1. (C) Indo-1 Ca2+ transient elicited by a 20-ms-long depolarizing pulse to +10 mV in a control fiber and in a fiber down-expressing CaV1.1. Graphs on the right show corresponding mean values for resting and peak [Ca2+] levels (results are from 14 control fibers and 14 fibers down-expressing CaV1.1 from four mice). Black circles and bars correspond to control fibers and open circles and bars to fiber down-expressing CaV1.1. Data are expressed as mean ± SEM. Nested analysis was done for data in graphs shown in B and C. *, P < 0.05.
Figure 3.
Figure 3.
Down-expression of Panx1 decreases basal and post-ES (20 Hz) levels of extracellular ATP altering ES-dependent changes in gene expression. (A) Panel showing red fluorescent fibers after 2 wk of electroporation of fdb muscles with plasmid carrying mCherry (upper panel) and shPanx1-mCherry (lower panel). The corresponding transmitted light images demonstrate broad expression of both plasmids. Whole fdb shown is 1 cm long. (B) Western blots against Panx1 of fdb muscles shows that the muscles expressing the shRNA against Panx1 construct reduces Panx1 protein levels by ∼65% (n = 3 muscles from three distinct mice). (C) The reduction of Panx1 in fdb fibers significantly decreases basal levels of extracellular ATP (left) as well as ES-activated ATP release (right; n = 5 culture plates from five distinct mice). (D) 20 Hz ES-related changes in mRNA levels of TnIs and TnIf observed in mCherry fibers are suppressed in fibers knocked down for Panx1 (n = 3 distinct animals). We can observe a reduction of basal levels of TnIs mRNA in fibers knocked down for Panx1 compared with control (98 ± 5.5 in controls versus 54 ± 15.7 in shPanx1), but it reaches no statistical difference (P = 0.1). Black bars represent mCherry-expressing fibers, and red bars represent shPanx1-mCherry–expressing fibers. Significant differences within multiple groups were examined using a Kruskal–Wallis test for repeated measures, followed by a multiple comparison test. A Mann–Whitney test was used to detect significant differences between two groups. Data are expressed as mean ± SEM. */≠, P < 0.05; **, P < 0.01 versus control mCherry fibers.
Figure 4.
Figure 4.
Reduced expression of Pannexin-1 does not alter Ca2+ current through CaV1.1. (A) Ca2+ current records from a control fiber (left) and from a fiber down-expressing Panx1 (right). Currents were recorded in response to the voltage pulses shown on top. (B) Mean voltage dependence of the peak CaV1.1 Ca2+ current density in control fibers and in fibers down-expressing Panx1. (C) Corresponding mean values for the current–voltage parameters obtained by fitting individual series of data points with Eq. 1. Mean values for the capacitance in the mCherry and in the shPanx1 groups of fibers used were 1.02 ± 0.14 and 1.22 ± 0.08 nF (n = 22 control fibers from three distinct mice and 21 fibers expressing the shRNA against Panx1 from four distinct mice). Black bars and lines represent mCherry-expressing fibers, and red bars represent shPanx1-mCherry–expressing fibers. Data are expressed as mean ± SEM. Nested analysis was done for data shown in C.
Figure 5.
Figure 5.
Reduced expression of Pannexin-1 drastically alters voltage-activated SR Ca2+ release. (A) Fluo-4 F/F0 Ca2+ transients recorded from a control fiber (left) and a fiber down-expressing Panx1 (right). Transients were recorded in response to the voltage protocol shown on top. The superimposed blue line at the end of the record corresponds to the result from fitting a double-exponential plus constant function to the decay of the signal. (B) Voltage dependence of the mean peak rate of rising of fluo-4 fluorescence in control fibers and fibers down-expressing Panx1. Graphs in the upper row on the right show corresponding values for the Boltzmann parameters obtained from fitting individual series of data points with Eq. 2. Graphs in the bottom row on the right show mean values obtained from fitting the double-exponential plus constant function to the final decay of the fluo-4 transient. (C) Estimation of the SR Ca2+ content. Indo-1 resting saturation level was measured in control fibers and fibers down-expressing Panx1 challenged by repeated depolarizing pulses in the presence of CPA. An example of the corresponding time course of change in indo-1 saturation in a fiber from each group is shown on the left. Mean values are shown on the right (n = 12 fibers for both control and shPanx1 muscles from three distinct mice). Black bars and lines represent mCherry-expressing fibers and red bars and lines represent shPanx1-mCherry–expressing fibers. Data are expressed as mean ± SEM. *, P < 0.05. Nested analysis was performed in data from graphs shown in B.
Figure 6.
Figure 6.
Expression of shRNA against Pannexin-1 does not alter intramembrane charge movements in fibers down-expressing Pannexin-1. (A) Illustrative traces of intramembrane charge current, Q, normalized to the fiber’s capacitance (in nanocoulombs, nC, per microFarad, µF) in a control fiber (left) and a fiber down-expressing Panx1 (right). (B) The voltage dependence of the mean amount of charge in control fibers and fibers down-expressing Panx1. The inset shows good equality between on and off charges. (C) Mean values for the parameters obtained from fitting a Boltzmann function to the individual series of data points (n = 12 fibers for both control and shPanx1 muscles from four distinct mice). Black bars and lines represent mCherry-expressing fibers and red bars and lines represent shPanx1-mCherry–expressing fibers. Data are expressed as mean ± SEM.

References

    1. Al-Qusairi, L., Weiss N., Toussaint A., Berbey C., Messaddeq N., Kretz C., Sanoudou D., Beggs A.H., Allard B., Mandel J.-L., et al. 2009. T-tubule disorganization and defective excitation-contraction coupling in muscle fibers lacking myotubularin lipid phosphatase. Proc. Natl. Acad. Sci. USA. 106:18763–18768. 10.1073/pnas.0900705106 - DOI - PMC - PubMed
    1. Altamirano, F., Valladares D., Henríquez-Olguín C., Casas M., López J.R., Allen P.D., and Jaimovich E.. 2013. Nifedipine treatment reduces resting calcium concentration, oxidative and apoptotic gene expression, and improves muscle function in dystrophic mdx mice. PLoS One. 8:e81222. 10.1371/journal.pone.0081222 - DOI - PMC - PubMed
    1. Anderson, A.A., Altafaj X., Zheng Z., Wang Z.M., Delbono O., Ronjat M., Treves S., and Zorzato F.. 2006. The junctional SR protein JP-45 affects the functional expression of the voltage-dependent Ca2+ channel Cav1.1. J. Cell Sci. 119:2145–2155. 10.1242/jcs.02935 - DOI - PMC - PubMed
    1. Andronache, Z., Hamilton S.L., Dirksen R.T., and Melzer W.. 2009. A retrograde signal from RyR1 alters DHP receptor inactivation and limits window Ca2+ release in muscle fibers of Y522S RyR1 knock-in mice. Proc. Natl. Acad. Sci. USA. 106:4531–4536. 10.1073/pnas.0812661106 - DOI - PMC - PubMed
    1. Arias-Calderón, M., Almarza G., Díaz-Vegas A., Contreras-Ferrat A., Valladares D., Casas M., Toledo H., Jaimovich E., and Buvinic S.. 2016. Characterization of a multiprotein complex involved in excitation-transcription coupling of skeletal muscle. Skelet. Muscle. 6:15. 10.1186/s13395-016-0087-5 - DOI - PMC - PubMed

Publication types

MeSH terms

Substances

Grants and funding