. 2021 Dec;22(6):623-637.
doi: 10.1007/s10522-021-09940-z. Epub 2021 Oct 12.

Glycan characteristics of human heart constituent cells maintaining organ function: relatively stable glycan profiles in cellular senescence

Affiliations

Glycan characteristics of human heart constituent cells maintaining organ function: relatively stable glycan profiles in cellular senescence

Yoko Itakura et al. Biogerontology. 2021 Dec.

Abstract

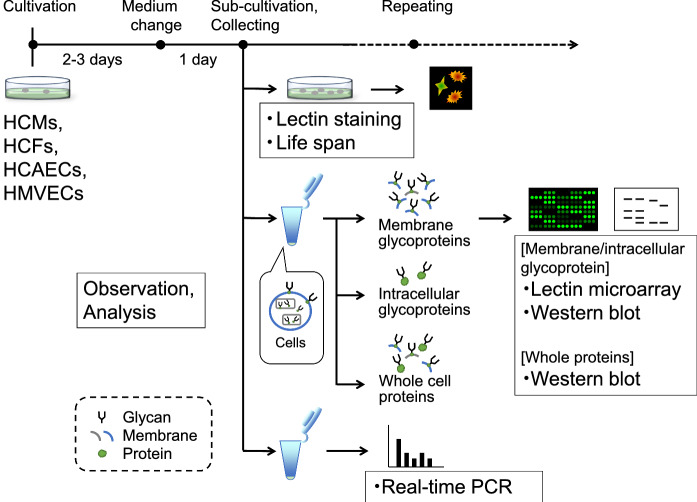
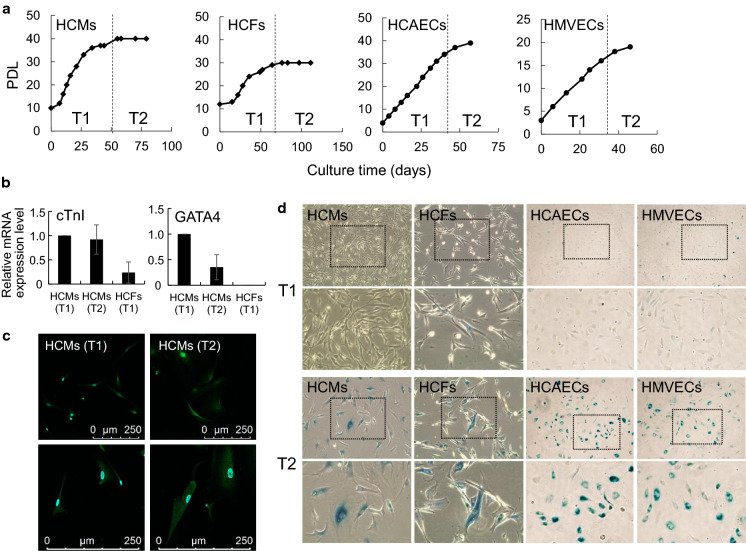
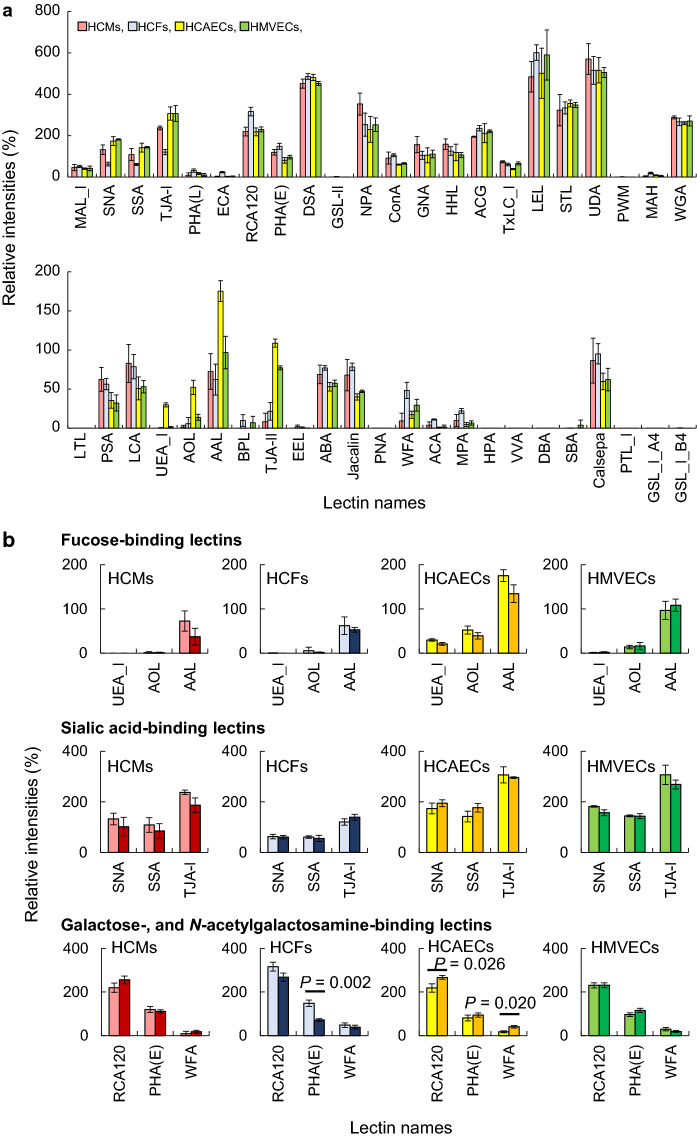
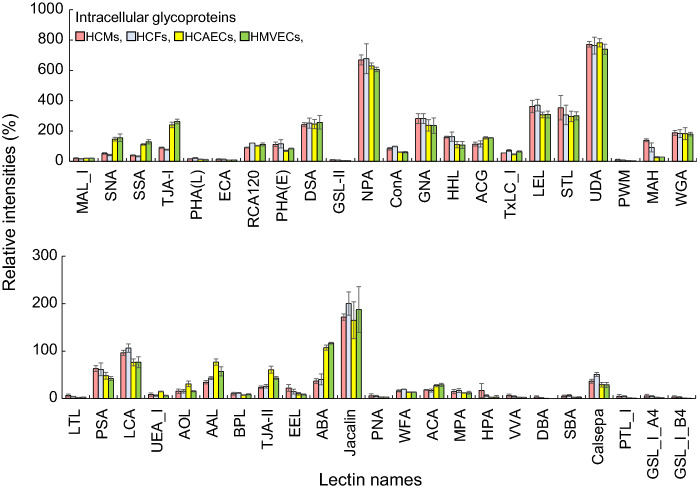
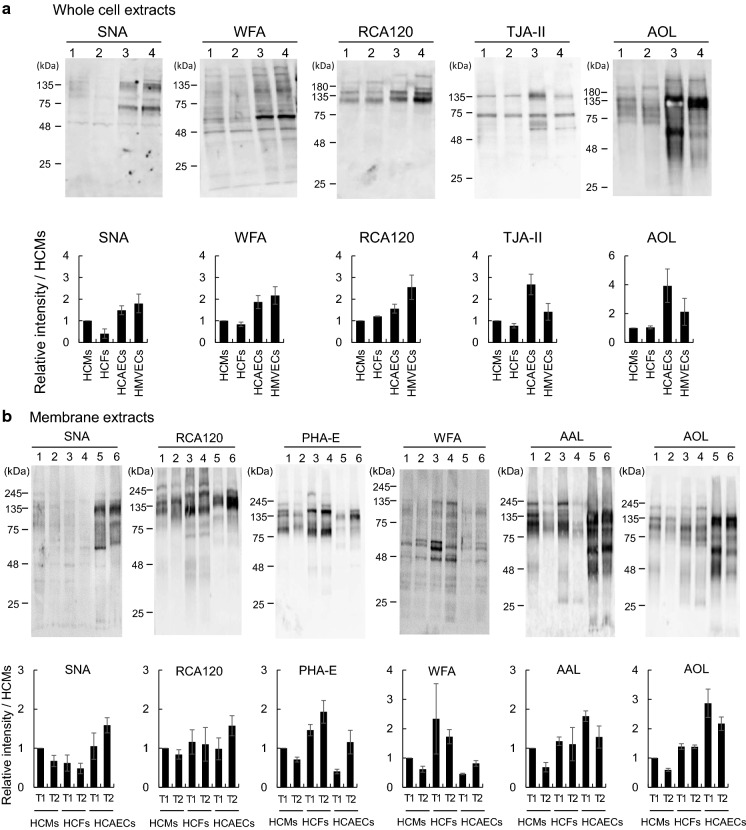
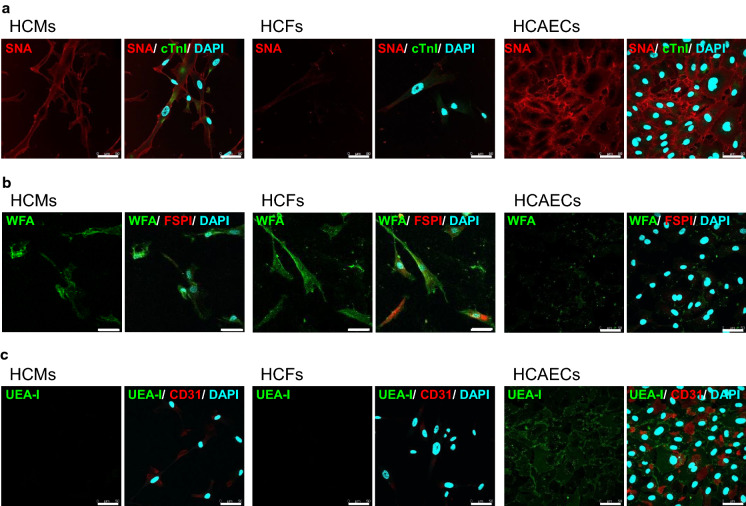
Cell surface glycoproteins, which are good indicators of cellular types and biological function; are suited for cell evaluation. Tissue remodeling using various cells is a key feature of regenerative therapy. For artificial heart remodeling, a mixture of heart constituent cells has been investigated for organ assembly, however, the cellular characteristics remain unclear. In this study, the glycan profiles of human cardiomyocytes (HCMs), human cardiac fibroblasts (HCFs), and human vascular endothelial cells (ECs) were analyzed using evanescent-field lectin microarray analysis, a tool of glycan profiling, to clarify the required cellular characteristics. We found that ECs had more "α1-2fucose" and "core α1-6fucose" residues than other cells, and that "α2-6sialic acid" residue was more abundant in ECs and HCMs than in HCFs. HCFs showed higher abundance of "β-galactose" and "β-N-acetylgalactosamine" residues on N-glycan and O-glycan, respectively, compared to other cells. Interestingly, cardiac glycan profiles were insignificantly changed with cellular senescence. The residues identified in this study may participate in organ maintenance by contributing to the preservation of glycan components. Therefore, future studies should investigate the roles of glycans in optimal tissue remodeling since identifying cellular characteristics is important for the development of regenerative therapies.

Keywords: Cardiac fibroblast; Cardiomyocyte; Cell surface protein; Glycan profile; Lectin microarray; Vascular endothelial cell.


Conflict of interest statement

The authors declare no conflicts of interest.

Figures

Fig. 1
Fig. 1
Schematic illustration of cellular characteristics analysis
Fig. 2
Fig. 2
Cellular characteristics of human heart constituent cells (HCMs, HCFs, HCAECs, and HMVECs). a The representative proliferations of each cell line (HCMs, HCFs, HCAECs, and HMVECs) are shown as PDLs. Two phases were separated into growth phase (T1) and growth arrest (T2) for each cell line. b Comparison of HCMs with HCFs in gene expression of cardiomyocyte markers (cTnI and GATA4). Bar graph representing the relative expression level with reference to GAPDH at T1 and T2. The data are presented as the mean ± SD (n = 3). c Protein expression of the characteristic marker (cTnI) in cardiomyocytes. HCMs at T1 (left) and T2 (right) are shown with a cardiomyocyte marker (cTnI, green), and nucleus (DAPI, blue) as the overlay image. The bottom panels show a magnified image. Scale bar = 250 μm. d HCMs, HCFs, HCAECs, and HMVECs at T1 and those at T2 are shown with SA-β-galactosidase. The bottom panels show a magnified image of the squared area in the upper panels (× 10). All cultures were performed in biological triplicate
Fig. 3
Fig. 3
Membrane glycan profiles in HCMs, HCFs, HCAECs, and HMVECs, analyzed using lectin microarray. a Bar graphs representing the signal intensities (%) for 45 lectins in HCMs (red), HCFs (blue), HCAECs (yellow), and HMVECs (green) at T1 (growth phase). The data are presented as the mean ± SD (n = 3). b Bar graphs representing the signal intensities (%) in HCMs (red), HCFs (blue), HCAECs (yellow), and HMVECs (green) at T1 (growth phase; light color) and T2 (growth arrest; dark color). The selected signal intensities of four binding-type (fucose, sialic acid, galactose, and N-acetylgalactosamine) lectins were observed (P < 0.05 between T1 and T2 based on Student’s t-tests). The glycan profiles of 45 lectins are shown in Supplemental Fig. S1. The data are presented as the mean ± SD (n = 3). The characteristics of the 45 lectins and the values of the signal intensities obtained in this analysis are shown in Supplemental Tables S1 and S2, respectively. The data of T1 in b are same as in a. All experiments were performed in triplicate
Fig. 4
Fig. 4
Intracellular glycan profiles in HCMs, HCFs, HCAECs, and HMVECs, analyzed using lectin microarray. Bar graph representing the signal intensities (%) of 45 lectins in HCMs (red), HCFs (blue), HCAECs (yellow), and HMVECs (green) at T1 (growth phase). The data are presented as the mean ± SD (n = 3). The characteristics of the 45 lectins and the values of the signal intensities obtained in this analysis are shown in Supplemental Tables S1 and S3, respectively. All experiments were performed in triplicate
Fig. 5
Fig. 5
Lectin blot detection of whole cell and membrane extracts from heart constituent cells. a Whole cell extracts from HCMs, HCFs, HCAECs, and HMVECs were applied to lanes 1–4, respectively and were subjected to lectin blot analysis using biotinylated-SNA, -WFA, -RCA120, -TJA-II, and -AOL. b The membrane extracts from HCMs, HCFs, and HCAECs at T1 (growth phase) and the corresponding extracts at T2 (growth arrest) were applied to lanes 1, 3, 5 and 2, 4, 6, respectively and were subjected to lectin blot analysis using biotinylated-SNA, -RCA120, -PHA-E, -WFA, -AAL, and -AOL. Bar graph representing the bands for each lane after normalization to HCMs using the Fusion system. All experiments were performed with repetition. The data are presented as the mean ± SD (n = 3)
Fig. 6
Fig. 6
Localization of characterized glycans in heart constituent cells. HCMs (left), HCFs (middle), and HCAECs (right) at T1 stained with each of the characteristic lectins and cell characterizing markers. a Three cell types stained with SNA (red) and the overlay image (cTnI, green; right panel). b Three cell types stained with WFA (green) and the overlay image (FSP1, red; right panel). c Three cell types stained with UEA-I (green) and the overlay image (CD31, red; right panel). Blue staining represents the nucleus. Scale bar = 50 μm. All experiments were performed with repetition

Similar articles

Cited by

References

    1. Alvarez-Manilla G, Warren NL, Atwood J, Orlando R, Dalton S, Pierce M. Glycoproteomic analysis of embryonic stem cells: identification of potential glycobiomarkers using lectin affinity chromatography of glycopeptides. J Proteome Res. 2010;9:2062–2075. doi: 10.1021/pr8007489. - DOI - PMC - PubMed
    1. Amano M, et al. Threshold in stage-specific embryonic glycotypes uncovered by a full portrait of dynamic N-glycan expression during cell differentiation. Mol Cell Proteomics. 2010;9:523–537. doi: 10.1074/mcp.M900559-MCP200. - DOI - PMC - PubMed
    1. Childs BG, Li H, van Deursen JM. Senescent cells: a therapeutic target for cardiovascular disease. J Clin Invest. 2018;128:1217–1228. doi: 10.1172/JCI95146. - DOI - PMC - PubMed
    1. Demoor M, et al. Cartilage tissue engineering: molecular control of chondrocyte differentiation for proper cartilage matrix reconstruction. Biochim Biophys Acta. 2014;1840:2414–2440. doi: 10.1016/j.bbagen.2014.02.030. - DOI - PubMed
    1. Geng X, et al. Interfacial tissue engineering of heart regenerative medicine based on soft cell-porous scaffolds. J Thorac Dis. 2018;10:S2333–S2345. doi: 10.21037/jtd.2018.01.117. - DOI - PMC - PubMed

Publication types

LinkOut - more resources