. 2022 Mar;38(3):303-317.
doi: 10.1007/s12264-021-00778-6. Epub 2021 Oct 12.

MouseVenue3D: A Markerless Three-Dimension Behavioral Tracking System for Matching Two-Photon Brain Imaging in Free-Moving Mice

Affiliations

MouseVenue3D: A Markerless Three-Dimension Behavioral Tracking System for Matching Two-Photon Brain Imaging in Free-Moving Mice

Yaning Han et al. Neurosci Bull. 2022 Mar.

Abstract

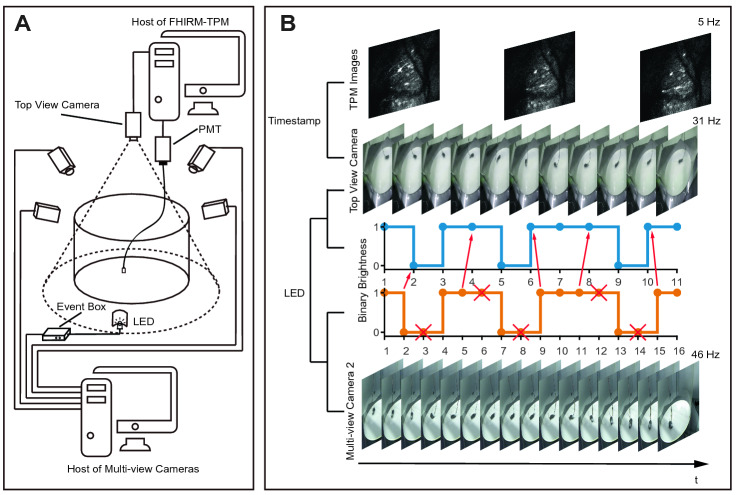
Understanding the connection between brain and behavior in animals requires precise monitoring of their behaviors in three-dimensional (3-D) space. However, there is no available three-dimensional behavior capture system that focuses on rodents. Here, we present MouseVenue3D, an automated and low-cost system for the efficient capture of 3-D skeleton trajectories in markerless rodents. We improved the most time-consuming step in 3-D behavior capturing by developing an automatic calibration module. Then, we validated this process in behavior recognition tasks, and showed that 3-D behavioral data achieved higher accuracy than 2-D data. Subsequently, MouseVenue3D was combined with fast high-resolution miniature two-photon microscopy for synchronous neural recording and behavioral tracking in the freely-moving mouse. Finally, we successfully decoded spontaneous neuronal activity from the 3-D behavior of mice. Our findings reveal that subtle, spontaneous behavior modules are strongly correlated with spontaneous neuronal activity patterns.

Keywords: 3-D pose estimation; Automatic calibration; Behavioral and neural recording; Computational neuroethology; Multi-view cameras.


Conflict of interest statement

All authors claim that there are no conflicts of interest.

Figures

Fig. 1
Fig. 1
Workflow of MouseVenue3D. A Hardware structure and software framework for automatic calibration of MouseVenue3D (blue arrows, direction of movement of the screen; red arrows, direction of movement of the checkerboard displayed on the screen). B Mouse motion capture by MouseVenue3D using four cameras without influencing fiber movement. C High-dimensional behavioral and neural recording using MouseVenue3D with fast high-resolution miniature two-photon microscopy.
Fig. 2
Fig. 2
Synchronization of MouseVenue3D and FHIRM-TPM. A Hardware connections of FHIRM-TPM and MouseVenue3D. The host FHIRM-TPM controls the top-view camera, photomultiplier (PMT), and other TPM imaging hardware to capture single-view behavior synchronized with neuronal TPM images. The host of multi-view cameras controls four cameras and one event box. The event box converts serial signals to logic-level signals to control the LED. B Timing sequence of synchronization. FHIRM-TPM captures neuronal activities by TPM images (top) and mouse behavior by frames of the top-view camera (second line). TPM images are synchronized with frames of the top-view camera by the timestamp of the operating system. The top-view camera and one of the multi-view cameras (bottom) capture the LED brightness ( third and fourth lines), which detects periodic flickers according to a linear frequency-modulated pulse signal (red arrows, matched frames of the multi-view and top-view cameras; red crosses, frames to be deleted). FHIRM-TPM, fast high-resolution miniature two-photon microscopy; PMT, photomultiplier; LED, light-emitting diode.
Fig. 3
Fig. 3
Low-dimensional representations of 3-D and 2-D poses using UMAP. A UMAP embedding for 3-D behavior poses. B UMAP embedding for 2-D behavior poses. C Silhouette coefficients of 3-D and 2-D behavior poses in UMAP with different clustering numbers (paired t-test, ****P <0.0001, n = 16). UMAP, Uniform Manifold Approximation and Projection.
Fig. 4
Fig. 4
Statistical characters of manually-labeled behaviors. A Mean skeletons of five manually-labeled behaviors illustrated in x and y coordinates (top) and x and z coordinates (bottom). B Standard deviation of each body point in x (top), y (middle), and z (bottom) coordinates. C Correlations and liner regressions of the principal component (PC) of X, Y, and Z trajectories. The two first PCs of each behavior are normalized for each comparison. CC, correlation coefficient; R2, coefficient of determination.
Fig. 5
Fig. 5
Supervised behavior recognition results of 3-D and 2-D behavior poses. A, B Accuracy curves (A) and loss curves (B) of 3-D and 2-D data trained and validated by the supervised learning method BiLSTM. C, D CMs of 3-D (C) and 2-D (D) behavior trajectories. BiLSTM, bidirectional long short-term memory; CM, confusion matrix.
Fig. 6
Fig. 6
A demonstration of combining MouseVenue3D with FHIRM-TPM. A Average image of FHIRM-TPM after registration by suite2p. B Ninety-five neurons from M2 extracted by suite2p. C Neuronal activity of 95 neurons sorted vertically by mean values before showing in Z-score values. D 3D behavior trajectories from nose to tail (nose, left ear, right ear, neck, left front limb, right front limb, left hind limb, right hind limb, left front paw, right front paw, left hind paw, right hind paw, back, root tail, middle tail, and tip tail). The curves ae sorted in the sequences of X, Y, and Z coordinates. E Behavioral decomposition by BeA. A total of 8 clusters of different behaviors are detected, with 146 movement segmentations. F Artificial identification of 8 behavioral phenotypes. FHIRM-TPM, fast high-resolution miniature two-photon microscopy; BeA, Behavior Atlas.
Fig. 7
Fig. 7
A demonstration of high-dimensional behavioral and neural decoding. A DTAK matrix of 146 movement segmentations. B Movement space merging UMAP for DTAK matrix and velocity dimension of movements of BeA. C DTAK matrix of 146 neuronal activity segmentations corresponding to 146 movements. D UMAP embedding of DTAK matrix of neuronal activities. E DTAK matrix of 146 time-shuffled neuronal activity segmentations corresponding to 146 movements. F UMAP embedding of DTAK matrix of time-shuffled neuronal activities. G Temporal transition trajectories of behavior in movement space (black line, transitions in the same clusters of movements; colored line, transitions between different clusters of movements; colors of trajectories are the same as those of previous movements). H Temporal transition trajectories of neuronal activities in UMAP space of neurons (black line, transitions in the same clusters of neuronal activities; colored line, transitions between different clusters of neuronal activities; colors of trajectories are the same as those of previous neuronal activities). I Correlations and linear regressions of the DTAK structures of A with C (orange dots and red line, CC = 0.12935 and R2 = 0.016733, y = 0.11982x + 0.68632) and E (light blue dots and blue line, CC = 0.02903 and R2 = 0.00084276, y = 0.056433x + 0.43775). The DTAK structures are calculated by the derivation of the first principal component of the DTAK matrix. J Correlations and liner regressions of trajectories in G and H. The correlations and linear regressions are calculated after normalization. K Silhouette coefficients of D and F (Mann–Whitney test, ****P <0.0001, n = 146). L Distance comparison of transitions in the same and between different clusters of movements (Mann–Whitney test, ****P <0.0001, n = 121 inner and 25 transition). M Distance comparison of transitions in the same and between different clusters of neuronal activities (Mann–Whitney test, n.s., no significant difference, P = 0.3879, n = 121 inner and 25 transition). DTAK, dynamic time alignment kernel; UMAP, Uniform Manifold Approximation and Projection; BeA, Behavior Atlas; DIST, Distance between two neighboring data; CC ratio, correlation coefficient ratio of orange dots to light blue dots; R2 ratio, coefficient of determination ratio of red line to blue line; CC, correlation coefficient; R2, coefficient of determination.

Similar articles

Cited by

References

    1. Datta SR, Anderson DJ, Branson K, Perona P, Leifer A. Computational neuroethology: A call to action. Neuron. 2019;104:11–24. - PMC - PubMed
    1. Mathis MW, Mathis A. Deep learning tools for the measurement of animal behavior in neuroscience. Curr Opin Neurobiol. 2020;60:1–11. - PubMed
    1. Bala PC, Eisenreich BR, Yoo SBM, Hayden BY, Park HS, Zimmermann J. Automated markerless pose estimation in freely moving macaques with OpenMonkeyStudio. Nat Commun. 2020;11:4560. - PMC - PubMed
    1. Xia F, Kheirbek MA. Circuit-based biomarkers for mood and anxiety disorders. Trends Neurosci. 2020;43:902–915. - PMC - PubMed
    1. Wiltschko AB, Tsukahara T, Zeine A, Anyoha R, Gillis WF, Markowitz JE, et al. Revealing the structure of pharmacobehavioral space through motion sequencing. Nat Neurosci. 2020;23:1433–1443. - PMC - PubMed

LinkOut - more resources