. 2022 Jul;40(7):1632-1644.
doi: 10.1002/jor.25187. Epub 2021 Oct 20.

Compositional evaluation of lesion and parent bone in patients with juvenile osteochondritis dissecans of the knee using T2 * mapping

Affiliations

Compositional evaluation of lesion and parent bone in patients with juvenile osteochondritis dissecans of the knee using T2 * mapping

Štefan Zbýň et al. J Orthop Res. 2022 Jul.

Abstract

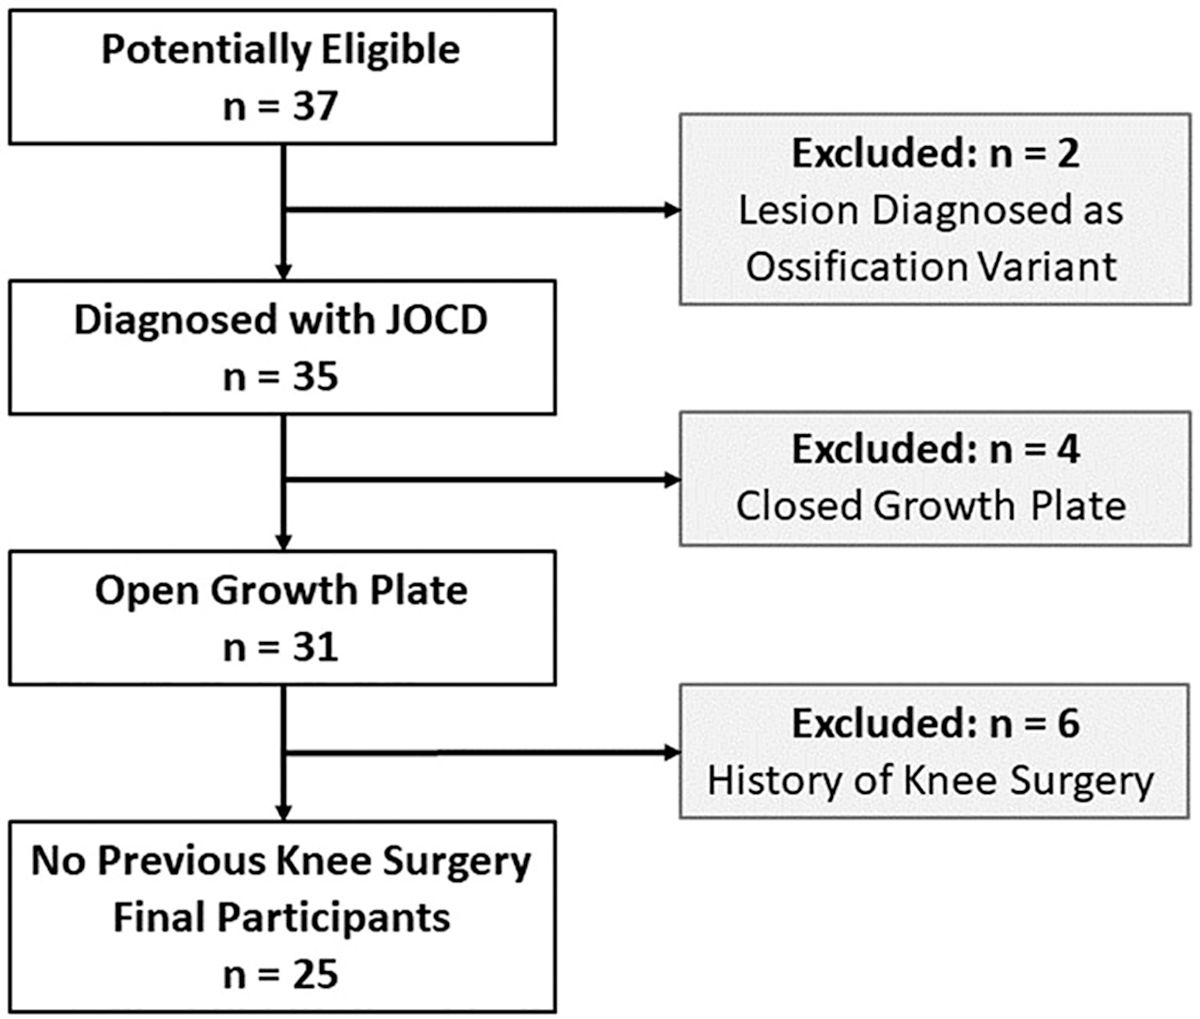
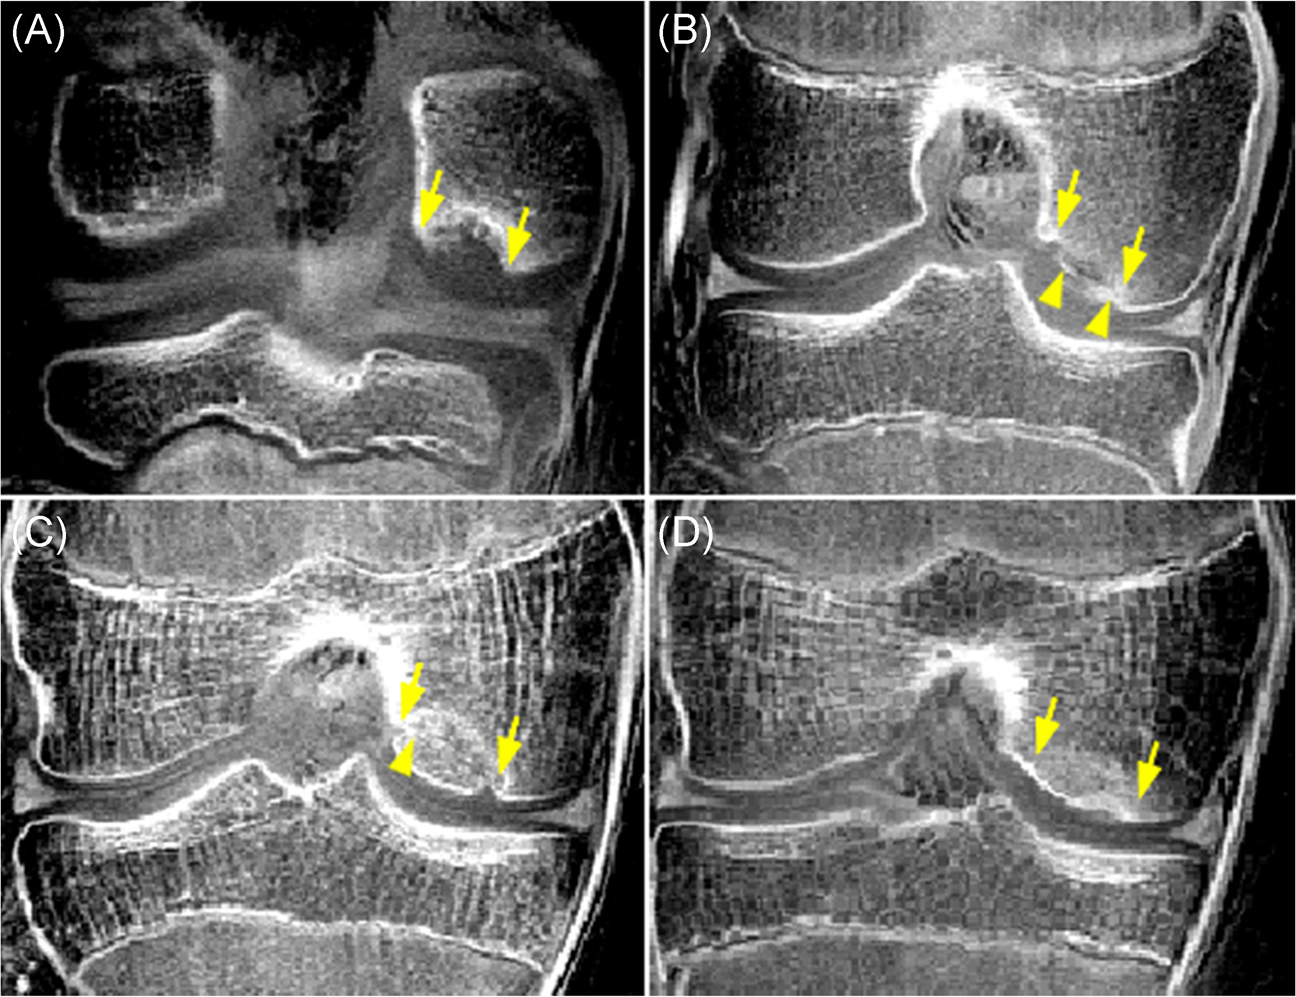
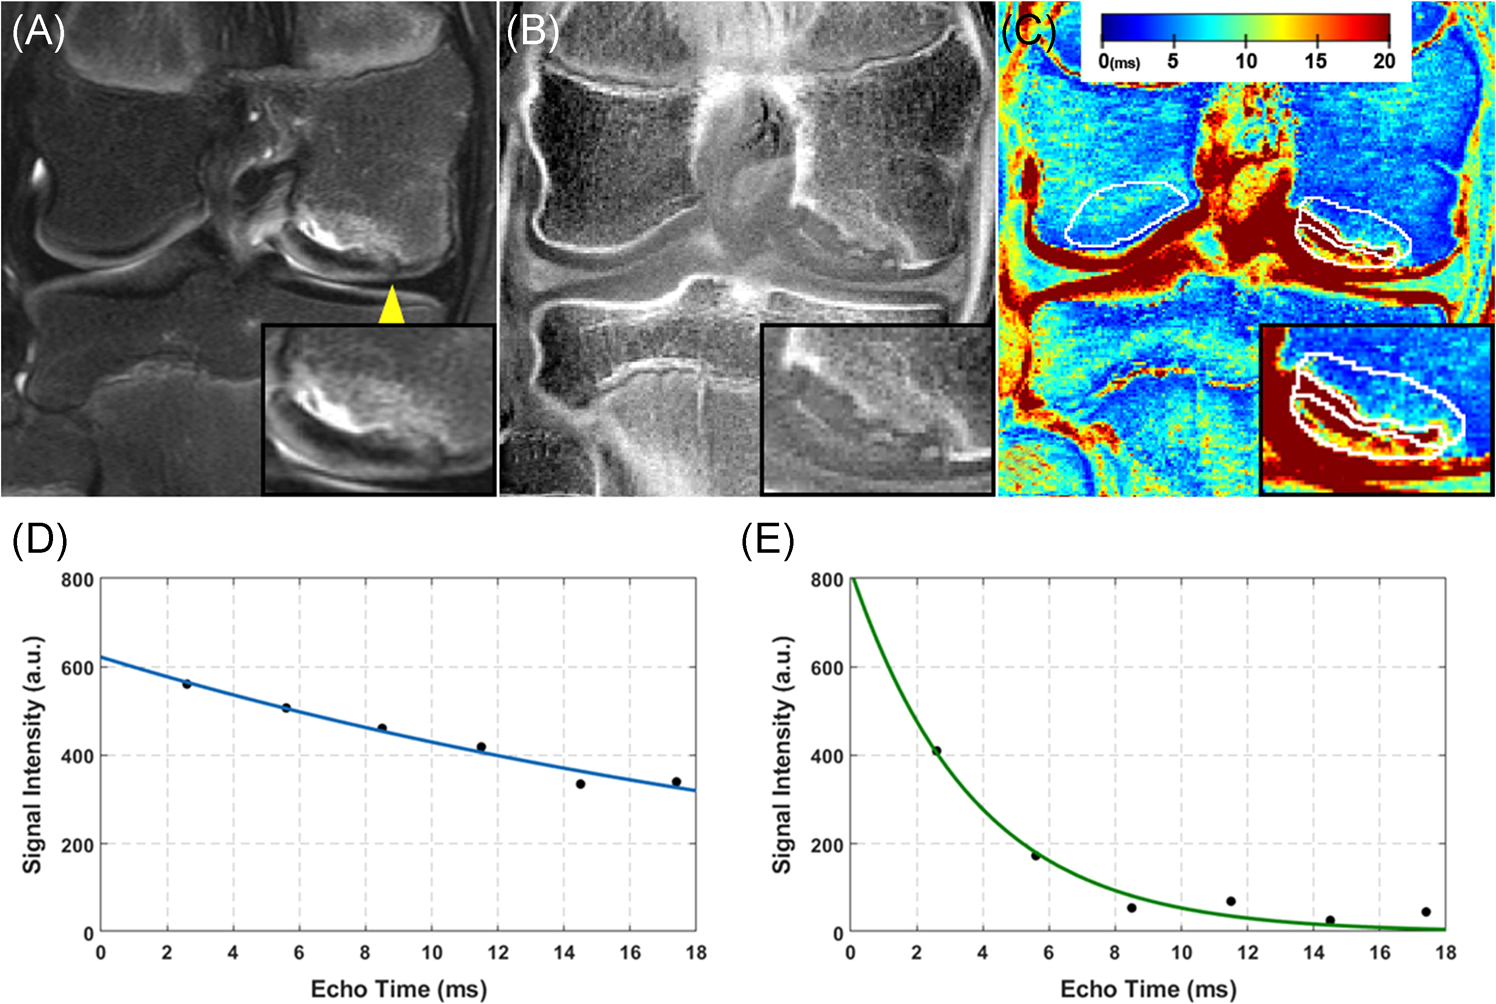
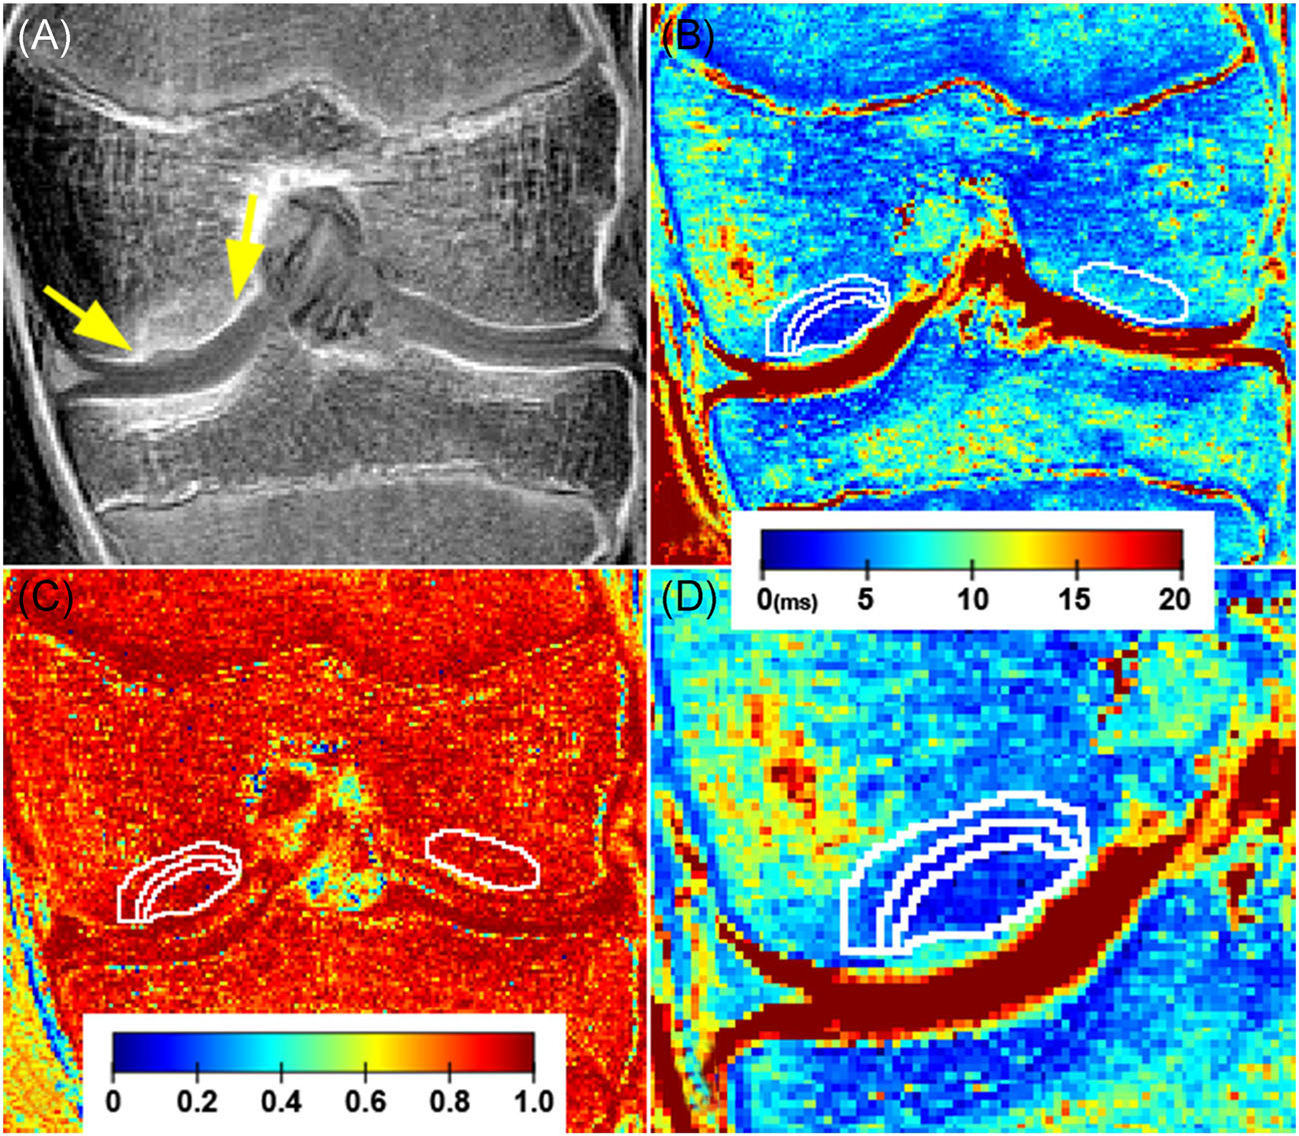
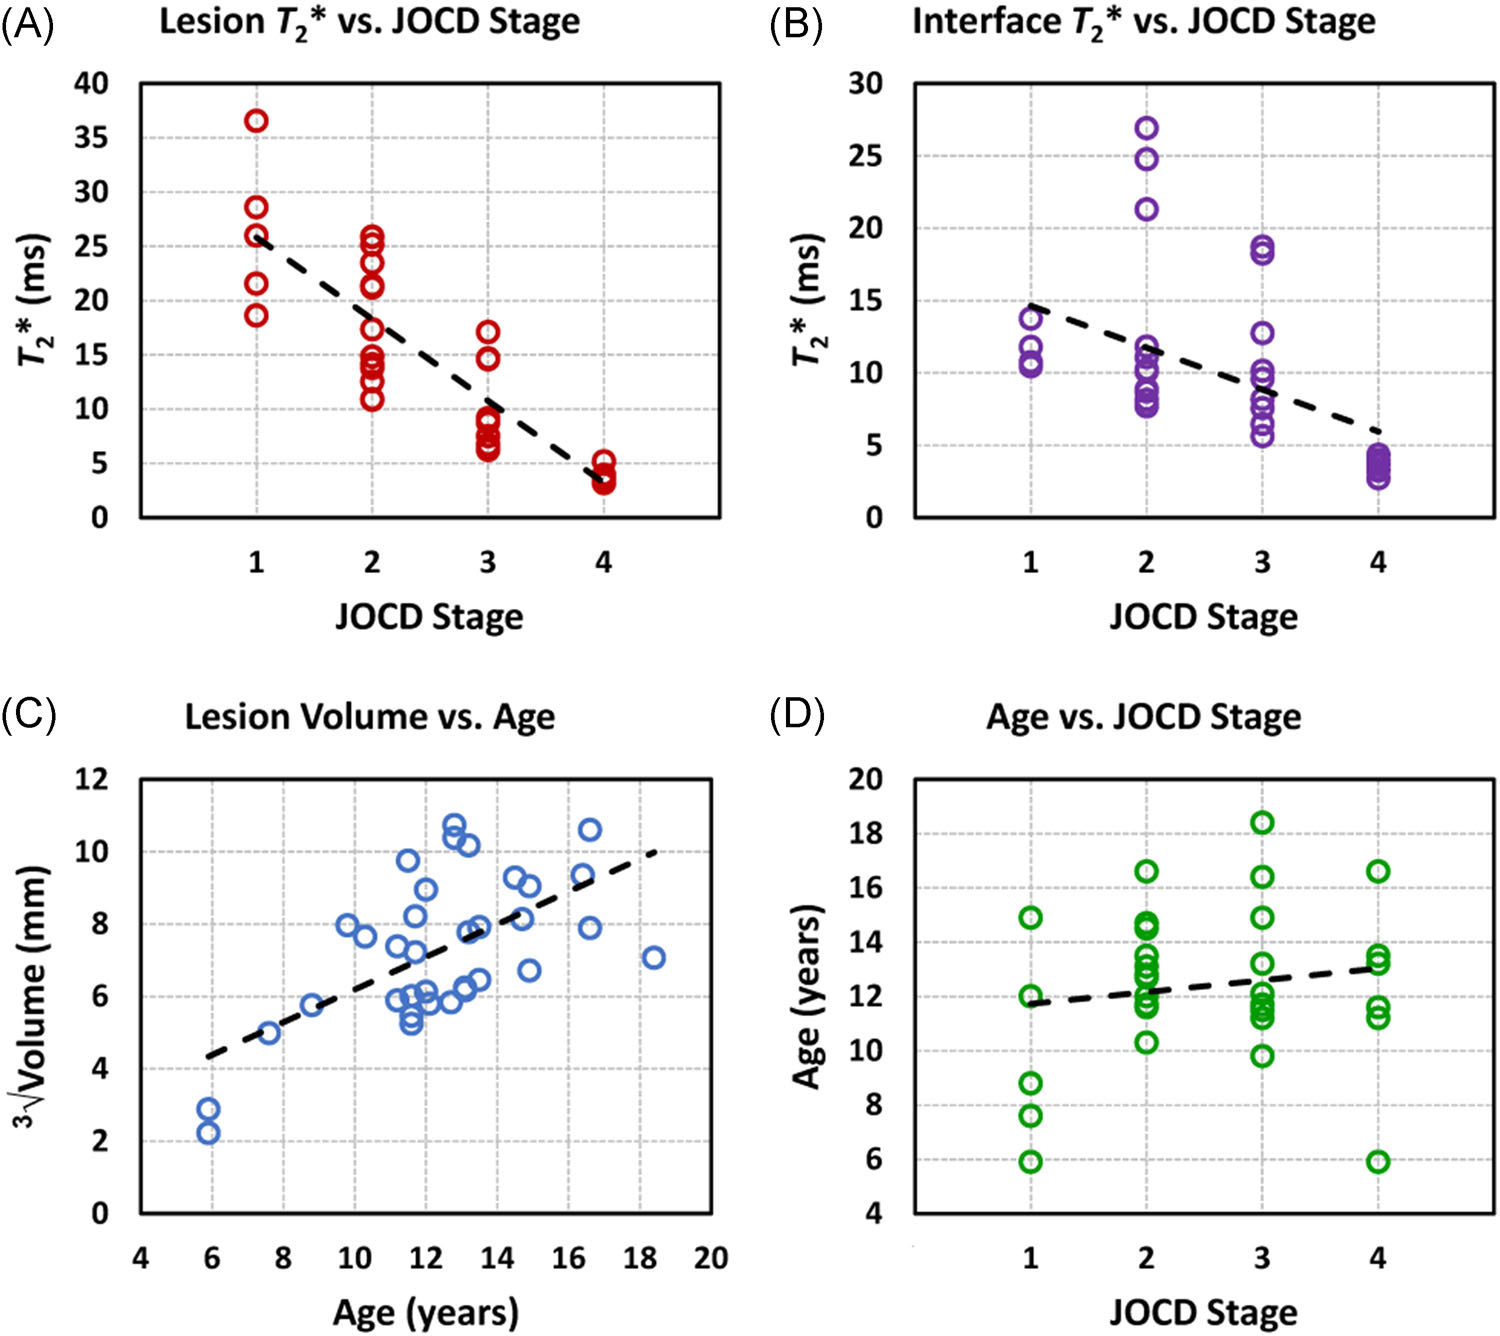
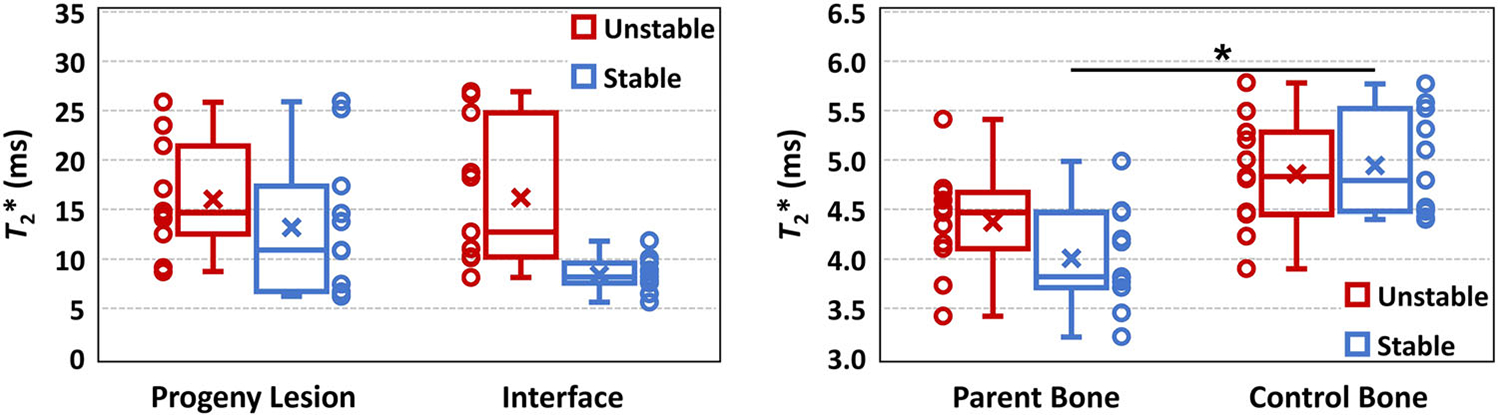
Juvenile osteochondritis dissecans (JOCD) lesions contain cartilaginous, fibrous and osseous tissues which are difficult to distinguish with clinical, morphological magnetic resonance imaging (MRI). Quantitative T2 * mapping has earlier been used to evaluate microstructure and composition of all aforementioned tissues as well as bone mineral density. However, the ability of T2 * mapping to detect changes in tissue composition between different JOCD lesion regions, different disease stages, and between stable and unstable lesions has not been demonstrated. This study analyzed morphological and T2 * MRI data from 25 patients (median age, 12.1 years) with 34 JOCD-affected and 13 healthy knees. Each lesion was assigned a stage reflecting the natural history of JOCD, with stages I and IV representing early and healed lesion, respectively. T2 * values were evaluated within the progeny lesion, interface and parent bone of each lesion and in the control bone region. T2 * was negatively correlated with JOCD stage in progeny lesion (ρ = -0.871; p < 0.001) and interface regions (ρ = -0.649; p < 0.001). Stage IV progeny showed significantly lower T2 * than control bone (p = 0.028). T2 * was significantly lower in parent bone than in control bone of patients with stable lesions (p = 0.009), but not in patients with unstable lesions (p = 0.14). Clinical significance: T2 * mapping enables differentiation between different stages of JOCD and quantitative measurement of the ossification degree in progeny lesion and interface. The observed T2 * decrease in healed and stable lesions may indicate increased bone density as a result of the active repair process. T2 * mapping provides quantitative information about JOCD lesion composition.

Keywords: T2*; compositional magnetic resonance imaging; juvenile osteochondritis dissecans; knee joint; trabecular bone.


Figures

FIGURE 1
FIGURE 1
Flowchart of study population
FIGURE 2
FIGURE 2
A qualitative depiction of osseous tissues in JOCD lesions (between arrows) on the morphological, short echo time GRE images with CT-like contrast showing different stages of disease. (a) A 12-year-old boy with a stage I, cartilaginous-only lesion. (b) A 12-year-old girl with a stage II lesion showing ossification of the progeny rim (arrow heads). (c) A 14-year-old boy with a stage III, predominantly osseous progeny with a partial osseous bridging to parent bone (arrow head). (d) A 13-year-old girl with a stage IV, osseous, healed lesion. All lesions are located on the medial femoral condyle [Color figure can be viewed at wileyonlinelibrary.com]
FIGURE 3
FIGURE 3
An example of manual segmentations of the four evaluated regions on MR images of a 14-year-old boy with a stable, stage III JOCD lesion on the medial femoral condyle. (a) The T2-weighted turbo spin echo image with fat suppression depicts the position of progeny lesion (between arrows) and interface as well as hyperintense edema in the parent bone (asterisks). (b) The T1-weighted turbo spin echo image is showing a parent bone region with the replacement of normal fatty marrow (between arrows). (c) All four evaluated regions were selected on the first echo of the T2*-weighted MR images. Three regions were part of the JOCD lesion complex: progeny lesion (red), interface (yellow) and parent bone (green). Additionally a control bone region (blue) served as a reference. (d) A higher magnification view of the JOCD lesion area showing progeny lesion, interface and parent bone detail. (e) Segmented regions (white contours) overlaid on the color-coded T2* map; the color bar represents T2* values in milliseconds. (f) The color-coded coefficient-of-determination (R2) map with four segmented regions (white contours); the color bar represents R2 values [Color figure can be viewed at wileyonlinelibrary.com]
FIGURE 4
FIGURE 4
A 12-year-old girl with a stage II unstable JOCD lesion on the medial femoral condyle. (a) The T2-weighted turbo spin echo images with fat suppression depict the lesion location, a hyperintense area of edema in the parent bone, a fluid-like high signal rim in the interface and a break in the articular cartilage and the subchondral bone plate (arrowhead). (b) Short echo time gradient echo image with CT-like contrast showing a high signal of the progeny rim ossification and a low signal of cartilaginous areas in the progeny lesion and interface. (c) The corresponding color-coded T2* map with four selected regions (white contours). Please note the parent bone with lower T2* (blue areas) compared to the control bone region on the opposite condyle which may indicate a decrease in bone density in the parent bone. Additionally, T2* map reflects the heterogeneous composition of progeny lesion region with high T2* areas (red) being composed predominantly of cartilaginous tissue and low T2* areas (green and blue) of osseous tissues. A higher magnification image of the JOCD lesion area is shown in the lower right corner of each image. The color bar represents T2* values in milliseconds. (d) A plot showing a representative T2* fit (blue line) of signal intensities (black points) as a function of echo time from a single pixel situated in the cartilaginous tissue in the progeny lesion shown in (a–c) (fitted T2* = 27.1 ms; goodness of fit (R2) = 0.963). (e) A representative T2* fit of signal intensities as a function of echo time from a single pixel situated in the osseous area of progeny lesion shown in (a–c) (fitted T2* = 3.7 ms; R2 = 0.959). Please note the faster decay of signal intensities with echo time and therefore shorter T2* when compared to the fit illustrated in (d) [Color figure can be viewed at wileyonlinelibrary.com]
FIGURE 5
FIGURE 5
A 13-year-old girl with a healed, stage IV JOCD lesion on the medial femoral condyle. (a) The first echo of the T2*-weighted MR images with CT-like contrast showing osseous, healed lesion (between arrows). (b) The corresponding color-coded T2* map with four selected regions in white contours: progeny lesion, interface, parent bone, and control bone on opposite condyle. Note the lower T2* values in the progeny lesion than in the control bone region; the color bar represents T2* values in milliseconds. (c) The color-coded coefficient-of-determination (R2) map shows high agreement (close to 1) between the measured data and the exponential fit in all four evaluated regions (white contours); the color bar represents dimensionless R2 values. (d) A zoomed-in depiction of the JOCD lesion area on T2* map showing detail of progeny lesion, interface and parent bone; the color bar represents T2* values in milliseconds [Color figure can be viewed at wileyonlinelibrary.com]
FIGURE 6
FIGURE 6
Regression analysis plots. (a) A significant negative spearman rank correlation (ρ) was observed between the progeny lesion T2* and the JOCD stage (ρ = −0.871; 95% confidence interval = −0.936, −0.732; p < 0.001). (b) A significant negative correlation was found between the interface T2* and the JOCD stage (ρ = −0.649; 95% confidence interval = −0.834, −0.346; p < 0.001). (c) A significant positive correlation was observed between the progeny volume and the patient’s age (ρ = 0.534; 95% confidence interval = 0.123, 0.753; p = 0.001). The high median T2* values (>15 ms) in the interface at JOCD stages II and III can be explained by the presence of fluid in the interface which was detected with clinical, morphological MRI in eight unstable lesions. (d) The spearman rank correlation did not show any significant association between the patient’s age and the JOCD stage (ρ = 0.081; 95% confidence interval = −0.331, 0.477; p = 0.65) [Color figure can be viewed at wileyonlinelibrary.com]
FIGURE 7
FIGURE 7
Box plots of median T2* from progeny lesion, interface, parent bone and control bone regions of eleven stable and eleven unstable JOCD lesions. Data points for each group and region are shown next to the corresponding box plot. The mixed effects regression models, with age, sex and progeny volume as covariates and adjustment for within-subject variability found significantly lower T2* values in parent bone than in control bone in stable lesions (p = 0.009). The high variability of T2* values in the interface of unstable lesion, when compared to stable lesions, is likely due to the presence of fluid detected in 8 of 9 unstable lesions. In each box plot, the cross represents the mean T2* value and the central horizontal line the median T2* value of the evaluated region. The upper and lower whiskers extend to the maximum and minimum T2* values in the region, respectively. The upper and lower borders of the box represent the third quartile (i.e., 75th percentile) and the first quartile (i.e., 25th percentile) of the T2* data within the region, respectively [Color figure can be viewed at wileyonlinelibrary.com]

References

    1. Laor T, Zbojniewicz AM, Eismann EA, Wall EJ. Juvenile osteochondritis dissecans: is it a growth disturbance of the secondary physis of the epiphysis? AJR Am J Roentgenol. 2012;199:1121–1128. - PubMed
    1. Ellermann J, Johnson CP, Wang L, Macalena JA, Nelson BJ, LaPrade RF. Insights into the epiphyseal cartilage origin and subsequent osseous manifestation of juvenile osteochondritis dissecans with a modified clinical MR imaging protocol: a pilot study. Radiology. 2017;282:798–806. - PubMed
    1. Gorbachova T, Melenevsky Y, Cohen M, Cerniglia BW. Osteochondral lesions of the knee: differentiating the most common entities at MRI. Radiographics. 2018;38:1478–1495. - PubMed
    1. Kijowski R, Blankenbaker DG, Shinki K, Fine JP, Graf BK, De Smet AA. Juvenile versus adult osteochondritis dissecans of the knee: appropriate MR imaging criteria for instability. Radiology. 2008;248:571–578. - PubMed
    1. Kessler JI, Nikizad H, Shea KG, Jacobs JC Jr, Bebchuk JD, Weiss JM. The demographics and epidemiology of osteochondritis dissecans of the knee in children and adolescents. Am J Sports Med. 2014;42:320–326. - PubMed

Publication types