. 2022 Jan;37(1):80-94.
doi: 10.1002/mds.28810. Epub 2021 Oct 12.

Parkinson's Disease Phenotypes in Patient Neuronal Cultures and Brain Organoids Improved by 2-Hydroxypropyl-β-Cyclodextrin Treatment

Affiliations

Parkinson's Disease Phenotypes in Patient Neuronal Cultures and Brain Organoids Improved by 2-Hydroxypropyl-β-Cyclodextrin Treatment

Javier Jarazo et al. Mov Disord. 2022 Jan.

Abstract

Background: The etiology of Parkinson's disease (PD) is only partially understood despite the fact that environmental causes, risk factors, and specific gene mutations are contributors to the disease. Biallelic mutations in the phosphatase and tensin homolog (PTEN)-induced putative kinase 1 (PINK1) gene involved in mitochondrial homeostasis, vesicle trafficking, and autophagy are sufficient to cause PD.

Objectives: We sought to evaluate the difference between controls' and PINK1 patients' derived neurons in their transition from neuroepithelial stem cells to neurons, allowing us to identify potential pathways to target with repurposed compounds.

Methods: Using two-dimensional and three-dimensional models of patients' derived neurons we recapitulated PD-related phenotypes. We introduced the usage of midbrain organoids for testing compounds. Using Clustered Regularly Interspaced Short Palindromic Repeats (CRISPR)/CRISPR-associated protein 9 (Cas9), we corrected the point mutations of three patients' derived cells. We evaluated the effect of the selected compound in a mouse model.

Results: PD patient-derived cells presented differences in their energetic profile, imbalanced proliferation, apoptosis, mitophagy, and a reduced differentiation efficiency to tyrosine hydroxylase positive (TH+) neurons compared to controls' cells. Correction of a patient's point mutation ameliorated the metabolic properties and neuronal firing rates as well as reversing the differentiation phenotype, and reducing the increased astrocytic levels. Treatment with 2-hydroxypropyl-β-cyclodextrin increased the autophagy and mitophagy capacity of neurons concomitant with an improved dopaminergic differentiation of patient-specific neurons in midbrain organoids and ameliorated neurotoxicity in a mouse model.

Conclusion: We show that treatment with a repurposed compound is sufficient for restoring the impaired dopaminergic differentiation of PD patient-derived cells. © 2021 The Authors. Movement Disorders published by Wiley Periodicals LLC on behalf of International Parkinson and Movement Disorder Society.

Keywords: PINK1; Parkinson's disease; cyclodextrin; isogenics; organoids.


Figures

FIG 1
FIG 1
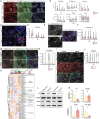
Impaired differentiation of neural stem cells of patient carrying PINK1 mutations. (A) Images representing the median values of a 14‐day differentiation neuronal two‐dimensional culture of controls and patients groups. Raw images of the markers tyrosine hydroxylase (TH), Tubulin Beta 3 Class III (TUBB3), and Hoechst are presented with its respective perimeter mask and a zoomed region (scale bar = 100 μm). (B) Quantification of TH, TUBB3, and Hoechst at time points 7, 14, and 21 after the induction of differentiation. Pixel quantification (lower panel) with their respective ratios (upper panel). Acquisition was performed at 20× sampling randomly 15 fields per well. Five wells of controls and five wells of patients were acquired per replicate. Total fields of controls (fc) and fields of patients (fp) analyzed time points 7 (fc = 219; fp = 215), 14 (fc = 209; fp = 219), and 21 (fc = 207; fp = 220) were collected over three independent replicates using all the lines. (C) Images representing the median values of proliferation marker Ki67 and Hoechst of control and patient‐derived cells at day 7 of differentiation in a two‐dimensional culture with their respective zoomed region and perimeter mask (scale bar = 50 μm). (D) Quantification of Ki67 at time points 7, 14, and 21 after the induction of differentiation in a two‐dimensional culture, normalized to the nuclear area. Acquisition was performed at 20× sampling randomly 15 fields per well. Ten wells of controls and 10 wells of patients were acquired per replicate per time point. Images analyzed per time point: 7 (fc = 425; fp = 421), 14 (fc = 411; fp = 424), and 21 (fc = 416; fp = 432) were collected over three independent replicates using all the lines. (E) Representative images of apoptotic marker cleaved poly adenosin phosphate (ADP)‐ribose polymerase (cPARP), dopaminergic marker TH, and Hoechst at day 14 of differentiation in a two‐dimensional culture with their respective zoomed region and perimeter mask (scale bar = 50 μm). (F) Quantification of cPARP within the TH area at time points 7, 14, and 21 after the induction of differentiation in a two‐dimensional culture, normalized to the TH area. Acquisition was performed at 20× sampling randomly 15 fields per well. Ten wells of controls and 10 wells of patients were acquired per replicate per time point. Images analyzed per time point: 7 (fc = 219; fp = 215), 14 (fc = 209; fp = 219), and 21 (fc = 207; fp = 220) were collected over three independent replicates using all of the lines. (G) Images representing the median values of a 21‐day differentiation neuronal two‐dimensional culture of control and patient groups. Raw images of the markers glial fibrillary acidic protein (GFAP) and S100 calcium binding protein B (S100b) are presented with their respective perimeter masks and zoomed regions (scale bar = 100 μm). (H) Quantification of colocalization between GFAP, S100B, and TH normalized to nuclear area at time points 7, 14, and 21 after the induction of differentiation in a two‐dimensional culture. (I) Images representing the median values of a 21‐day differentiation neuronal two‐dimensional culture of control and patient groups. Raw images of the markers synuclein alpha (SNCA) and TH are presented with their respective perimeter masks and zoomed regions (scale bar = 100 μm). (J) Quantification of colocalization between SNCA and TH normalized to nuclear area at time points 7, 14, and 21 after the induction of differentiation in a two‐dimensional culture. (K) Heatmap clustering different phenotypes during the process of differentiation between control and patient‐derived neurons in a two‐dimensional culture. Normalized scale within category of phenotype. (L) Western blot analysis of TH, TUBB3, and GFAP proteins extracted from two patient‐derived PINK1 p.Q456X‐mutant neurons (patients 1 and 2) and their respective isogenic gene‐corrected (GC) controls (patient 1 GC and patient 2 GC) after 30 days of differentiation (two‐dimensional cultures). β‐actin was used as loading control. (M) Quantitative immunoblot analysis of data presented in C. Histogram bars represent the mean values (± standard deviation) of TH, TUBB3, and GFAP signals in at least three independent experiments using the two isogenic pairs. Data were normalized against β‐actin levels and expressed as fold change. Except for panels L and M, all control and patient lines were used. Statistical analysis was performed using Kruskal–Wallis and Dunn's tests for multiple comparisons. Adjustment of the P‐value for multiple tests was performed using Benjamini‐Hochberg. *P < 0.05, **P < 0.01, ***P < 0.001; ns, not significant. [Color figure can be viewed at wileyonlinelibrary.com]
FIG 2
FIG 2
Differential abundance of proteins between control and patient‐derived organoids at day 30 of neuronal differentiation. (A) Volcano plot of proteomics data. The x axis represents the log fold change (logFC) between patient‐derived and control organoids, with positive logFC indicating that the protein is more abundant in patient data than in control data, and the opposite for negative logFC. The y axis represents the P‐value of the comparison adjusted for multiple testing using Benjamini‐Hochberg. Proteins with adjusted P‐value <0.05 and absolute logFC >0.5 were considered differential. (B) Network of the protein–protein interactions among the differential proteins obtained from the Search Tool for the Retrieval of Interacting Genes/Proteins (STRING) database. Interactions obtained from all data sources and with a confidence score >0.9 (high) were considered. Differential proteins that are not reported to interact with other differential proteins are not represented. (CF) Mapping of significantly enriched Kyoto Encyclopedia of Genes and Genomes (KEGG) pathways on the protein–protein interaction network. KEGG pathways were tested for enrichment in proteins present in the network compared to the human genome and were considered significantly enriched if their P‐value adjusted by Benjamini‐Hochberg was <0.05. Nodes corresponding to proteins that belong to a selection of significantly enriched pathways are highlighted with different colors on the STRING network. The border of the nodes depicts the logFC of the pathway proteins in the comparison of control and patient‐derived organoids. Control line 1 and patient line 1 were used for the proteomics experiments. Jak‐STAT, janus kinase and signal transducer and activator of transcription; PI3K‐Akt, phosphatidylinositol 3‐kinase and Akt (protein kinase B); MAPK, mitogen‐activated protein kinase; mTOR, mechanistic target of rapamycin; AMPK, AMP‐activated protein kinase [Color figure can be viewed at wileyonlinelibrary.com]
FIG 3
FIG 3
Modulation of autophagy alters neuronal differentiation. (A) Representative images of human induced pluripotent stem cells (hiPSCs) carrying the Rosella construct targeting microtubule‐associated proteins 1A/1B light chain 3B (LC3) for control and patient‐derived cells and zoomed images with representative identification of the different stages of the autophagy process detected with the Rosella reporter (scale bar = 20 μm). (B) Absolute quantification of phagophores, autophagosomes, early autolysosomes, and late autolysosomes for controls and patient‐derived hiPSCs. All structures were measured under basal conditions. Acquisition was performed at 60× sampling randomly. Images analyzed: fields of controls (fc) = 131 and fields of patients (fp) = 131 were collected over three independent replicates using control line 1 and patient line 3. (C) Images representing the median values of neurons in a two‐dimensional culture tagged with the Rosella construct for depicting mitophagy events at day 8 of differentiation showing the red fluorescent protein from Discosoma (dsRed) and pH‐sensitive green fluorescent protein (pHluorin) raw signal (with their corresponding masks). A merged image of both channels is shown at the bottom of the panel and zoomed images in the right panel of each line (scale bar = 20 μm). (D) Time series quantification of the mitophagy capacity during neuronal differentiation for 14 days in a two‐dimensional culture. Different properties of mitochondria and mitophagy events were assessed. Measurements were performed once a day during the entire differentiation protocol. Images analyzed: fc = 97–219 and fp =126–224 range measured per day for 14 days. Acquisition was performed at 60× sampling randomly 15 fields per well. Five wells of control 1 and 5 wells of patient 3 were acquired per replicate over three independent replicates. (E) Heatmap clustering for control and patient‐derived cells across all mitophagy and autophagy modulating treatments in control line 1 and patient line 3 hiPSCs. Scale in absolute event frequency of phagophores or autophagic vacuoles detected. (F) Images representing the median values of neurons in a two‐dimensional culture stained for LC3, lysosomal associated membrane protein 1 (LAMP1), and tyrosine hydroxylase (TH) after treatment with different concentrations of chloroquine with their respective zoomed areas (scale bar = 20 μm). (G) Quantification of immunostaining for LC3, LAMP1, and TH+ and their respective colocalizations, normalized to nuclear area at different chloroquine concentrations. (H) Images representing the median values of neurons in a two‐dimensional culture stained for Tubulin Beta 3 Class III (TUBB3), glial fibrillary acidic protein (GFAP), and TH after treatment with different concentrations of chloroquine, with their respective zoomed areas (scale bar = 50 μm). (I) Quantification of immunostaining for GFAP, TUBB3, and TH+ and their respective colocalizations, normalized to nuclear area at different chloroquine concentrations. Except for panels A to E, all control and patient lines were used. Statistical analyses for panels B, G, and I were performed using Kruskal–Wallis and Dunn's tests for multiple comparisons. Statistical analysis for panel D was performed using a nonparametric test for repeated measures in factorial design (nparLD). Adjustment of the P‐value for multiple tests was performed using Benjamini‐Hochberg. *P < 0.05, **P < 0.01, ***P < 0.001, ****P < 0.0001; ns, not significant. baf, bafilomycin; CCCP, carbonyl cyanide m‐chlorophenyl hydrazone; chlo, chloroquine; DFP, deferiprone; dmso, Dimethyl sulfoxide; EBSS, Earle's Balanced Salt Solution; oligo, oligomycin; rapa, rapamycin; thap, thapsigargin; val, valinomycin. [Color figure can be viewed at wileyonlinelibrary.com]
FIG 4
FIG 4
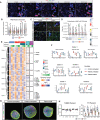
Treatment with HP‐β‐CD improves neuronal differentiation by increasing autophagy. (A) Representative images of differentiated neurons in a two‐dimensional culture stained for TFEB, with their respective zoomed images (scale bar = 50 μm). (B) Quantification of the colocalization between TFEB and Nuclei signal with the different treatment concentrations. Images analyzed: 540 fields per category (control or patient) per condition, acquired over three independent replicates using all lines. (C) Images representing the median values of neurons in a two‐dimensional culture stained for p62, lysosomal associated membrane protein 1 (LAMP1), and tyrosine hydroxylase (TH) after treatment with different concentrations of HP‐β‐CD, with their respective zoomed areas (scale bar = 20 μm). (D) Quantification of immunostaining for the colocalization of sequestosome 1 (SQSTM1 or p62), LAMP1 and TH+, normalized to nuclear area at different HP‐β‐CD treatment concentrations. (E) Protein abundance measured in control‐derived, patient‐derived, and HP‐β‐CD‐treated patient‐derived organoids at time 10, 20 and 30 days of the neuronal differentiation was scaled for each protein separately. A k‐means partitioning (k = 8) was performed in order to obtain clusters of proteins with similar expression dynamics. The proteins differentially abundant between control and patient‐derived organoids, and between patient and treated patient‐derived organoids are also shown (Benjamini‐Hochberg, BH‐adjusted P‐value<0.05 and absolute logFC>0.5). (F) Normalized expression of selected proteins that show differential expression between patient and treated patient‐derived organoids is reported. Three data points were collected for each condition and time point. Whiskers represent one standard deviation from the median of the measurements. (G) Representative images of control, patient and patient treated derived organoids at 30 days of differentiation (scale bar = 200 μm). (H) Quantification of the markers TH, Tubulin Beta 3 Class III (TUBB3) and Hoechst. Each dot represents one section analyzed. Sections analyzed: control (7, 9, 5, 14, and 9) and patient (9, 25, 15, 18, and 19) respectively for the different treatments (Un, 500 nM, 1 μM, 5 μM, and 10 μM) collected over three independent replicates. Control 1, patient 1, and patient 3 lines were used. For panels A to D, all control and patient lines were used. For panels E and F, control line 1 and patient line 1 were used. For panels B, D, and H, statistical analyses were performed using Kruskal–Wallis and Dunn's tests for multiple comparisons. Adjustment of the P‐value for multiple tests was performed using Benjamini‐Hochberg (BH). The adjusted significance are represented in red. Comparisons between control untreated and patient untreated are presented with #. Comparison between the patient‐untreated condition and the different treatment concentrations are represented with *. *P < 0.05, **P < 0.01, ***P < 0.001, ****P < 0.0001; ns, not significant. Significance hashtag represent: #P < 0.05, ##P < 0.01, ###P < 0.001; ns stands for not significant. Un, untreated. 1433Z, tyrosine 3‐monooxygenase/tryptophan 5‐monooxygenase; BIRC7, baculoviral inhibitor of apoptosis protein (IAP) repeat containing 7; CCL7, C‐C motif chemokine ligand 7; CD15, fucosyltransferase 4; DLK1, Delta like non‐canonical notch ligand 1; DLX4, distal‐less homeobox 4; ECHM, enoyl coenzyme a hydratase short chain 1 mitochondrial; EGFR, epidermal growth factor receptor; IFNA1, interferon alpha 1; IL34, interleukin 34; ITAE, integrin subunit alpha E; LAMP2, lysosomal associated membrane protein 2; MK, midkine; NTF4, neurotrophin 4; P53, tumor protein 53; RADC, RAD51 paralog C; SOX9, sex‐determining region Y (SRY)‐box transcription factor 9; UB2D2, ubiquitin conjugating enzyme E2 D2 [Color figure can be viewed at wileyonlinelibrary.com]
FIG 5
FIG 5
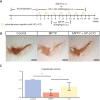
Treatment with 2‐hydroxypropyl‐β‐cyclodextrin (HP‐β‐CD) protects against toxicity of MPTP. (A) Treatment scheme for the generation of MPTP‐induced subacute Parkinson's disease mice model and treatment with HP‐β‐CD. (B) Representative mouse midbrain sections stained for tyrosine hydroxylase (TH) in control, MPTP, or HP‐β‐CD‐treated mice (scale bar = 400 μm). (C) Stereological quantification of the TH levels in mouse sections normalized to control levels. Statistical analysis was performed using Kruskal–Wallis and Dunn's tests for selected comparisons. *P < 0.05, **P < 0.01. [Color figure can be viewed at wileyonlinelibrary.com]

References

    1. Gammon K. Neurodegenerative disease: brain windfall. Nature 2014;515(7526):299–300. - PubMed
    1. Lozano CS, Tam J, Lozano AM. The changing landscape of surgery for Parkinson's disease. Mov Disord 2018;33(1):36–47. - PubMed
    1. Brás J, Guerreiro R, Hardy J. SnapShot: genetics of Parkinson's disease. Cell 2015;160(3):570. - PubMed
    1. Ashrafi G, Schwarz TL. The pathways of mitophagy for quality control and clearance of mitochondria. Cell Death Differ 2012;20(1):31–42. - PMC - PubMed
    1. Larsen SB, Hanss Z, Krüger R. The genetic architecture of mitochondrial dysfunction in Parkinson's disease. Cell Tissue Res 2018;373(1):21–37. - PMC - PubMed

Publication types

Substances