. 2021 Oct 12;19(10):e3001406.
doi: 10.1371/journal.pbio.3001406. eCollection 2021 Oct.

Individual bacteria in structured environments rely on phenotypic resistance to phage

Affiliations

Individual bacteria in structured environments rely on phenotypic resistance to phage

Erin L Attrill et al. PLoS Biol. .

Abstract

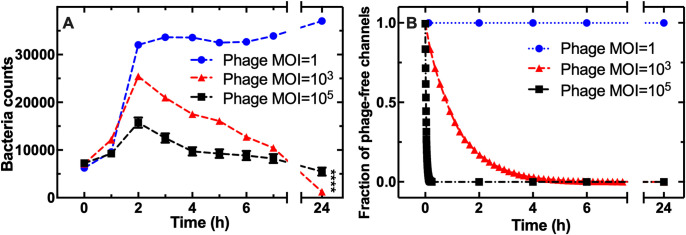
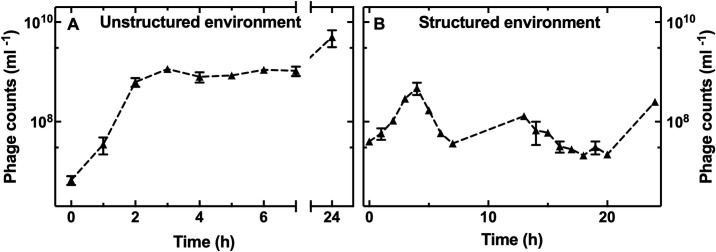
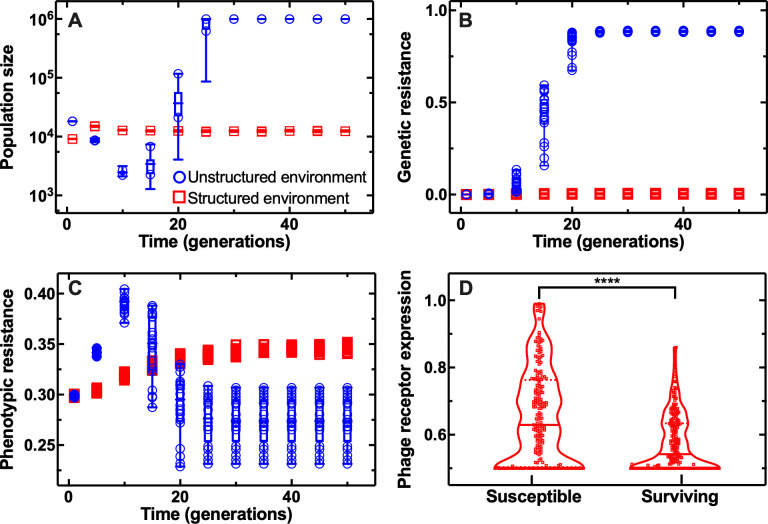
Bacteriophages represent an avenue to overcome the current antibiotic resistance crisis, but evolution of genetic resistance to phages remains a concern. In vitro, bacteria evolve genetic resistance, preventing phage adsorption or degrading phage DNA. In natural environments, evolved resistance is lower possibly because the spatial heterogeneity within biofilms, microcolonies, or wall populations favours phenotypic survival to lytic phages. However, it is also possible that the persistence of genetically sensitive bacteria is due to less efficient phage amplification in natural environments, the existence of refuges where bacteria can hide, and a reduced spread of resistant genotypes. Here, we monitor the interactions between individual planktonic bacteria in isolation in ephemeral refuges and bacteriophage by tracking the survival of individual cells. We find that in these transient spatial refuges, phenotypic resistance due to reduced expression of the phage receptor is a key determinant of bacterial survival. This survival strategy is in contrast with the emergence of genetic resistance in the absence of ephemeral refuges in well-mixed environments. Predictions generated via a mathematical modelling framework to track bacterial response to phages reveal that the presence of spatial refuges leads to fundamentally different population dynamics that should be considered in order to predict and manipulate the evolutionary and ecological dynamics of bacteria-phage interactions in naturally structured environments.


Conflict of interest statement

The authors have declared that no competing interests exist.

Figures

Fig 1
Fig 1. The structure of the environment affects the bacterial population dynamics in response to phage.
Schematics illustrating T4 epidemics in E. coli in (A) well-mixed microwells and (B) microfluidic devices structured with ephemeral spatial refuges. Corresponding temporal dependence of bacterial population size in (C) the unstructured and (D) the structured environment in the presence (triangles) and absence (circles) of phage T4. Data are the mean and standard error of the mean of at least 4 biological replicates in the unstructured environment and of 200 spatial refuges in biological triplicate in the structured environment. Error bars are hidden behind the corresponding data points in the structured environment measurements due to the large statistical samples. It is noteworthy that similar initial bacterial population sizes were used in the unstructured and structured environments; compare data at t = 0. Dashed lines are guides for the eye. Numerical values for each replica in Fig 1C and 1D are provided in Data B and Data F in S1 File, respectively.
Fig 2
Fig 2. The phage concentration affects the bacterial population dynamics in the structured environment.
(A) Temporal dependence of the bacterial population size with T4 phages continuously injected in the mother machine device from t = 0 onwards at an MOI of 1 (circles), 103 (triangles), or 105 (squares). This MOI refers to the concentrations of phage and bacteria in the entire device rather than in each individual compartment. Data and error bars are the average and standard error of the mean of 200 single-compartment measurements in biological triplicate. The dashed lines are guides for the eye. Some of the error bars are hidden behind the corresponding data points. **** indicates a p-value ≤ 0.0001. (B) Corresponding simulated temporal dependence of the fraction of phage-free refuges up to time t. Data points were obtained via Lattice–Boltzmann simulations, and statistics was collected from over 2,600 simulated phages in a periodic cross-section of the mother machine. The dashed lines are guides for the eye. Numerical values for each replica in Fig 2A and 2B are provided in Data J and Data K in S1 File, respectively. MOI, multiplicity of infection.
Fig 3
Fig 3. The structure of the environment impacts the phage population dynamics.
Temporal dependence of the concentration of phages infecting E. coli in (A) the unstructured and (B) the structured environment. Data are the mean and standard error of the mean of biological triplicates. Dashed lines are guides for the eye. Some of the error bars are hidden behind the corresponding data points. The corresponding bacteria population dynamics are reported in S4 Fig (MOI = 1, blue circles) and Fig 1D (red triangles), respectively. Numerical values for each replica are provided in Data M in S1 File. MOI, multiplicity of infection.
Fig 4
Fig 4. Dissecting E. coli phenotypic resistance to T4.
Representative temporal dependence of bacterial density per compartment for a bacterium that (A) remains viable but nongrowing as determined by live/dead staining at t = 24 h, (B) duplicates and remains alive together with all its progeny, (C) duplicates but some of its progeny lyses, and (D) filaments upon exposure to T4 phage. Measurements were carried out in 200 channels of the structured mother machine environment in biological triplicate. Dashed lines are guides for the eye. Numerical values are provided in Data P in S1 File.
Fig 5
Fig 5. Phenotypic heterogeneity in phage receptor contributes to phenotypic resistance to phage in the presence of ephemeral spatial refuges.
Distributions of GFP levels reporting on the expression of the T4 receptor OmpC before exposure to (A) T4 or (B) T2 phage in E. coli that later lysed (green violin plot) or survived (black violin plot) exposure to phage. Data were obtained in biological triplicate for a total of N = 108, N = 42 bacteria that were killed or survived T4 exposure, respectively, and N = 85, N = 42 bacteria that were killed or survived T2 exposure, respectively. Distributions of GFP levels reporting on the expression of the T2 receptor FadL before exposure to (C) T4 or (D) T2 phage in E. coli that later lysed (green violin plot) or survived (black violin plot) exposure to phage. Data were obtained in biological triplicate for a total of N = 82, N = 31 bacteria that were killed or survived T4 exposure, respectively, and N = 72, N = 35 bacteria that were killed or survived T2 exposure, respectively. (E) Temporal dependence of mean bacterial population size for the parental strain (triangles) and a ΔompC deletion mutant (circles) upon exposure to T4 phage. Data are the mean and standard error of the mean of 200 single-compartment measurements in biological triplicate. Some of the error bars are hidden behind the corresponding data points. Solid lines are linear regression fitting to the data returning an x-intercept of 10 and 17 h for the parental and ΔompC strain, respectively. Dashed lines are guides for the eye. (f) Distributions of number of generations before death caused by T4 for the parental (red) and ΔompC strain (blue boxplot). The bottom and top of the box are the first and third quartiles, the line and plus symbol inside the box are the median and mean, the bottom and top lines outside the box represent the 10th and 90th percentiles, respectively. Data were obtained in biological triplicate. ** indicates a p-value ≤ 0.01, **** indicates a p-value ≤ 0.0001. Numerical values for Fig 5A–5D are provided in Data S in S1 File. Numerical values for Fig 5E and 5F are provided in Data V and Data W in S1 File. GFP, green fluorescent protein; OmpC, outer membrane protein C.
Fig 6
Fig 6. Effect of the structure of the environment on bacterial population dynamics during phage infection according to agent-based simulations.
Temporal dependence of (A) the bacterial population size, the fraction of the bacterial population (B) genetically or (C) phenotypically resistant to phage in the unstructured and structured environment (blue circles and red squares, respectively). Data were obtained for 20 independent model simulations. (D) Distributions of phage receptor levels in bacteria that were susceptible to or surviving phage at 25 generations post-phage addition to the structured environment. Data were obtained for 200 randomly sampled cells. **** indicates a p-value ≤ 0.0001. Numerical values for each replica in Fig 6A–6C are provided in Data X in S1 File. Numerical values for Fig 6D are provided in Data Y in S1 File.

References

    1. Avrani S, Wurtzel O, Sharon I, Sorek R, Lindell D. Genomic island variability facilitates Prochlorococcusvirus coexistence. Nature. 2011;474:604–8. doi: 10.1038/nature10172 - DOI - PubMed
    1. Benmayor R, Buckling A, Bonsall MB, Brockhurst MA, Hodgson DJ. The Interactive Effects of Parasites, Disturbance, and Productivity on Experimental Adaptive Radiations. Evolution (N Y). 2008;62:467–77. doi: 10.1111/j.1558-5646.2007.00268.x - DOI - PubMed
    1. Duerkop BA, Clements CV, Rollins D, Rodrigues JLM, Hooper LV. A composite bacteriophage alters colonization by an intestinal commensal bacterium. Proc Natl Acad Sci U S A. 2012;109:17621–6. doi: 10.1073/pnas.1206136109 - DOI - PMC - PubMed
    1. Koskella B, Brockhurst MA. Bacteria-phage coevolution as a driver of ecological and evolutionary processes in microbial communities. FEMS Microbiol Rev. 2014;38:916–31. doi: 10.1111/1574-6976.12072 - DOI - PMC - PubMed
    1. Pirnay J-P, Verbeken G, Rose T, Jennes S, Zizi M, Huys I, et al.. Introducing yesterday’s phage therapy in today’s medicine. Future Virol. 2012;7:379–90. doi: 10.2217/fvl.12.24 - DOI

Publication types

Substances