. 2022 Jan 25;6(2):386-398.
doi: 10.1182/bloodadvances.2021005311.

The CADM1 tumor suppressor gene is a major candidate gene in MDS with deletion of the long arm of chromosome 11

Affiliations

The CADM1 tumor suppressor gene is a major candidate gene in MDS with deletion of the long arm of chromosome 11

Marina Lafage-Pochitaloff et al. Blood Adv. .

Abstract

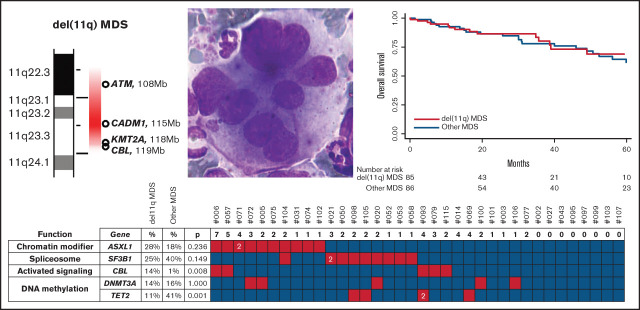
Myelodysplastic syndromes (MDS) represent a heterogeneous group of clonal hematopoietic stem cell disorders characterized by ineffective hematopoiesis leading to peripheral cytopenias and in a substantial proportion of cases to acute myeloid leukemia. The deletion of the long arm of chromosome 11, del(11q), is a rare but recurrent clonal event in MDS. Here, we detail the largest series of 113 cases of MDS and myelodysplastic syndromes/myeloproliferative neoplasms (MDS/MPN) harboring a del(11q) analyzed at clinical, cytological, cytogenetic, and molecular levels. Female predominance, a survival prognosis similar to other MDS, a low monocyte count, and dysmegakaryopoiesis were the specific clinical and cytological features of del(11q) MDS. In most cases, del(11q) was isolated, primary and interstitial encompassing the 11q22-23 region containing ATM, KMT2A, and CBL genes. The common deleted region at 11q23.2 is centered on an intergenic region between CADM1 (also known as Tumor Suppressor in Lung Cancer 1) and NXPE2. CADM1 was expressed in all myeloid cells analyzed in contrast to NXPE2. At the functional level, the deletion of Cadm1 in murine Lineage-Sca1+Kit+ cells modifies the lymphoid-to-myeloid ratio in bone marrow, although not altering their multilineage hematopoietic reconstitution potential after syngenic transplantation. Together with the frequent simultaneous deletions of KMT2A, ATM, and CBL and mutations of ASXL1, SF3B1, and CBL, we show that CADM1 may be important in the physiopathology of the del(11q) MDS, extending its role as tumor-suppressor gene from solid tumors to hematopoietic malignancies.


Figures

None
Graphical abstract
Figure 1.
Figure 1.
Cytological and cytogenetic presentations of del(11q) MDS. (A-D) May-Grünwald Giemsa staining of del(11q) bone marrow. Megakaryocytes were often large and plurinucleated (A, B, and C, original magnification x×50) giving an aspect of ball bags (C) and, when associated to 5q deletion, presence of small and nonlobated megakaryocytes ([D], original magnification ×100). (E) Cytogenetic presentations of del(11q). The 2 main types of del(11q) on R-banded partial karyotypes from 2 representative cases, from left to right: large deletion, del(11)(q14q24), in case #19 and small deletion, del(11)(q22q24), in case #86.
Figure 2.
Figure 2.
WHO 2016, IPSS-R classifications and overall survival of del(11q) MDS. (A) WHO 2016 classification of del(11q) MDS and MDS/MPN. (B) IPSS-R applied to the primary del(11q) MDS by risk category: very low = risk score ≤1.5; low = risk score >1.5-3; intermediate = risk score >3-4.5; high = risk score >4.5-6; very high = risk score >6. (C) Overall survival of del(11q) MDS compared with other MDS.
Figure 3.
Figure 3.
Mutations in del(11q) MDS. Mutation screening of 36 del(11q) MDS by next generation sequencing. Genes were classified according to their function (2 first columns). Comparison with other MDS is indicated in the 3 central columns (del[11q] MDS mutation frequency, other MDS mutation frequency, and P value comparing the frequencies between these 2 groups). Mutations are indicated by red squares containing the number of mutations per sample if higher than 1, the absence of mutations by green squares, and the absence of analysis by white squares. Patients are labeled at the top.
Figure 4.
Figure 4.
CDR of del(11q) MDS defined by high resolution microarray analysis. Detailed map of the chromosome 11 summarizing microarray data. Chromosomal bands are indicated at the top with the genomic location indicated below according to hg19 assembly human genome. Continuous line: presence of the 2 alleles; dashed line: deletion of 1 of the 2 alleles. Genes located in the region are indicated by black dots. The common deleted region was indicated by vertical lines with a magnification of it at the bottom, indicating location of exons of NXPE2 and CADM1, their orientation, and the 3 samples defining the del(11q) MDS CDR.
Figure 5.
Figure 5.
Expression of CADM1 and NXPE2 in myeloid cells. (A) Expression of CADM1 and NXPE2 in 21 MDS, 10 chronic myelo-monocytic leukemias, and 55 AML samples presented as a box with whiskers. The box extends from the 25th to the 75th percentiles of expression. The line in the middle of the box was the median. The whiskers indicate the 10th and the 90th percentiles. (B) Expression of CADM1 in AML according to their FAB classification.
Figure 6.
Figure 6.
Functional inactivation of Cadm1 in mice. (A) Experimental procedure to study the effect of Cadm1 edition on murine hematopoietic development (left panel). LSK cells from Cas9-expressing mice were purified by cell sorting (right panel) and transduced with either sgCadm1#2 or control sgRNA (sgCTL) lentiviral vectors. Transduced Cas9-expressing LSK cells (CD45.2+) were either plated in clonogenic assay or transplanted into syngenic recipient mice (CD45.1+, n = 3 for each condition). (B) Number of total CFU-GEMM, CFU-GM, and BFU-E colonies in clonogenic assay. (C) BM chimerism, analyzed by FACS 2 months after transplantation, illustrated by the percentage of transduced donor cells (% CD45.2+GFP+) found in the recipient BM (upper panel). Immunophenotype of engrafted donor-derived cells (CD45.2+GFP+) was analyzed using the Gr1 (Myeloid cells, My) and CD19 (B-cells) markers. FACS profiles and gating strategy were shown for 1 representative mouse of each condition (lower panel). (D) Proportion of myeloid and B cells (%) within total donor-derived CD45.2+GFP+ cells from the BM of recipient mice. (E-F) Donor-derived cells (CD45.2+GFP+) from each sgCTL and sgCadm1 transplanted mouse purified by cell sorting. Genome editing efficiency of targeted Cadm1 region performed on purified donor-derived cells (CD45.2+GFP+) for each condition (E). Cytological analysis was performed on purified CD45.2+GFP+ cells from each condition, and the proportion of myeloid and lymphoid cells was calculated (F).

References

    1. WHO Classification of Tumours of Haematopoietic and Lymphoid Tissues. Lyon: International Agency for Research on Cancer; 2008.
    1. WHO Classification of Tumours of Haematopoietic and Lymphoid Tissues. Lyon: International Agency for Research on Cancer; 2017.
    1. Adès L, Itzykson R, Fenaux P. Myelodysplastic syndromes. Lancet. 2014;383(9936):2239-2252. - PubMed
    1. Hellström-Lindberg E, Tobiasson M, Greenberg P. Myelodysplastic syndromes: moving towards personalized management. Haematologica. 2020;105(7):1765-1779. - PMC - PubMed
    1. Greenberg PL, Tuechler H, Schanz J, et al. . Revised international prognostic scoring system for myelodysplastic syndromes. Blood. 2012;120(12):2454-2465. - PMC - PubMed

Publication types