. 2021 Sep 30;13(19):4950.
doi: 10.3390/cancers13194950.

RAC1 Alterations Induce Acquired Dabrafenib Resistance in Association with Anaplastic Transformation in a Papillary Thyroid Cancer Patient

Affiliations

RAC1 Alterations Induce Acquired Dabrafenib Resistance in Association with Anaplastic Transformation in a Papillary Thyroid Cancer Patient

Rozita Bagheri-Yarmand et al. Cancers (Basel). .

Abstract

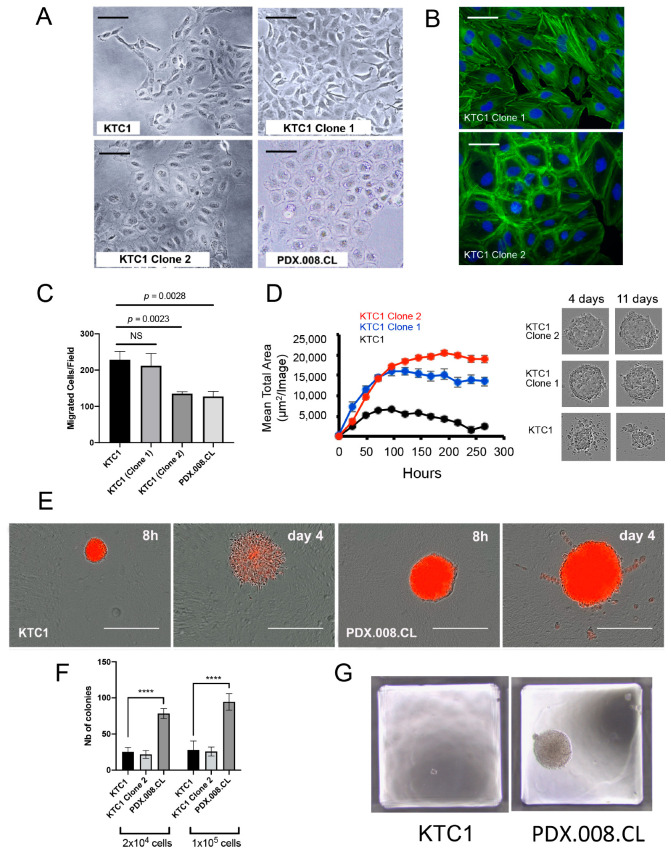
BRAF-activating mutations are the most frequent driver mutations in papillary thyroid cancer (PTC). Targeted inhibitors such as dabrafenib have been used in advanced BRAF-mutated PTC; however, acquired resistance to the drug is common and little is known about other effectors that may play integral roles in this resistance. In addition, the induction of PTC dedifferentiation into highly aggressive KRAS-driven anaplastic thyroid cancer (ATC) has been reported. We detected a novel RAC1 (P34R) mutation acquired during dabrafenib treatment in a progressive metastatic lesion with ATC phenotype. To identify a potential functional link between this novel mutation and tumor dedifferentiation, we developed a cell line derived from the metastatic lesion and compared its behavior to isogenic cell lines and primary tumor samples. Our data demonstrated that RAC1 mutations induce changes in cell morphology, reorganization of F-actin almost exclusively at the cell cortex, and changes in cell adhesion properties. We also established that RAC1 amplification, with or without mutation, is sufficient to drive cell proliferation and resistance to BRAF inhibition. Further, we identified polyploidy of chromosome 7, which harbors RAC1, in both the metastatic lesion and its derived cell line. Copy number amplification and overexpression of other genes located on this chromosome, such as TWIST1, EGFR, and MET were also detected, which might also lead to dabrafenib resistance. Our study suggests that polyploidy leading to increased expression of specific genes, particularly those located on chromosome 7, should be considered when analyzing aggressive thyroid tumor samples and in further treatments.

Keywords: BRAF; PAK1; RAC1; anaplastic thyroid carcinoma; aneuploidy; drug resistance; kinase inhibitors; papillary thyroid carcinoma.


Conflict of interest statement

The authors declare no conflict of interest.

Figures

Figure 1
Figure 1
Samples histology of a PTC patient before and after dabrafenib treatment, and morphology of a derived cell line. (A) H&E preparation of a pretreatment sample showing papillary thyroid cancer histology. (A’) Enlargement of A showing cells organized in papillae. Cells present with enlarged nuclei with irregular contours, intranuclear inclusions, and pale chromatin. (B) Overall histology of a mediastinal metastasis sample at progression (FNA, H&E preparation). (B’) Enlargement of B showing cells distributed without an organized pattern. Cells have a spindle or round cell morphology resembling poorly differentiated (PDTC) or anaplastic (ATC) thyroid cancer. (C) Phase contrast micrograph showing the cobblestone arrangement of PDX.008.CL cells in culture. Cells are mostly round or cuboidal with round nuclei containing prominent nucleoli. The cytoplasm also contains prominent vacuoles (arrows). (D) Hematoxylin staining of PDX.008.CL cells in culture showing multinucleated cells (arrows).
Figure 2
Figure 2
Effects of BRAF and RAC1 mutations on the proliferation of different cell types. (A) The effects of the BRAF (A598_T599delinsA) and (K601N) mutations separately or combined, as well as the effects of the RAC1(P34R) and RAC1(P29S) mutations on the growth of murine Ba/F3 pro-B cells and human MCF10A normal breast epithelial cells were tested in culture. Cells were transiently transfected with lentiviral expression vectors and cultured without the addition of growth factors (interleukin 3 for Ba/F3 and EGF for MCF10A cells). Data indicated that the BRAF mutations significantly affected the growth of lymphoid cells while the RAC1 mutations significantly affected the proliferation of the breast epithelial cells. n = 3, *** = p < 0.005. (B) The effect of dabrafenib on the proliferation of KTC1, BCPAP, and PDX.008.CL cells was evaluated in a dose–response assay. The half maximal inhibitory concentration (IC50) value for dabrafenib was 0.1 µM for both KTC1 and BCPAP cells, while the IC50 value was 1 µM for the PDX.008.CL cell line, indicating a 10-fold resistance to dabrafenib of this cell line in comparison to the other lines. (C) The effect of the RAC1 activity inhibitor EHop-016 in combination with dabrafenib on KTC1, BCPAP and PDX.008.CL cells was evaluated. EHop-016 restored the dabrafenib sensitivity of PDX.008.CL cells back to the levels of KTC1 and BCPAP cells (IC50 = 0.1 µM), indicating that the RAC1 mutation had a major effect on dabrafenib resistance.
Figure 3
Figure 3
RAC1 mRNA and protein expression/activity in PDX.008.CL cells in comparison to other thyroid cancer cell lines. (A) RAC1 total mRNA expression in the PDX.008.CL cell population was 5-fold that of KTC1 and BCPAP cells (n = 3, *** = p< 0.005). (B) RAC1 total protein expression in the PDX.008.CL cells was about 5–7-fold that of KTC1 and BCPAP cells. RAC1 protein expression was not altered by dabrafenib nor EHop-016, an inhibitor of RAC1 activity (n = 3, *** = p < 0.005). (C) The level of expression of wild-type RAC1 protein in PDX.008.CL cells was not significantly different from that in KTC1 cells (n = 4, p = 0.19). (D) In PDX.008.CL cells the level of expression of RAC1 (P34R) protein was 6-fold that of wild-type RAC1, and was not altered by dabrafenib nor EHop-016, a specific inhibitor of RAC1 activity (n = 5, * = p < 0.05, **= p < 0.005).
Figure 4
Figure 4
PDX.008.CL cells are aneuploid. (A) KTC1 (a,b) and PDX.008.CL cells (c,d) were analyzed by flow cytometry. KTC1 cells were diploid, showing 2N DNA at G0/G1 and 4N DNA at G2 (a) while PDX.008.CL cells were aneuploid, showing 2N DNA and an additional peak at G0/G1 (c). Dabrafenib treatment (0.1 µM dabrafenib for 2 days) induced cell cycle arrest in both cell lines (b,d) as seen by an increase in the percentage of diploid cells in G0/G1. Dabrafenib reduced the percentage of aneuploid cells by ~20% (d). Count = cell number; PI = propidium iodide (DNA amount). (B) Fluorescence in situ hybridization (FISH) of KTC1 and PDX.008.CL cells with a RAC1 probe (red) and a chromosome 7 centromeric probe (green) as control. The KTC1 cell line is diploid for chromosome 7 (a), while the PDX.008.CL line shows chromosome 7 trisomy and additional RAC1 duplications (b,c).
Figure 5
Figure 5
RAC1 copy numbers in patient samples and cell lines and RAC1/PAK1 activity. (A) RAC1 gene copy number in the PTC patient tumor samples (primary tumor and metastatic lesion) indicating polyploidy of RAC1 in the metastatic sample at progression in comparison with normal male thyroid, patient germline control and primary tumor tissue. An average of 5 copies of RAC1 was found in the metastatic sample at progression. (n = 3, ** = p <0.005). (B) RAC1 gene copy number in unsynchronized KTC1 and PDX.008.CL cells in comparison to male and female normal thyroid controls. An average of five copies were detected in the PDX.008.CL cells, and 2–4 copies in the KTC1 clones. (n = 3, * = p <0.05, ** = p < 0.005, **** = p < 0.0001). (C) Total activity of RAC1 protein in different cell types was measured by quantifying its binding to GTP. The activity of RAC1 was significantly elevated in PDX.008.CL cells in comparison to the other thyroid cancer cell types KTC1 and BCPAP. Further, RAC1 activity in PDX.008.CL cells was reduced down to levels comparable to the other cell types by using EHop-016. (n = 3, * = p < 0.05, ** = p < 0.01). (D) Increased activity of PAK1 in PDX.008.CL cells was detected after immunoprecipitation using a PAK1 antibody followed by Western blot detection of phospho-PAK1 at Thr423. PAK1 activity was also higher in KTC1 clone 2 cells than in KTC1 clone 1 and KTC1 control cells (total lysates).
Figure 6
Figure 6
Effects of RAC1 gene amplification in KTC1 subclones. (A) There were noticeable shape differences between the original KTC1 cells and KTC1 cells Clone 2 harboring 4 RAC1 copies. In particular, similar to the PDX.008.CL cells, the KTC1 Clone 2 cells were round and flat and showed an increase in perinuclear vacuoles (bars = 50 µm). (B) KTC1 cells Clone 1 showed the presence of actin stress fibers (green fluorescence) and a limited amount of cortical actin, while KTC1 Clone 2 showed striking actin reorganization into thick cortical actin bundles (bars = 20 µm). (C) Migration assay data for KTC1 clones and PDX.008.CL cells demonstrated that RAC1 amplifications significantly impaired cell motility in 2D cultures (n = 6). (D) KTC1 spheroid sizes significantly increased with RAC1 gene copy numbers as quantified with the IncuCyte platform (3D cultures, media without Matrigel). Phase contrast micrographs showed that control KTC1 spheroids broke apart after 4 days in culture while spheroids with excess RAC1 grew and remained stable for another 7 days. (E) KTC1 and PDX.008.CL cells were grown as spheroids in 3D Matrigel cultures. After 4 days, KTC1 cells distinctly expanded as single cells while the PDX.008.CL cells showed collective invasion, a feature of metastasis (bars 8 h = 300 µm, bars day 4 = 150 µm). (F) Equal numbers of KTC1 control cells and PDX.008.CL cells were plated in soft agar and grown for 2 weeks, then colonies counted. Data demonstrated a significant higher number of PDX.008.CL colonies in comparison to KTC1 and KTC1 Clone 2 colonies. RAC1 amplification per se did not promote contact independence. n = 6, **** = p < 0.0001. (G) The size of PDX.008.CL colonies grown in soft agar is significantly bigger than that of KTC1 colonies.
Figure 7
Figure 7
Copy numbers and expression of additional genes located on chromosome 7 in patient samples and PDX.008.CL cells. (A) There are additional copies of RAC1, TWIST1, EGFR1, MET and BRAF in comparison to normal thyroid, confirming aneuploidy of chromosome 7. High number of RAC1 and TWIST1 gene copies might indicate duplications/amplifications by chromothripsis at the tip of 7p. (B) High expression of genes located on chromosome 7 such as RAC1, TWIST1 and EGFR1 indicate a possible correlation between gene copy number and mRNA expression. n = 3–6, * = p < 0.05, ** = p < 0.005, *** = p < 0.0005, **** = p < 0.0001.

References

    1. Siegel R.L., Miller K.D., Jemal A. Cancer statistics, 2020. CA Cancer J. Clin. 2020;70:7–30. doi: 10.3322/caac.21590. - DOI - PubMed
    1. Shah J.P. Thyroid carcinoma: Epidemiology, histology, and diagnosis. Clin. Adv. Hematol. Oncol. 2015;13((Suppl. 4)):3–6. - PMC - PubMed
    1. Carhill A.A., Litofsky D.R., Ross D.S., Jonklaas J., Cooper D.S., Brierley J.D., Ladenson P.W., Ain K.B., Fein H.G., Haugen B.R., et al. Long-Term Outcomes Following Therapy in Differentiated Thyroid Carcinoma: NTCTCS Registry Analysis 1987–2012. J. Clin. Endocrinol. Metab. 2015;100:3270–3279. doi: 10.1210/JC.2015-1346. - DOI - PMC - PubMed
    1. Antonelli A., Fallahi P., Ferrari S.M., Carpi A., Berti P., Materazzi G., Minuto M., Guastalli M., Miccoli P. Dedifferentiated thyroid cancer: A therapeutic challenge. Biomed. Pharm. 2008;62:559–563. doi: 10.1016/j.biopha.2008.07.056. - DOI - PubMed
    1. The Cancer Genome Atlas Research Network. Integrated genomic characterization of papillary thyroid carcinoma. Cell. 2014;159:676–690. doi: 10.1016/j.cell.2014.09.050. - DOI - PMC - PubMed