. 2021 Sep 22;22(19):10194.
doi: 10.3390/ijms221910194.

Super-Resolution Imaging of the A- and B-Type Lamin Networks: A Comparative Study of Different Fluorescence Labeling Procedures

Affiliations

Super-Resolution Imaging of the A- and B-Type Lamin Networks: A Comparative Study of Different Fluorescence Labeling Procedures

Merel Stiekema et al. Int J Mol Sci. .

Abstract

A- and B-type lamins are type V intermediate filament proteins. Mutations in the genes encoding these lamins cause rare diseases, collectively called laminopathies. A fraction of the cells obtained from laminopathy patients show aberrations in the localization of each lamin subtype, which may represent only the minority of the lamina disorganization. To get a better insight into more delicate and more abundant lamina abnormalities, the lamin network can be studied using super-resolution microscopy. We compared confocal scanning laser microscopy and stimulated emission depletion (STED) microscopy in combination with different fluorescence labeling approaches for the study of the lamin network. We demonstrate the suitability of an immunofluorescence staining approach when using STED microscopy, by determining the lamin layer thickness and the degree of lamin A and B1 colocalization as detected in fixed fibroblasts (co-)stained with lamin antibodies or (co-)transfected with EGFP/YFP lamin constructs. This revealed that immunofluorescence staining of cells does not lead to consequent changes in the detected lamin layer thickness, nor does it influence the degree of colocalization of lamin A and B1, when compared to the transfection approach. Studying laminopathy patient dermal fibroblasts (LMNA c.1130G>T (p.(Arg377Leu)) variant) confirmed the suitability of immunofluorescence protocols in STED microscopy, which circumvents the need for less convenient transfection steps. Furthermore, we found a significant decrease in lamin A/C and B1 colocalization in these patient fibroblasts, compared to normal human dermal fibroblasts. We conclude that super-resolution light microscopy combined with immunofluorescence protocols provides a potential tool to detect structural lamina differences between normal and laminopathy patient fibroblasts.

Keywords: STED microscopy; antibodies; colocalization; confocal scanning laser microscopy; lamin layer thickness; laminopathy; nuclear lamins; resolution; transfection.


Conflict of interest statement

The authors declare no conflict of interest.

Figures
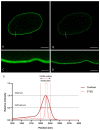
Figure 1
Figure 1
Confocal laser scanning microscopy (A) and STED microscopy (B) images of nHDF stained with antibodies against lamin B1. The region of interest (ROI) is used for the plot profile displayed in (E). Scale bars: 5 µm. (C,D) Higher magnification (5×) of the region around ROIs in (A,B). Scale bars: 1 µm. (E) Plot profile of lamin intensity, normalized to maximum value. The Full-Width Half Maximum (FWHM) (i.e., the width of the peak at half of its maximum value) of STED (pink) and confocal laser scanning microscopy (red) is indicated.
Figure 2
Figure 2
STED microscopy images of the top of the nucleus from (A) non-fixed live lam-B1-EGFP transfected 3T3 cells, (B) fixed lam-B1-EGFP transfected 3T3 cells, and (C) fixed 3T3 cells stained with antibodies against lamin B1. (DF) Higher magnification (2.9×) of ROIs (white rectangles) indicated in (AC), respectively. Arrow in B indicates structures of the nucleoplasmic reticulum. Scale bars: 5 µm.
Figure 3
Figure 3
Comparison of confocal (A,C,E,G) and STED (B,D,F,H) microscopy images. (A,B) 3T3 lamin-A-YFP transfected. (C,D) 3T3 lamin-B1-EGFP transfected. (E,F) 3T3 cells stained with antibodies against lamin A. (G,H) 3T3 cells stained with antibodies against lamin B1. Scale bars: 5 µm. (I,J) Average FWHM (nm) of confocal and STED microscopy images of (I) transfected 3T3 cells and (J) antibody-stained 3T3 cells. Bars, mean ± SD. **** p ≤ 0.0001.
Figure 4
Figure 4
Comparison of confocal (A,C) and STED (B,D) microscopy images. (A,B) nHDF stained with antibodies against lamin A/C. (C,D) nHDF stained with antibodies against lamin B1. Scale bars: 5 µm. (E) Average FWHM (nm) of confocal and STED images of antibody-stained nHDF. Bars, mean ± SD. **** p ≤ 0.0001.
Figure 5
Figure 5
(AC) Merged STED microscopy images of lamin A(/C) (red) and lamin B1 (green). (A) 3T3 cells transfected with both lamin-A-YFP and lamin-B1-EGFP. (B) 3T3 cells stained with antibodies against lamin A and lamin B1. (C) nHDF stained with antibodies against lamin A/C and lamin B1. Scale bars: 5 µm. (D,E) Average FWHM (nm) of confocal and STED microscopy images of co-transfected 3T3 cells and 3T3 cells co-stained with antibodies (D), and nHDF stained with antibodies (E). Bars, mean ± SD. * p ≤ 0.05; **** p ≤ 0.0001.
Figure 6
Figure 6
Merged STED microscopy images of the top of the nucleus, visualizing the lamin A (red) and lamin B1 (green) network. (A) 3T3 transfected with lamin-A-YFP/lamin-B1-EGFP. (B) 3T3 stained with antibodies against lamin A and B1. (C,D) Higher magnification (4.3x) of ROIs in (A,B). Scale bars: 5 µm.
Figure 7
Figure 7
Plot profiles of lamins’ intensities in STED microscopy images, normalized to maximum value. Red curves show the relative intensity of lamin A, green curves the relative intensity of lamin B1. (A) 3T3 transfected with lamin-A-YFP and lamin-B1-EGFP. (B) 3T3 stained with antibodies against lamin A and B1.
Figure 8
Figure 8
Merged images of the top of the nucleus, visualizing the lamin A/C (red) and lamin B1 (green) network in nHDF cells. (A) Confocal microscopy image of nHDF stained with antibodies against lamin A/C and B1. (B) STED microscopy image of nHDF stained with antibodies against lamin A/C and B1. (C,D) Higher magnification (4.3×) of ROIs in (A,B). Scale bars: 5 µm.
Figure 9
Figure 9
Comparison of confocal (A,C,I,K) and STED (B,D,J,L) microscopy images of laminopathy patient dermal fibroblasts with an LMNA c.1130G>T (p.(Arg377Leu)) variant, stained with antibodies against lamin A/C (A,B,I,J) and lamin B1 (C,D,K,L). (EH) Higher magnification (3.1×) of ROIs in (AD). (MP) Higher magnification (3.1×) of ROIs in (IL). Scale bars: 5 µm.
Figure 10
Figure 10
Laminopathy patient dermal fibroblasts with an LMNA c.1130G>T (p.(Arg377Leu)) variant, stained with antibodies against lamin A/C and lamin B1, imaged with STED microscopy. (AD) Merged image of lamin A/C (red) and lamin B1 (green), mid-level of the nucleus. Arrows: typical laminopathy cell aberrations. (EH) Merged image of lamin A/C (red) and lamin B1 (green), top of the nucleus. (IM) Higher magnification (3×) of lamin aberrations in (EH). Scale bars: 5 µm.
Figure 11
Figure 11
Comparison of nuclear staining patterns between one nHDF (A) and a laminopathy patient dermal fibroblast with an LMNA c.1130G>T (p.(Arg377Leu)) variant (C). Both nuclei were stained with antibodies against lamin A/C and B1. The corresponding intensity plots of ROIs (straight white lines) in (A,C) are displayed in (B,D), respectively. Scale bars: 5 µm. (B,D) Plot profile of lamins’ intensities in STED microscopy images, normalized to maximum value. Red curves show the relative intensity of lamin A/C, green curves the relative intensity of lamin B1. Arrows in (D) indicate regions with major segregations between the lamin A/C and lamin B1 network, that are found to a much less extent in the nHDF nucleus (B).

References

    1. Worman H.J. Nuclear lamins and laminopathies. J. Pathol. 2012;226:316–325. doi: 10.1002/path.2999. - DOI - PMC - PubMed
    1. Gruenbaum Y., Goldman R.D., Meyuhas R., Mills E., Margalit A., Fridkin A., Dayani Y., Prokocimer M., Enosh A. The nuclear lamina and its functions in the nucleus. Int. Rev. Cytol. 2003;226:1–62. doi: 10.1016/S0074-7696(03)01001-5. - DOI - PubMed
    1. Stuurman N., Heins S., Aebi U. Nuclear lamins: Their structure, assembly, and interactions. J. Struct. Biol. 1998;122:42–66. doi: 10.1006/jsbi.1998.3987. - DOI - PubMed
    1. Gruenbaum Y., Medalia O. Lamins: The structure and protein complexes. Curr. Opin. Cell Biol. 2015;32:7–12. doi: 10.1016/j.ceb.2014.09.009. - DOI - PubMed
    1. Tatli M., Medalia O. Insight into the functional organization of nuclear lamins in health and disease. Curr. Opin. Cell Biol. 2018;54:72–79. doi: 10.1016/j.ceb.2018.05.001. - DOI - PubMed

LinkOut - more resources