. 2021 Sep 22;22(19):10198.
doi: 10.3390/ijms221910198.

Severity of COVID-19 Patients Predicted by Serum Sphingolipids Signature

Affiliations

Severity of COVID-19 Patients Predicted by Serum Sphingolipids Signature

Enrica Torretta et al. Int J Mol Sci. .

Abstract

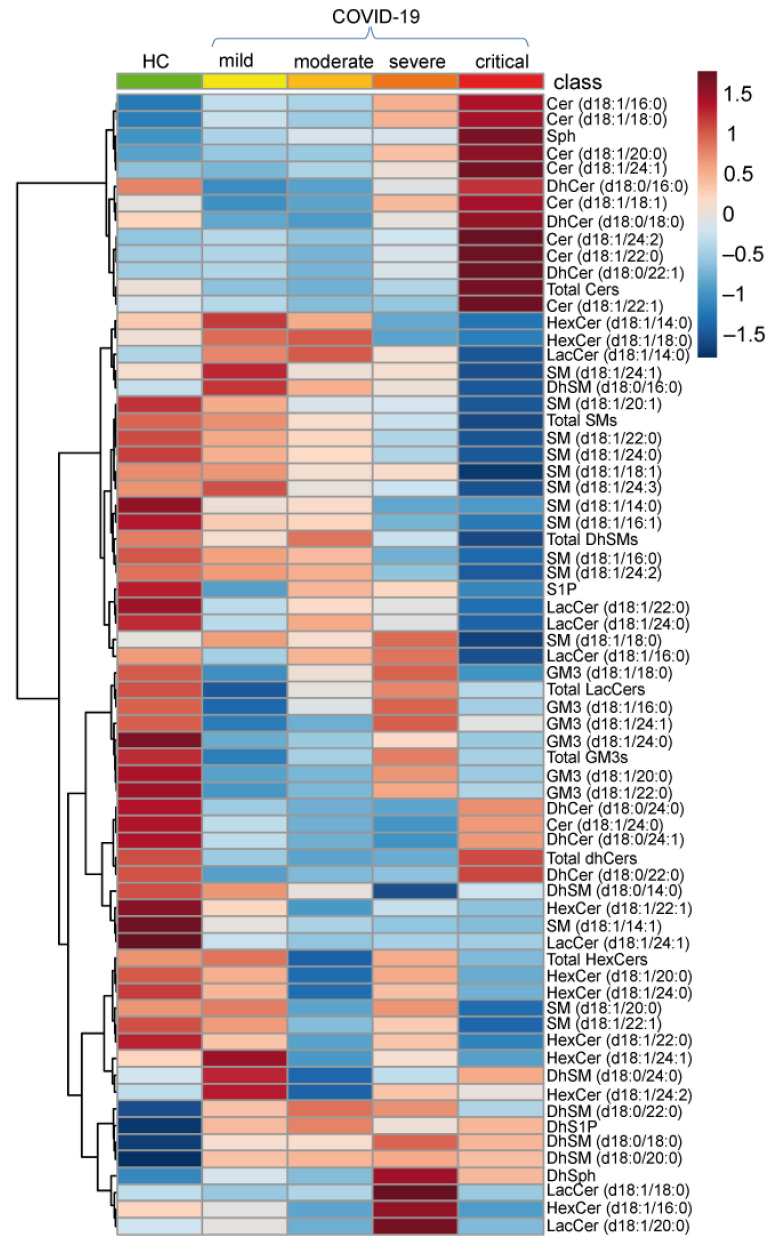
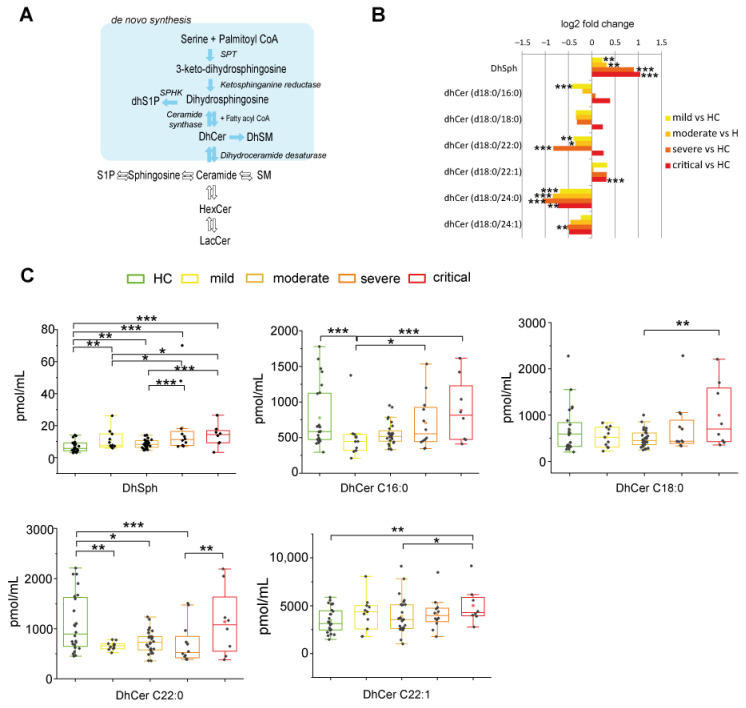
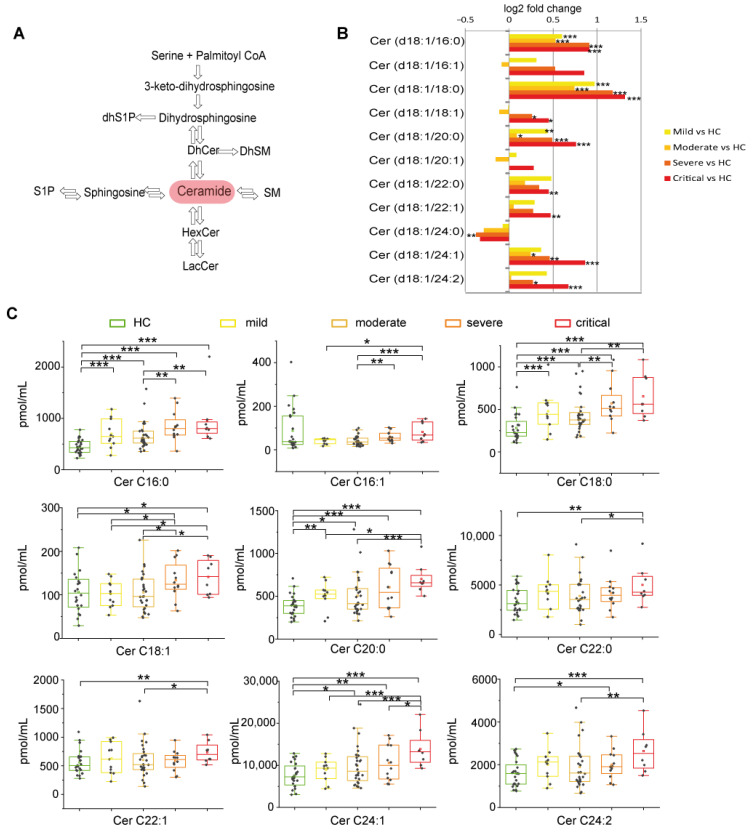
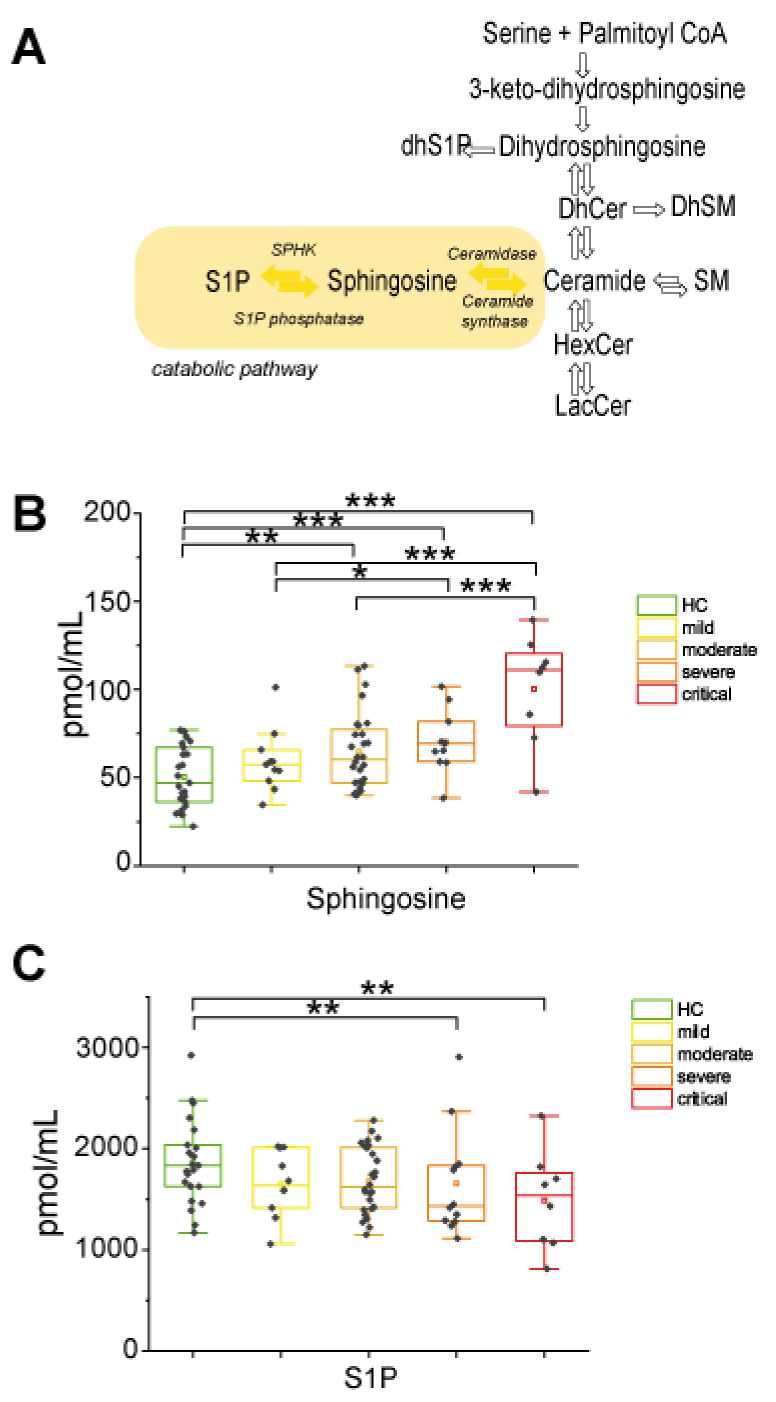
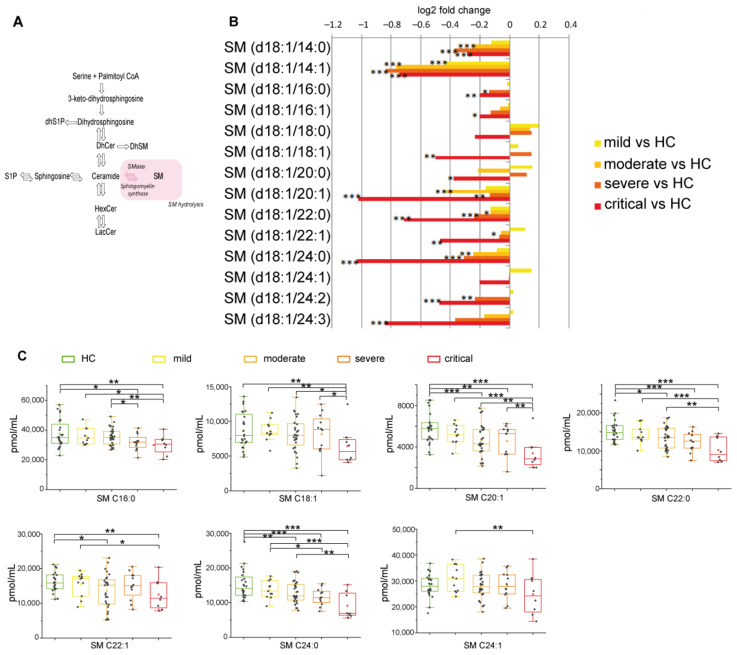
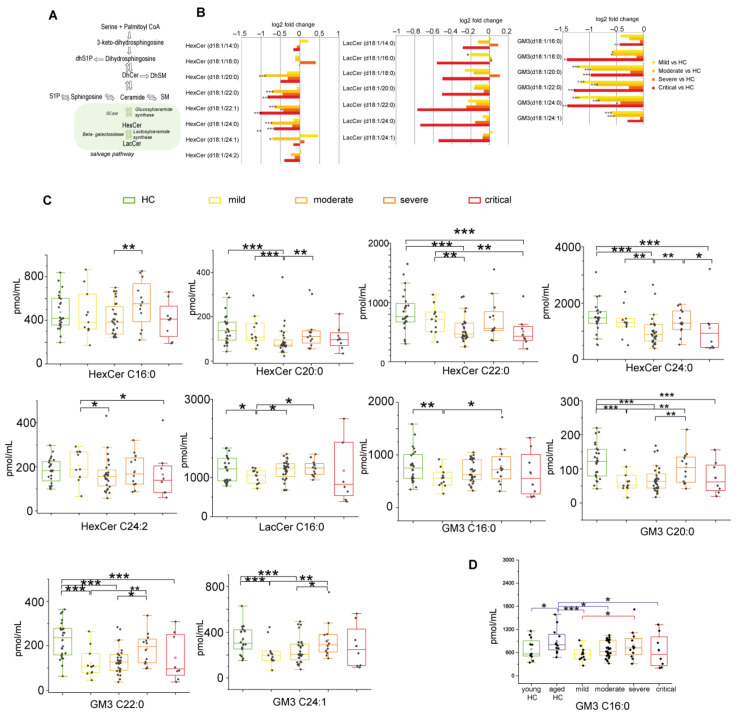
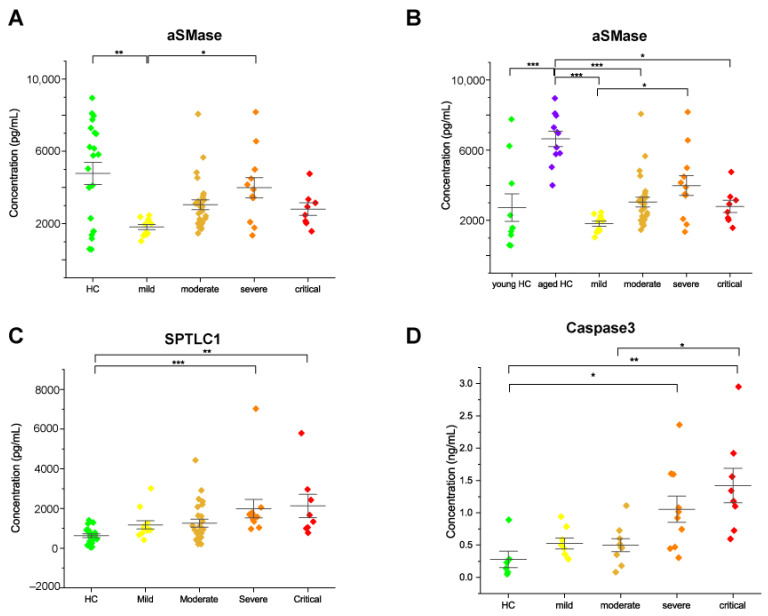
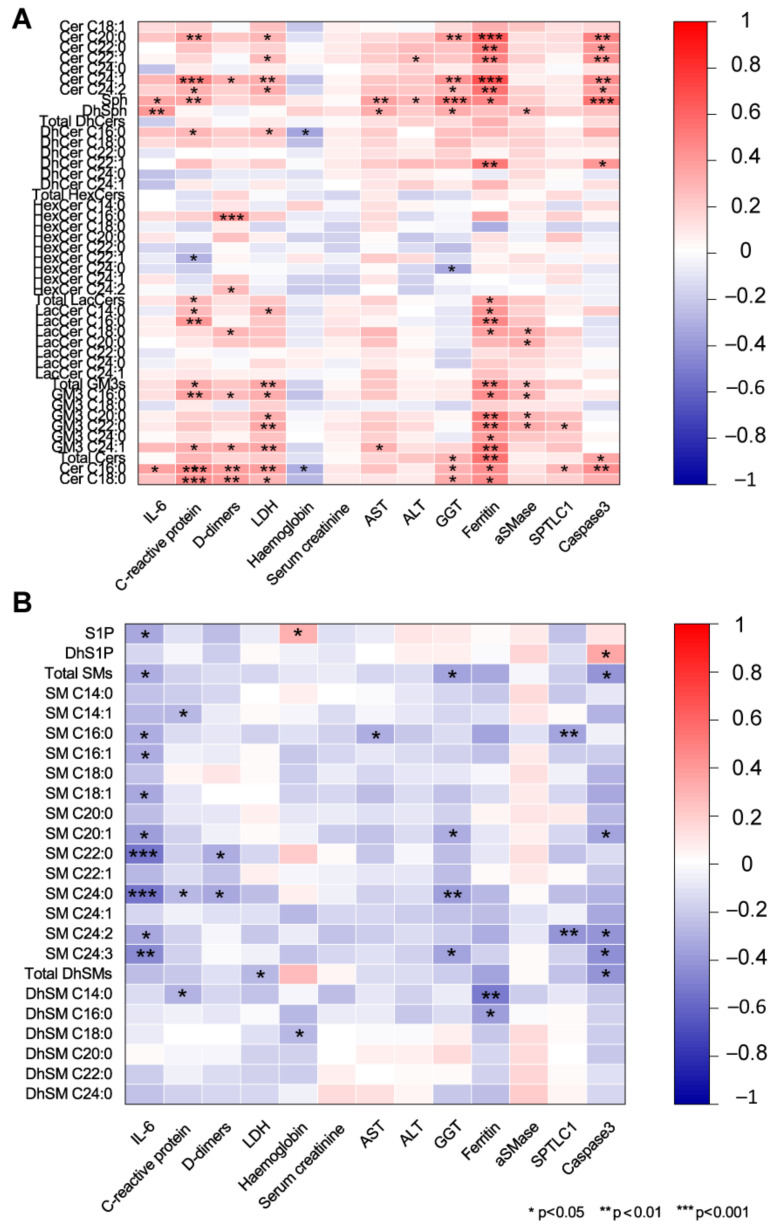
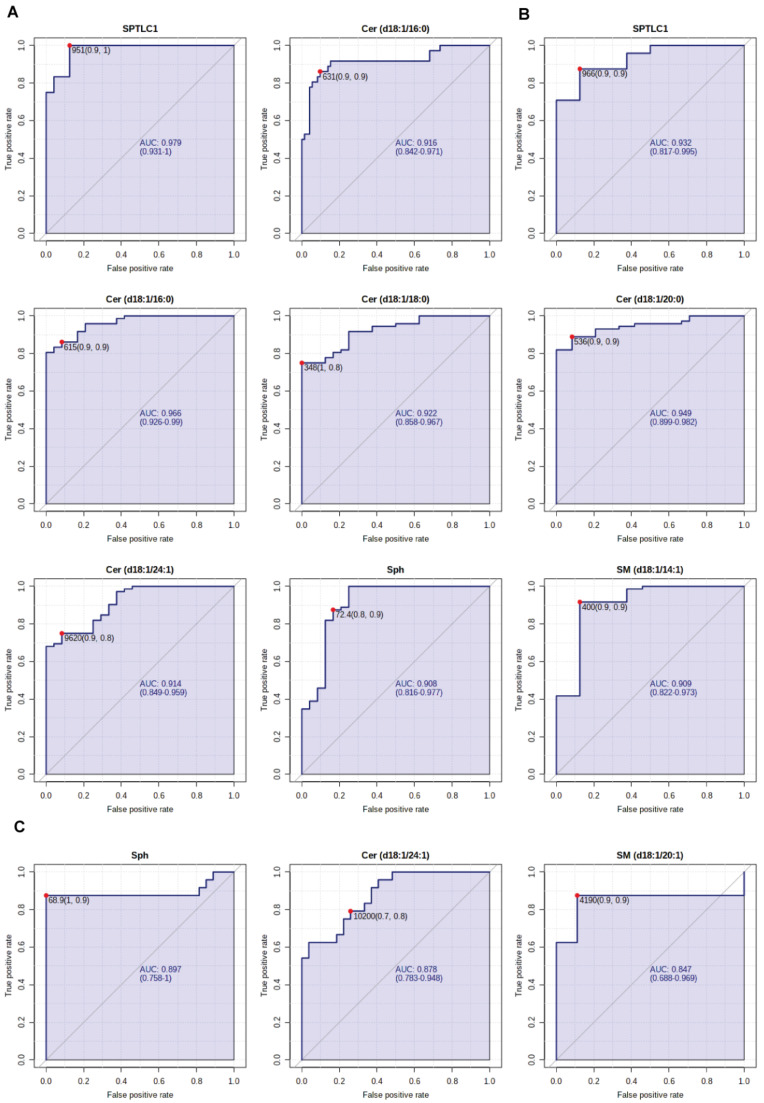
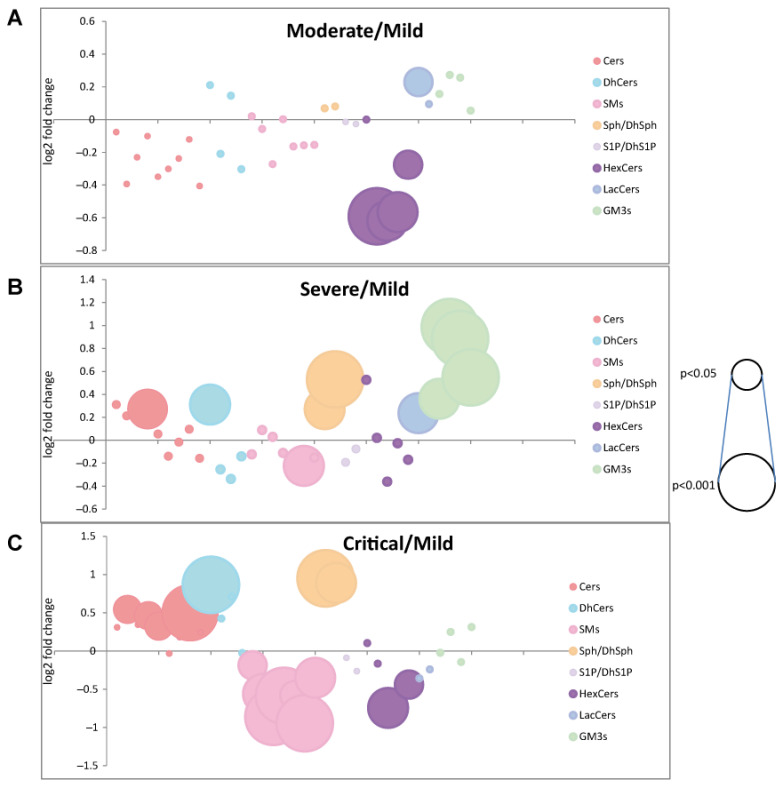
The reason behind the high inter-individual variability in response to SARS-CoV-2 infection and patient's outcome is poorly understood. The present study targets the sphingolipid profile of twenty-four healthy controls and fifty-nine COVID-19 patients with different disease severity. Sera were analyzed by untargeted and targeted mass spectrometry and ELISA. Results indicated a progressive increase in dihydrosphingosine, dihydroceramides, ceramides, sphingosine, and a decrease in sphingosine-1-phosphate. These changes are associated with a serine palmitoyltransferase long chain base subunit 1 (SPTLC1) increase in relation to COVID-19 severity. Severe patients showed a decrease in sphingomyelins and a high level of acid sphingomyelinase (aSMase) that influences monosialodihexosyl ganglioside (GM3) C16:0 levels. Critical patients are characterized by high levels of dihydrosphingosine and dihydroceramide but not of glycosphingolipids. In severe and critical patients, unbalanced lipid metabolism induces lipid raft remodeling, leads to cell apoptosis and immunoescape, suggesting active sphingolipid participation in viral infection. Furthermore, results indicated that the sphingolipid and glycosphingolipid metabolic rewiring promoted by aSMase and GM3 is age-dependent but also characteristic of severe and critical patients influencing prognosis and increasing viral load. AUCs calculated from ROC curves indicated ceramides C16:0, C18:0, C24:1, sphingosine and SPTLC1 as putative biomarkers of disease evolution.

Keywords: COVID-19; COVID-19 severity; acid sphingomyelinase; caspase 3; frailty; mass spectrometry; serine palmitoyltransferase; sphingolipids.


Conflict of interest statement

The authors declare no conflict of interest.

Figures

Figure 1
Figure 1
Heatmap of hierarchical clustering of the 68 sphingolipids quantified by LC-MS/MS in healthy controls (HC) and in COVID-19 patients (mild, moderate, severe, critical). Sphingolipids’ average abundances for each class are displayed.
Figure 2
Figure 2
Serum sphingolipid changes related to COVID-19 in de-novo synthesis pathway. (A) Close up of de novo synthesis pathway, highlighted in light blue. (B) Log 2 fold changes in the median values of DhSph and DhCers in COVID-19 severity groups vs. healthy controls (HC). (C) Box plots of DhSph, DhCer C16:0, DhCer C18:0, DhCer C22:0, and DhCer C22:1 serum levels, according to COVID-19 severity. Box plots and whiskers represent the interquartile range with median value (central line) and the lowest and largest data point measured, respectively. Each measurement was performed in triplicate. Data were analyzed using Kruskal-Wallis ANOVA, followed by Dunn’s post hoc test for multiple comparisons. * p-value < 0.05, ** p-value < 0.01, *** p-value < 0.001.
Figure 3
Figure 3
Ceramides changes in COVID-19. (A) Close up showing the central role of ceramide in the sphingolipid biosynthetic/catabolic pathway. (B) Log 2 fold changes in the median values of ceramides (C16:0, C16:1, C18:0, C18:1, C20:0, C20:1, C22:0, C22:1, C24:0, C24:1, C24:2) in COVID-19 severity groups vs. healthy controls (HC). (C) Box plots of serum ceramide species changed according to COVID-19 severity (C16:0, C16:1, C18:0, C18:1, C20:0, C22:0, C22:1, C24:1, C24:2). Each measurement was performed in triplicate. Data were analyzed using Kruskal-Wallis ANOVA, followed by Dunn’s post hoc test for multiple comparisons. * p-value < 0.05, ** p-value < 0.01, *** p-value < 0.001.
Figure 4
Figure 4
Sphingosine and sphingosine-1-phosphate changes in COVID-19. (A) Close up of the catabolic pathway, highlighted in yellow. (B) Box plots of sphingosine serum levels. (C) Box-plot of S1P serum levels. Each measurement was performed in triplicate. Data were analyzed using Kruskal-Wallis ANOVA, followed by Dunn’s post hoc test for multiple comparisons. * p-value < 0.05, ** p-value < 0.01, *** p-value < 0.001.
Figure 5
Figure 5
(A) Serum sphingolipid changes related to COVID-19 in the sphingomyelinase pathway, highlighted in pink. (B) Log 2 fold changes of the median values of SMs (C14:0, C14:1, C16:0, C16:1, C18:0, C18:1, C20:0, C20:1, C22:0, C22:1, C24:0, C24:1, C24:2, C24:3) in COVID-19 severity groups vs. healthy controls (HC). (C) Box plots of serum SM species changed according to COVID-19 severity (C16:0, C18:1, C20:1, C22:0, C22:1 C24:0, C24:1). Each measurement was performed in triplicate. Data were analyzed using Kruskal-Wallis ANOVA, followed by Dunn’s post hoc test for multiple comparisons. * p-value < 0.05, ** p-value < 0.01, *** p-value < 0.001.
Figure 6
Figure 6
(A) Serum sphingolipid changes related to COVID-19 in the glycosphingolipid pathway, highlighted in green. (B) Log 2 fold changes of median values of HexCers (C14:0, C16:0, C20:0, C20:1, C22:0, C22:1, C24:0, C24:1, C24:2), LacCers (C14:0, C16:0, C18:0, C20:0, C22:0, C24:0, C24:1) and GM3s (C16:0, C18:0, C20:0, C22:0, C24:0, C24:1) in COVID-19 severity groups vs. healthy controls (HC). (C) Box plots of glycosphingolipid species changed according to COVID-19 severity (HexCers C16:0, C20:0, C22:0, C24:0, C24:2, LacCer C16:0, GM3s C16:0, C20:0, C22:0, C24:1). (D) Serum levels of GM3 C16:0 considering young HC and aged HC. Each measurement was performed in triplicate. Data were analyzed using Kruskal-Wallis ANOVA, followed by Dunn’s post hoc test for multiple comparisons. * p-value < 0.05, ** p-value < 0.01, *** p-value < 0.001.
Figure 7
Figure 7
Scatter interval plots of acid SMase (A,B), serine palmitoyltransferase subunit 1 (SPTLC1) (C) and, caspase 3 (D) in serum of HC subjects, mild, moderate, severe, and critical patients, detected by ELISA assay. Each measurement was performed in duplicate. Data were analyzed using Kruskal-Wallis ANOVA, followed by Dunn’s post hoc test for multiple comparisons. * p-value < 0.05, ** p-value < 0.01, *** p-value < 0.001.
Figure 8
Figure 8
Spearman correlations between sphingolipid serum levels and circulating markers (IL-6, C-reactive protein, D-dimer, lactate dehydrogenase, hemoglobin, serum creatinine, aspartate aminotransferase, alanine aminotransferase, gamma-glutamyl transpeptidase, ferritin, and acid sphingomyelinase). (A) Ceramides, sphingosine, dihydrosphingosine, dihydroceramides, hexosylceramides, lactosylceramides, GM3s showed positive associations with all circulating markers except for hemoglobin, whereas (B) S1P, sphingomyelins, and dihydrosphingomyelins were negatively correlated. * p-value  <  0.05, ** p-value  <  0.01, *** p-value  <  0.001.
Figure 9
Figure 9
(A) ROC curve analyses of SPTLC1 and Cer C16:0 for patients with severe COVID-19 disease and HC subjects; (B) ROC curve analyses of SPTLC1, Cers C16:0, C18:0, C20:0, C24:1, Sph, SM C14:1 for patients with critical COVID-19 disease and HC subjects; (C) ROC curve analyses of Sph, Cer C24:1, SM C20:1 for patients with critical and mild COVID-19 disease. AUC values and 95% confidence intervals are reported, as well as cut-off values and sensitivity and specificity values in brackets.
Figure 10
Figure 10
Bubble plots of log2 fold changes in abundance of sphingolipid species in serum from moderate (A), severe (B), and critical (C) patients compared to mild patients are shown. Bubble size represents the p-value from Kruskal Wallis ANOVA.

References

    1. Gandhi R.T., Lynch J.B., Del Rio C. Mild or Moderate Covid-19. N. Engl. J. Med. 2020;383:1757–1766. doi: 10.1056/NEJMcp2009249. - DOI - PubMed
    1. Murthy S., Gomersall C.D., Fowler R.A. Care for Critically Ill Patients With COVID-19. JAMA. 2020;323:1499–1500. doi: 10.1001/jama.2020.3633. - DOI - PubMed
    1. Wu Z., McGoogan J.M. Characteristics of and Important Lessons From the Coronavirus Disease 2019 (COVID-19) Outbreak in China: Summary of a Report of 72314 Cases From the Chinese Center for Disease Control and Prevention. JAMA. 2020;323:1239–1242. doi: 10.1001/jama.2020.2648. - DOI - PubMed
    1. Wang H., Yang P., Liu K., Guo F., Zhang Y., Zhang G., Jiang C. SARS coronavirus entry into host cells through a novel clathrin- and caveolae-independent endocytic pathway. Cell Res. 2008;18:290–301. doi: 10.1038/cr.2008.15. - DOI - PMC - PubMed
    1. Yeager C.L., Ashmun R.A., Williams R.K., Cardellichio C.B., Shapiro L.H., Look A.T., Holmes K.V. Human aminopeptidase N is a receptor for human coronavirus 229E. Nature. 1992;357:420–422. doi: 10.1038/357420a0. - DOI - PMC - PubMed