. 2021 Sep 28;22(19):10497.
doi: 10.3390/ijms221910497.

Transplantation of Human Induced Pluripotent Stem Cell-Derived Retinal Pigment Epithelium in a Swine Model of Geographic Atrophy

Affiliations

Transplantation of Human Induced Pluripotent Stem Cell-Derived Retinal Pigment Epithelium in a Swine Model of Geographic Atrophy

Anna Duarri et al. Int J Mol Sci. .

Abstract

Background: The aim of this study was to test the feasibility and safety of subretinal transplantation of human induced pluripotent stem cell (hiPSC)-derived retinal pigment epithelium (RPE) cells into the healthy margins and within areas of degenerative retina in a swine model of geographic atrophy (GA).

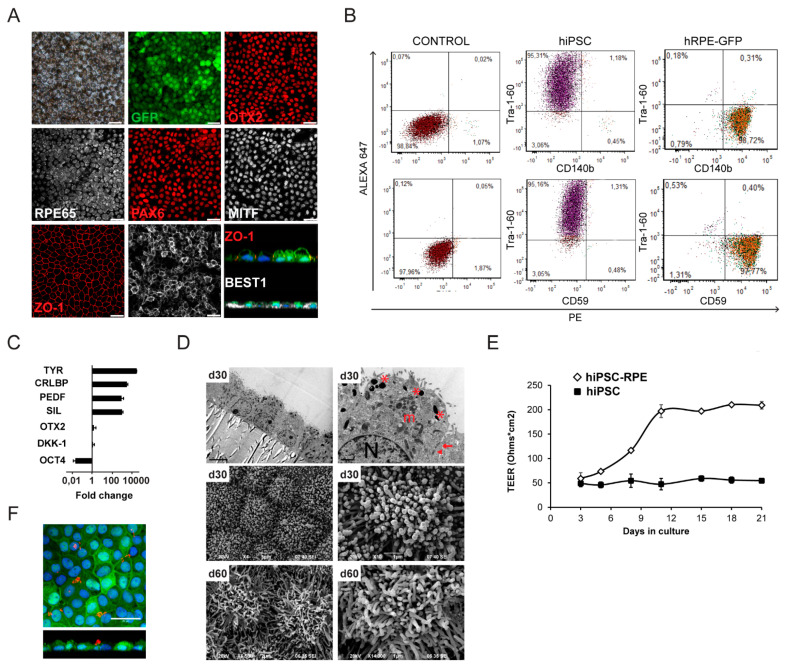
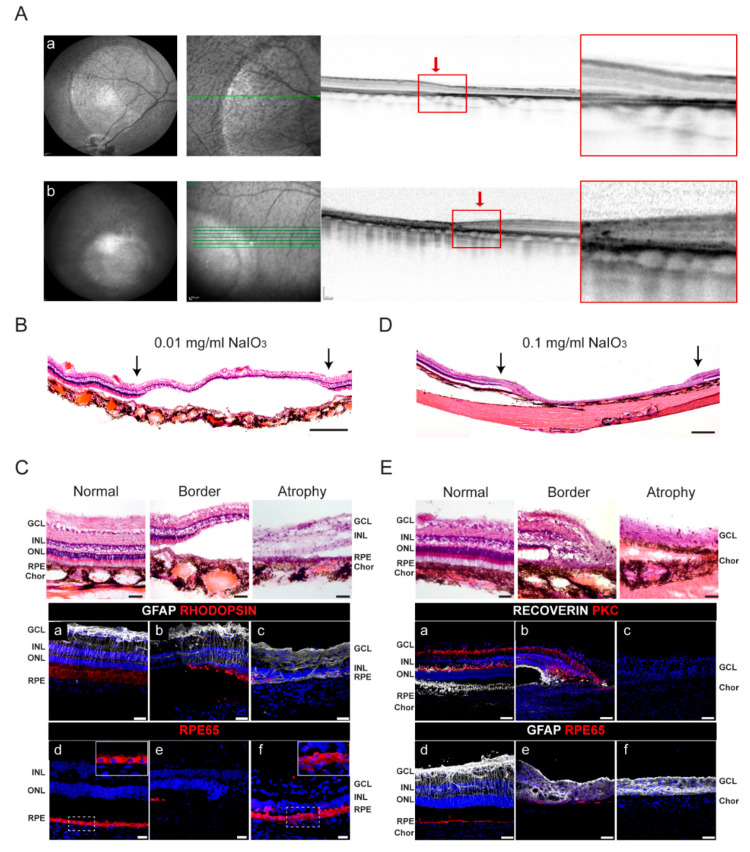
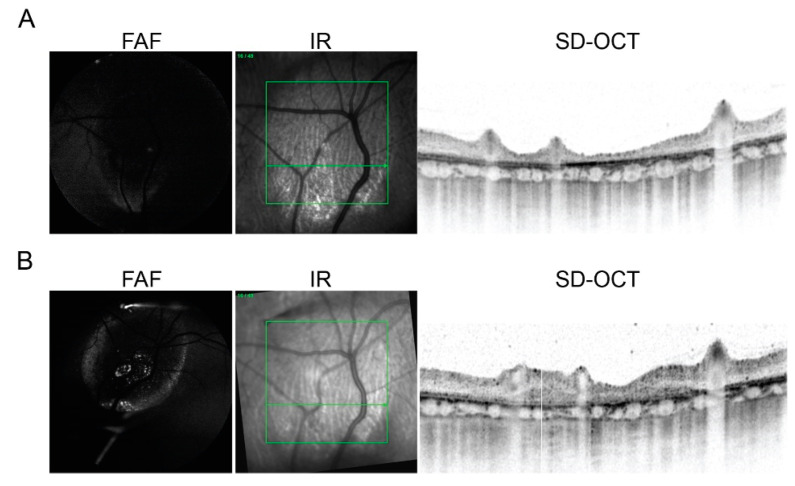
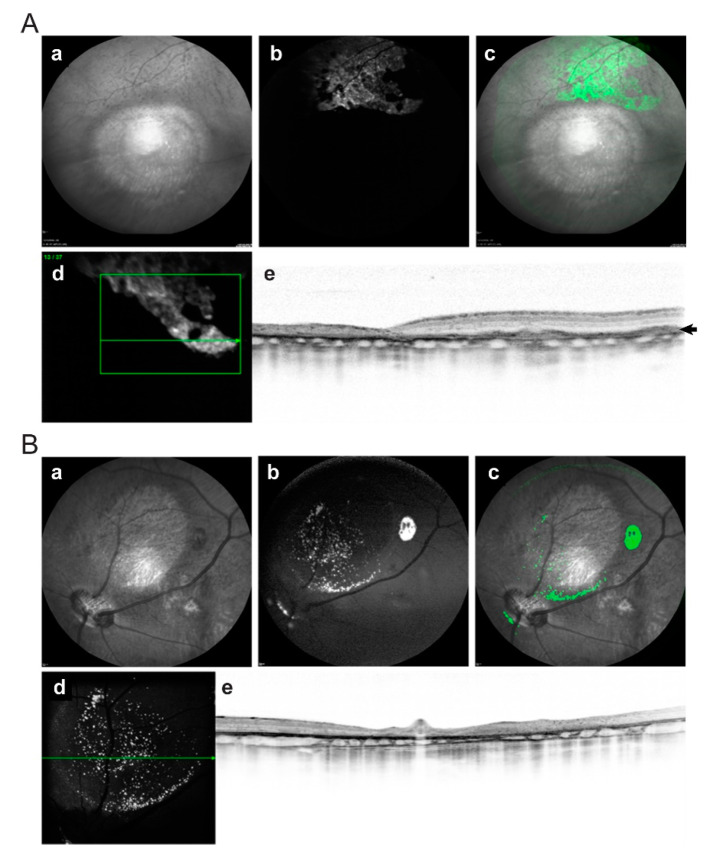
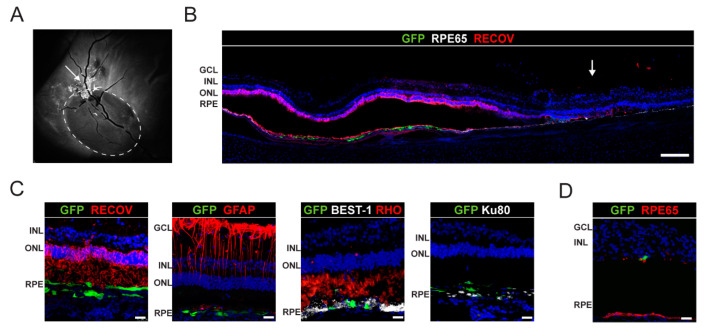
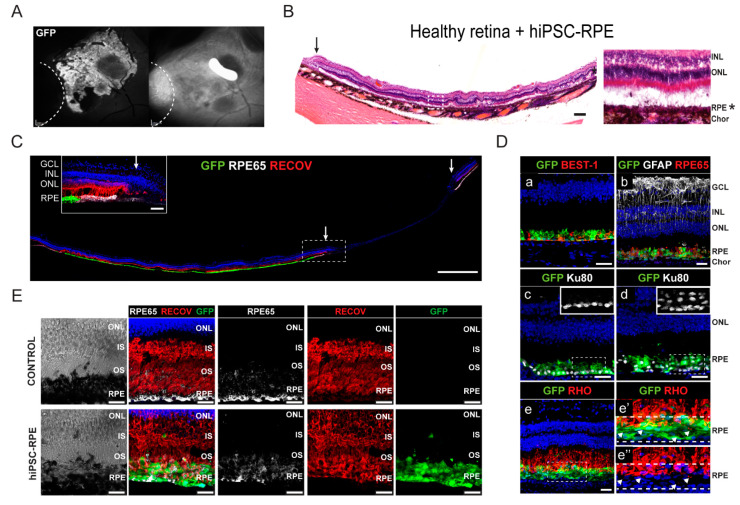
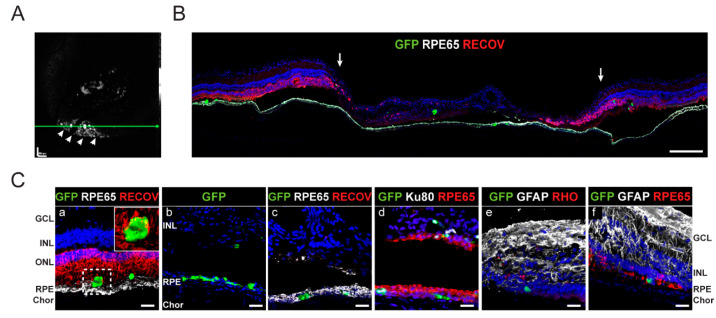
Methods: Well-delimited selective outer retinal damage was induced by subretinal injection of NaIO3 into one eye in minipigs (n = 10). Thirty days later, a suspension of hiPSC-derived RPE cells expressing green fluorescent protein was injected into the subretinal space, into the healthy margins, and within areas of degenerative retina. In vivo follow-up was performed by multimodal imaging. Post-mortem retinas were analyzed by immunohistochemistry and histology.

Results: In vitro differentiated hiPSC-RPE cells showed a typical epithelial morphology, expressed RPE-related genes, and had phagocytic ability. Engrafted hiPSC-RPE cells were detected in 60% of the eyes, forming mature epithelium in healthy retina extending towards the border of the atrophy. Histological analysis revealed RPE interaction with host photoreceptors in the healthy retina. Engrafted cells in the atrophic zone were found in a patchy distribution but failed to form an epithelial-like layer.

Conclusions: These results might support the use of hiPSC-RPE cells to treat atrophic GA by providing a housekeeping function to aid the overwhelmed remnant RPE, which might improve its survival and therefore slow down the progression of GA.

Keywords: RPE; advanced cell therapy; age-related macular degeneration (AMD); animal model; geographic atrophy; iPSC; pig; regenerative medicine; retina; stem cells.


Conflict of interest statement

Jordi Monés is a Scientific consultant for Cellcure, Reneuron, Novartis, Roche, Bayer Allegro, and Kodiek. Grants from Novartis, Bayer, Roche, Thrombogenics, and Iveric. Stock options from Iveric and Notalvision. The funders had no role in the design of the study; in the collection, analyses, or interpretation of data; in the writing of the manuscript, or in the decision to publish the results. The authors declare no conflict of interest.

Figures

Figure 1
Figure 1
Characterization of hiPSC-derived RPE cells expressing GFP. (A) Representative bright-field and immunostaining images showing pigmented hiPSC-RPE at 30 days in culture and the expression of endogenous GFP and RPE markers: BEST-1 (bestrophin-1), ZO-1 (zonula occludens 1), PAX6 (paired box 6), MITF (microphthalmia-associated transcription factor), OTX2 (orthodenticle homeobox 2), and RPE65 (anti-retinal pigment epithelium-specific 65 kDa protein). hiPSC-RPE cells are negative for OCT4 (data not shown). Scale bars: 25 μm. Representative x–z scans of polarized hiPSC-RPE cells (green), apical ZO-1 (red), and basolateral bestrophin (white). Cell nuclei were stained with DAPI (blue). (B) Quantitative flow cytometry analysis of hiPSC and hPRE-GFP cells with surface markers Tra-1-60 (undifferentiated cells), CD140b, and CD59 (RPE-specific), and the appropriate isotype controls. The numbers in the corners show the percentage of stained cells in this gate. (C) Gene expression levels of OCT4, OTX2, SIL (silver), CRLBP (cellular retinal aldehyde-binding protein), PEDF (pigment epithelium-derived factor), and TYR (tyrosinase) in hiPSC-RPE cells by qPCR. Values are normalized to GAPDH and relative to hiPSC, and are expressed as 2-ΔΔCt (log scale). (D) Representative electron microscopy images of hiPSC-RPE cells in Transwell insert cultures at days 30 and 60 in culture. TEM images (top) showing pigmented cuboidal epithelial monolayer, with apical microvilli, melanosomes (asterisk), basal nuclei (N), mitochondria (m), tight junctions (arrow), and adherent junctions (arrowheads). Scale bars: 5 μm (left), 1 μm (right). SEM images (bottom) showing the apical microvilli and polygonal cell morphology. Scale bars: 5 μm (middle left); 2 μm (bottom left); 1 μm (right). (E) Graph showing transepithelial electrical resistance (TEER) for hiPSC and hiPSC-RPE cells at indicated days in culture. (F) Confocal images showing phagocytosis of isolated TRITC-labeled bovine photoreceptor outer segments (POS, red) by hiPSC-RPE (green) in culture. Representative x–y and x–z images show total TRITC-labeled POS (red) taken up by the cells. Nuclei are stained with DAPI (blue). Scale bar: 25 µm.
Figure 2
Figure 2
Selective and severe atrophies induced by subretinal injection of NaIO3 in porcine retinas. (A) Fundus porcine retinas at 1 month after NaIO3 subretinal injection (0.2 mL) at a concentration of 0.01 mg/mL (a). A well-demarcated round area is shown by IR fundus imaging after NaIO3 injection in pig 4. The 30° fundus IR image with overlying position of B-Scan (middle panel; green line) and cross-sectional SD-OCT B-scan demonstrate selective loss of the outer retinal layers. The outer plexiform layer and inner nuclear layer are directly on the damaged RPE, as occurs in GA in humans. (b) By contrast, a severe round atrophy is shown by IR and SD-OCT imaging after NaIO3 injection in pig 9. A transition zone (red arrows) is observed between the atrophic and healthy retina in SD-OCT in both (a) and (b). Red squares indicate the enlargement of the atrophic border. (B) Photomerge composition of hematoxylin and eosin (H&E) staining of the lesion induced with 0.01 mg/mL NaIO3 in pig 4. Arrows indicate the border of the atrophy. Scale bar: 200 µm. (C) (Top panels) Images of H&E staining showing different parts of porcine healthy and atrophic retina of the lesion induced with 0.01 mg/mL NaIO3. Scale bars: 50 µm. (Bottom panels) Immunofluorescence images of different areas (healthy (a,d), border (b,e), and mild atrophy (c,f)) labeled with glial fibrillary acidic protein (GFAP), retinal pigment epithelium-specific 65 kDa protein (RPE65) and rhodopsin. Insets in (C (d) and (f)) show an enlargement of the RPE layer stained with RPE65. Scale bars: 50 µm. (D) Photomerge composition of H&E staining of the lesion induced with 0.1 mg/mL NaIO3 in pig 8. Arrows indicate the border of the atrophy. Scale bar: 200 µm. (E) (Top panels) Images of H&E staining showing different parts of porcine healthy and atrophic retina of the lesion induced with 0.1 mg/mL NaIO3. Scale bars: 50 µm. (Bottom panels) Immunofluorescence images of the different zones of the eyes (healthy (a,d), border (b,e), and severe atrophy (c,f)) labeled with recoverin, protein kinase C alpha (PKC), GFAP, and RPE65. Scale bars: 50 µm. Nuclei are stained with DAPI (blue). NaIO3, sodium iodate; IR, infrared image; SD-OCT, spectral-domain optic coherence tomography; RPE, retinal pigment epithelium; ONL, outer nuclear layer; INL, inner nuclear layer; GCL, ganglion cell layer; GFP, green fluorescent protein; Chor, choroid.
Figure 3
Figure 3
Representative image of FAF and SD-OCT of (A) prior to and (B) two weeks after hiPSC-RPE cell subretinal injection in pig 6. (A) The day before hiPSC-RPE cell injection, no evidence of hyper-autofluorescence due to GFP expression is observed on FAF, and a marked atrophy and thinning of all retinal layers is present on SD-OCT. (B) Fifteen days after the hiPSC-RPE cell injection, several foci of hyper-autofluorescence are observed inside the area of atrophy on FAF, but also an increase in retinal thickness as compared with (A). Green squares delineate scan area and green horizontal line show scan directions and level of right image FAF, fundus autofluorescence; GFP, green fluorescence protein; SD-OCT, spectral-domain optic coherence tomography; RPE, retinal pigment epithelium.
Figure 4
Figure 4
Multimodal fundus imaging showing the presence of hiPSC-RPE cells in healthy (A) and atrophic (B) retina in pigs 9 and 7 respectively, at 3 months post-injection. Well-demarcated round areas by IR fundus (a) four months after NaIO3 subretinal injection. FAF (b) showing hyper-autofluorescence generated by the GFP expression in subretinal injected hiPSC-RPE cells. Pseudo-colored images (c) from increased autofluorescence in FAF imaging using Fiji show widespread (A, c,d) and localized (B, c,d) hiPSC-RPE cells (in green) outside the atrophic area, but also inside the atrophy region (B, d). On FAF-guided SD-OCT, a well-organized RPE monolayer appears between native RPE and photoreceptors (A, e) as a new hyper-reflective layer of hiPSC-RPE cells in healthy retina. A granular distribution of the hiPSC-RPE cells (hyper-reflective dots) is shown in the outer retinal layers of the atrophic retina (B, e). Green squares delineate scan area and green horizontal line show scan directions and level. FAF, fundus autofluorescence; GFP, green fluorescence protein; NaIO3, sodium iodate; SD-OCT, spectral-domain optic coherence tomography; RPE, retinal pigment epithelium.
Figure 5
Figure 5
Analysis of engrafted hiPSC-RPE cells in the host porcine retinas at two weeks post-transplantation in pig 4. (A) FAF shows hyper-fluorescence corresponding to hiPSC-RPE cells located in an area covering the healthy retina, the limiting margin, and a small part of the atrophy (circle denotes the atrophic zone). (B) Immunohistochemical analysis shows hiPSC-RPE cell integration in healthy retinas close to the margin of the atrophy stained with RPE65 and recoverin (RECOV) (white arrow indicates the atrophy border). Scale bar: 250 µm. (C) Confocal images show engrafted hiPSC-RPE cells (GFP in green) in healthy retina, stained with recoverin and rhodopsin (RECOV and RHO), expressing bestrophin-1 (BEST-1) and Ku80 (human nuclear marker). Astrocytes show normal morphology (GFAP). Scale bars: 25 µm. (D) Immunofluorescence images of hiPSC-RPE integration in atrophic areas stained with RPE65. Scale bars: 25 µm. Cell nuclei were stained with DAPI (blue). FAF, fundus autofluorescence; RPE, retinal pigment epithelium; OS, outer segments; ONL, outer nuclear layer; INL, inner nuclear layer; GCL, ganglion cell layer; Chor, choroid; GFP, green fluorescent protein.
Figure 6
Figure 6
Analysis of engrafted hiPSC-RPE cells in healthy porcine retinas at three months post-transplantation in pigs 6 and 9. (A) Post-fixed FAF and IR of transplanted hiPSC-RPE cells in healthy retinas near the atrophy border. Atrophy is marked with a dashed line. (B) Compositions of hematoxylin and eosin (H&E) staining showing transplanted hiPSC-RPE cells (asterisk) in healthy retina. Arrow indicates the atrophy border. Scale bar: 400 µm. White dashed square indicates a higher magnification image (right panel) showing the transplanted hiPSC-RPE cell layer (asterisk). Note that green fluorescence could not be seen after H&E staining. (C) Confocal composition of integrated hiPSC-RPE cell layer in the healthy retina extending towards the transition zone of the atrophic area in pig 9 immunolabeled with RPE65 and recoverin (RECOV). Scale bars: 1000 µm. Inset shows magnification of the margin of the atrophy indicated by a dashed square. Arrows indicate atrophy border. Scale bars: 50 µm. (D) Immunohistochemical staining of engrafted hiPSC-RPE cells in healthy retina showing the expression of RPE-specific markers bestrophin-1 (BEST-1) and RPE65 (a,b). Retinal glia was stained with GFAP. The human nuclear antigen Ku80 was used to detect human cells corresponding to transplanted hiPSC-RPE cells (c,d, insets show magnification of Ku80+ nuclei). Photoreceptor cells were detected by rhodopsin (RHO) marker (e). Enlargement RHO (e′,e″) immunofluorescence images showing contact between hiPSC-RPE cells and photoreceptor outer segments revealing numerous immunolabeled phagosomes (white arrowheads). Dashed lines indicate the GFP+ hiPSC-RPE layer. Scale bars: 25 µm. (E) Bright-field images of control and transplanted retinas (left panels). Immunohistochemical staining of control retina and transplanted retina with engrafted hiPSC-RPE cells showing the expression of RPE-specific marker RPE65 and photoreceptor marker recoverin (RECOV) (right panels). Scale bars: 25 µm. Cell nuclei were stained with DAPI (blue). FAF, fundus autofluorescence; IR, infrared image; RPE, retinal pigment epithelium; ONL, outer nuclear layer; INL, inner nuclear layer; GCL, ganglion cell layer; Chor, choroid; GFP, green fluorescent protein.
Figure 7
Figure 7
Analysis of hiPSC-RPE cell engraftment in atrophic porcine retinas in pigs 7 and 1. (A) In vivo FAF corresponding to the atrophic area transplanted with hiPSC-RPE cells in pig 7 at three months post-transplantation shows punctual integration of cells that are more prominent in the atrophic border (white arrowheads). Scale bar: 600 µm. (Green horizontal line show OCT scan level, not shown)(B) Immunostaining composition of the atrophic area stained with RPE65 and recoverin (RECOV) corroborates punctual engraftment of hiPSC-RPE cells. Arrows indicate atrophy borders. Scale bar: 250 µm. (C) Detailed confocal images of hiPSC-RPE cells engrafted in the atrophy margin (a) located in the RPE layer (RPE65) interacting with photoreceptors (RECOV), and in the atrophy (b–e) within the RPE layer (RPE65) and the remaining INL. Transplanted hiPSC-RPE expressed human nuclei marked with Ku80 (d). Astrocyte disorganization is shown by GFAP (e,f) and the lack of photoreceptor by RECOV (c) and rhodopsin (RHO) (e). Scale bars: 25 µm. At six months, few hiPSC-RPE cells integrated in the RPE layer (RPE65) within the atrophic area (f). Scale bars: 50 µm. Cell nuclei were stained with DAPI (blue). FAF, fundus autofluorescence; RPE, retinal pigment epithelium; ONL, outer nuclear layer; INL, inner nuclear layer; GCL, ganglion cell layer; Chor, choroid; GFP, green fluorescent protein.

References

    1. Colijn J.M., Buitendijk G.H., Prokofyeva E., Alves D., Cachulo M.L., Khawaja A.P., Cougnard-Gregoire A., Merle B.M., Korb C., Erke M.G., et al. Prevalence of Age-Related Macular De-generation in Europe: The Past and the Future. Ophthalmology. 2017;124:1753–1763. doi: 10.1016/j.ophtha.2017.05.035. - DOI - PMC - PubMed
    1. Chirco K.R., Sohn E., Stone E.M., Tucker B., Mullins R.F. Structural and molecular changes in the aging choroid: Implications for age-related macular degeneration. Eye. 2016;31:10–25. doi: 10.1038/eye.2016.216. - DOI - PMC - PubMed
    1. Chen Y., Bedell M., Zhang K. Age-related Macular Degeneration: Genetic and Environmental Factors of Disease. Mol. Interv. 2010;10:271–281. doi: 10.1124/mi.10.5.4. - DOI - PMC - PubMed
    1. Bracha P., Moore N.A., Ciulla T. Induced pluripotent stem cell-based therapy for age-related macular degeneration. Expert Opin. Biol. Ther. 2017;17:1113–1126. doi: 10.1080/14712598.2017.1346079. - DOI - PubMed
    1. Lewis P.M., Ayton L.N., Guymer R.H., Lowery A.J., Blamey P.J., Allen P.J., Luu C.D., Rosenfeld J.V. Advances in implantable bionic devices for blindness: A review. ANZ J. Surg. 2016;86:654–659. doi: 10.1111/ans.13616. - DOI - PMC - PubMed

MeSH terms

Substances