. 2021 Oct 4;22(19):10750.
doi: 10.3390/ijms221910750.

Single-Tear Proteomics: A Feasible Approach to Precision Medicine

Affiliations

Single-Tear Proteomics: A Feasible Approach to Precision Medicine

Erika Ponzini et al. Int J Mol Sci. .

Abstract

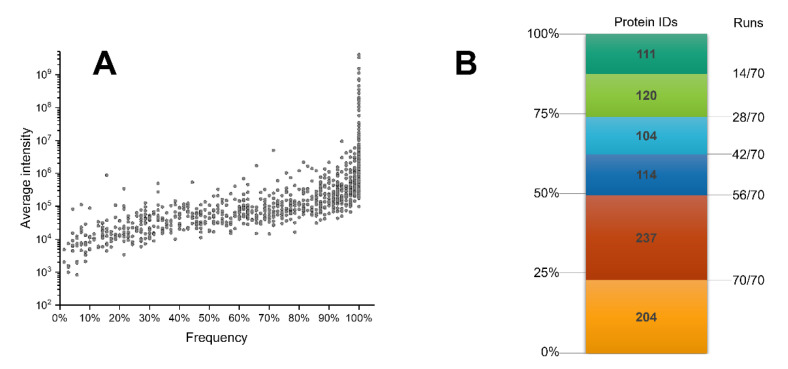
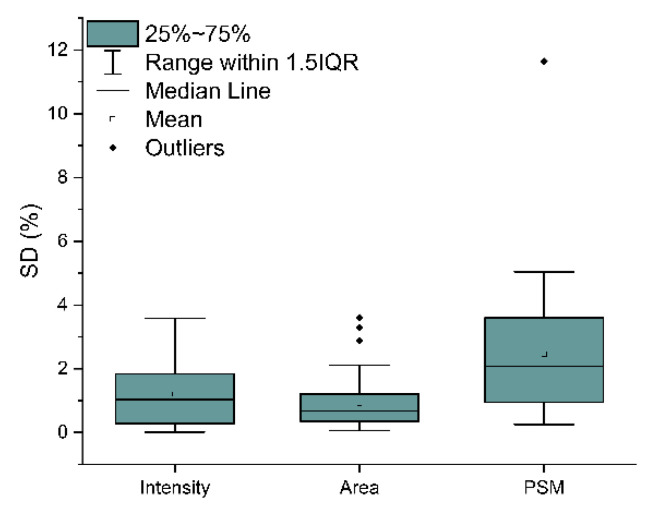
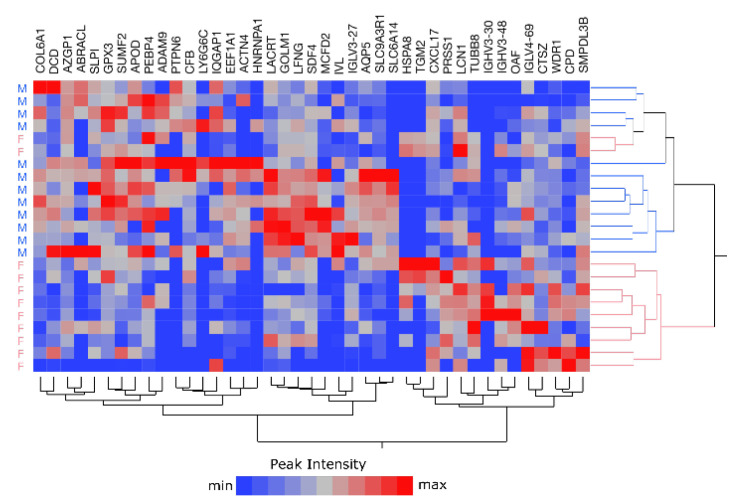
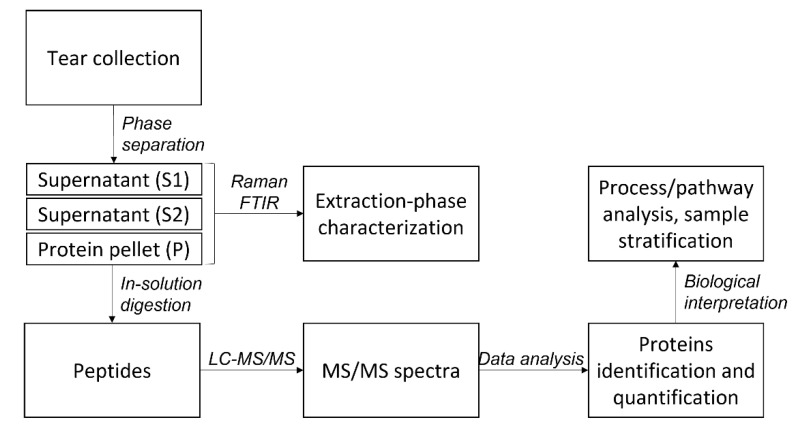
Lacrimal fluid is an attractive source of noninvasive biomarkers, the main limitation being the small sample amounts typically collected. Advanced analytical methods to allow for proteomics profiling from a few microliters are needed to develop innovative biomarkers, with attractive perspectives of applications to precision medicine. This work describes an effective, analytical pipeline for single-tear analysis by ultrahigh-resolution, shotgun proteomics from 23 healthy human volunteers, leading to high-confidence identification of a total of 890 proteins. Highly reproducible quantification was achieved by either peak intensity, peak area, or spectral counting. Hierarchical clustering revealed a stratification of females vs. males that did not emerge from previous studies on pooled samples. Two subjects were monitored weekly over 3 weeks. The samples clustered by withdrawal time of day (morning vs. afternoon) but not by follow-up week, with elevated levels of components of the immune system in the morning samples. This study demonstrates feasibility of single-tear quantitative proteomics, envisaging contributions of this unconventional body fluid to individualized approaches in biomedicine.

Keywords: lacrimal film; liquid biopsies; mass-spectrometry-based proteomics; peripheral body fluids; personalized medicine; single-tear analysis.


Conflict of interest statement

The authors declare no conflict of interest.

Figures

Figure 1
Figure 1
Pictures of the protein extraction phases acquired by the optical microscope integrated within the Raman instrument. Tears, unprocessed sample; S1, aqueous layer; S2, organic solvent layer; P, pellet.
Figure 2
Figure 2
Raman (RS) spectra of protein extraction phases. Tears, unprocessed sample; S1, aqueous layer; S2, organic solvent layer; P, pellet. The assignment of selected peaks is shown, employing the annotation suggested by Czamara et al. (α, scissoring; β, bending; τ, twisting; υ, stretching) [24].
Figure 3
Figure 3
Fourier transform infrared (FTIR) spectra of protein extraction phases. Tears, unprocessed sample; S1, aqueous layer; S2 organic solvent layer; P, pellet. The wavenumber and the assignment of selected peaks are shown. * Overlapping absorption of lipids (hydrocarbon chains/head groups) and proteins; ** Overlapping absorption of carbohydrates and phosphates.
Figure 4
Figure 4
Virtual 2D map (theoretical MW vs. pI) of the identified proteins. The mean abundance of each protein is represented by the color scale reported on the right side, calculated as the average from its 3 most intense peptides, over 70 runs.
Figure 5
Figure 5
Identification sensitivity and reproducibility. (A) Correlation between the frequency of identification of each protein over the 70 runs and its average intensity. (B) Stacked, colored boxes represent the identification frequencies over the 70 runs.
Figure 6
Figure 6
Box plot of the intensity of the 10 most abundant proteins over 70 runs. Each box represents the interquartile range between the 25th and the 75th percentile, whereas the whiskers represent the range between the 5th and the 95th percentile. The median and mean values are also reported, as a line and an empty square, respectively. Outliers are represented by black diamonds. Proteins are indicated by their gene name: LYZ, lysozyme C; LCN1, lipocalin-1; LTF, lactotransferrin; SCGB2A1, mammaglobin-B; IGHA1, immunoglobulin heavy constant alpha 1; LACRT, extracellular glycoprotein lacritin; PIP, prolactin-inducible protein; PRR2, proline-rich protein 4; SCB1D1, secretoglobin family 1D member 1; IGKC, immunoglobulin kappa constant.
Figure 7
Figure 7
Box plot of the standard deviation obtained in the label-free quantification (LFQ) by normalized peak intensity, peak area, and peptide spectrum match (PSM).
Figure 8
Figure 8
Bar charts of the protein classes obtained with the 890 proteins identified in this work, using the Protein Analysis Through Evolutionary Relationships (PANTHER) program. The results are compared with the protein list published by Dor and coworkers [15]. Protein classes displaying a log2(fold change) ≥|1| are highlighted by stronger saturated colors.
Figure 9
Figure 9
Double-hierarchical clustering analysis of 41 tear proteins selected by linear discriminant analysis (LDA) and 23 samples (pink: F, female; blue: M, male). LFQ by peak intensity is represented by a color code from blue to red, according to increasing abundances.
Figure 10
Figure 10
Double-hierarchical clustering analysis of 27 tear proteins selected by LDA and 12 samples (green, morning; orange, afternoon). LFQ by peak intensity is represented by a color code from blue to red, according to increasing abundances. Samples were collected weekly from two subjects over three weeks.
Figure 11
Figure 11
Flowchart illustrating the main steps of the analytical pipeline.

References

    1. Lemp M.A. Advances in understanding and managing dry eye disease. Am. J. Ophthalmol. 2008;146:350–356. doi: 10.1016/j.ajo.2008.05.016. - DOI - PubMed
    1. Zhou L., Beuerman R.W. The power of tears: How tear proteomics research could revolutionize the clinic. Expert Rev. Proteom. 2017;14:189–191. doi: 10.1080/14789450.2017.1285703. - DOI - PubMed
    1. Lawrenson J.G. 2-anterior eye. In: Efron N., editor. Contact Lens Practice. 3rd ed. Elsevier; Amsterdam, The Netherlands: 2018. pp. 10–27.
    1. Phillips A., Speedwell L. Contact Lenses. 6th ed. Elsevier; Amsterdam, The Netherlands: 2018.
    1. Rentka A., Koroskenyi K., Harsfalvi J., Szekanecz Z., Szucs G., Szodoray P., Kemeny-Beke A. Evaluation of commonly used tear sampling methods and their relevance in subsequent biochemical analysis. Ann. Clin. Biochem. 2017;54:521–529. doi: 10.1177/0004563217695843. - DOI - PubMed