. 2021 Oct 5;22(19):10758.
doi: 10.3390/ijms221910758.

Role of Human Primary Renal Fibroblast in TGF-β1-Mediated Fibrosis-Mimicking Devices

Affiliations

Role of Human Primary Renal Fibroblast in TGF-β1-Mediated Fibrosis-Mimicking Devices

Seong-Hye Hwang et al. Int J Mol Sci. .

Abstract

Renal fibrosis is a progressive chronic kidney disease that ultimately leads to end-stage renal failure. Despite several approaches to combat renal fibrosis, an experimental model to evaluate currently available drugs is not ideal. We developed fibrosis-mimicking models using three-dimensional (3D) co-culture devices designed with three separate layers of tubule interstitium, namely, epithelial, fibroblastic, and endothelial layers. We introduced human renal proximal tubular epithelial cells (HK-2), human umbilical-vein endothelial cells, and patient-derived renal fibroblasts, and evaluated the effects of transforming growth factor-β (TGF-β) and TGF-β inhibitor treatment on this renal fibrosis model. The expression of the fibrosis marker alpha smooth muscle actin upon TGF-β1 treatment was augmented in monolayer-cultured HK-2 cells in a 3D disease model. In the vascular compartment of renal fibrosis models, the density of vessels was increased and decreased in the TGF-β-treated group and TGF-β-inhibitor treatment group, respectively. Multiplex ELISA using supernatants in the TGF-β-stimulating 3D models showed that pro-inflammatory cytokine and growth factor levels including interleukin-1 beta, tumor necrosis factor alpha, basic fibroblast growth factor, and TGF-β1, TGF-β2, and TGF-β3 were increased, which mimicked the fibrotic microenvironments of human kidneys. This study may enable the construction of a human renal fibrosis-mimicking device model beyond traditional culture experiments.

Keywords: TGF-β1; fibrosis; renal fibroblast.


Conflict of interest statement

The authors declare no conflict of interest.

Figures
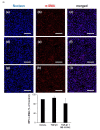
Figure 1
Figure 1
Immunofluorescence shows that the expression of alpha-SMA and keratin-8 (KRT8) were maintained by treatment of TGF-β1 or the inhibitor in HK-2 cells. (A) The expression of alpha-SMA and (B) CCK-8 had no effect on HK-2 cells by TGF-β1 (5 ng/mL) or the inhibitor. Cells were originally plated at a density of 1 × 10⁵ per well (a–c) untreated control and (d–f) stimulated with 5 ng/mL TGF-β1 or (g–i) 10 µM inhibitor (SB 431542) for 24 h and fixated with 4% paraformaldehyde. The cells were then stained with anti-α-SMA and anti-cytokeratin-8 for 20 min. Co-staining with Hoechst dye H33342 to identify cell nuclei was performed. Scale bars in micrographs indicate 200 µm.
Figure 1
Figure 1
Immunofluorescence shows that the expression of alpha-SMA and keratin-8 (KRT8) were maintained by treatment of TGF-β1 or the inhibitor in HK-2 cells. (A) The expression of alpha-SMA and (B) CCK-8 had no effect on HK-2 cells by TGF-β1 (5 ng/mL) or the inhibitor. Cells were originally plated at a density of 1 × 10⁵ per well (a–c) untreated control and (d–f) stimulated with 5 ng/mL TGF-β1 or (g–i) 10 µM inhibitor (SB 431542) for 24 h and fixated with 4% paraformaldehyde. The cells were then stained with anti-α-SMA and anti-cytokeratin-8 for 20 min. Co-staining with Hoechst dye H33342 to identify cell nuclei was performed. Scale bars in micrographs indicate 200 µm.
Figure 2
Figure 2
KRT8 expression in HK-2 and total length and diameter of the HUVECs. (A) Immunofluorescence shows that the expression of α-SMA was maintained and KRT8 expression was dramatically decreased by treatment of TGF-β1 in HK-2. Cells were plated and stimulated with 5 ng/mL TGF-β1 or 10 μm inhibitor (SB 431542) for 24 h and fixated with 4% paraformaldehyde. The cells were stained with anti-α-SMA and anti-cytokeratin-8 for 20 min. Co-staining with Hoechst dye H33342 to identify cell nuclei was performed. The expression of α-SMA (a–c) had no alteration but KRT8 (d–f) in HK-2 cells and GFP in HUVEC (g–i) expression were significantly changed by TGF-β1 (5 ng/mL) and the inhibitor (B,C). In the total length of the HUVECs, the thin vessel was increased but the thick vessel was decreased by TGF-β1. The diameter was increased in both the thin and thick vessels. These results were reversed by the inhibitor SB431542 (D,E). Scale bars in the micrographs indicate 100 µm. * p < 0.05, ** p < 0.01, *** p < 0.001 versus the control group; ## p < 0.01, ### p < 0.001 versus the TGF-β1 group. Each value represents three technical replicates of each of the three biological replicates. Statistical significance of the length compared to the non-treated cells is represented in the graph. Thin vessels mean a length shorter than 50 µm and thick vessels represent a length longer than 50 µm.
Figure 2
Figure 2
KRT8 expression in HK-2 and total length and diameter of the HUVECs. (A) Immunofluorescence shows that the expression of α-SMA was maintained and KRT8 expression was dramatically decreased by treatment of TGF-β1 in HK-2. Cells were plated and stimulated with 5 ng/mL TGF-β1 or 10 μm inhibitor (SB 431542) for 24 h and fixated with 4% paraformaldehyde. The cells were stained with anti-α-SMA and anti-cytokeratin-8 for 20 min. Co-staining with Hoechst dye H33342 to identify cell nuclei was performed. The expression of α-SMA (a–c) had no alteration but KRT8 (d–f) in HK-2 cells and GFP in HUVEC (g–i) expression were significantly changed by TGF-β1 (5 ng/mL) and the inhibitor (B,C). In the total length of the HUVECs, the thin vessel was increased but the thick vessel was decreased by TGF-β1. The diameter was increased in both the thin and thick vessels. These results were reversed by the inhibitor SB431542 (D,E). Scale bars in the micrographs indicate 100 µm. * p < 0.05, ** p < 0.01, *** p < 0.001 versus the control group; ## p < 0.01, ### p < 0.001 versus the TGF-β1 group. Each value represents three technical replicates of each of the three biological replicates. Statistical significance of the length compared to the non-treated cells is represented in the graph. Thin vessels mean a length shorter than 50 µm and thick vessels represent a length longer than 50 µm.
Figure 3
Figure 3
Sample image with device schematic demonstration of the fabrication and experimental schedule. (A) The top two images show the layout. The left image shows an overall top-down photo of the device. The bottom images show the cross-section. Schematic view detailing the dimensions of the liquid guides. (B) This figure describes the experimental schedules for fibrosis-mimicking devices. Four-step loading process for each well. Location of each hydrogel patterning area, as well as the placement of the media in top-down and isometric cross-section. (1) A total of 1.5 µL of hydrogel 1 is spontaneously guided into the central channel. (2) Central channel is filled with 5 µL of hydrogel. (3) A total of 10 µL of hydrogel 3 are patterned on the reservoir floor. (4) A total of 200 µL of media are dispensed. Red scale bar = 9 mm.
Figure 3
Figure 3
Sample image with device schematic demonstration of the fabrication and experimental schedule. (A) The top two images show the layout. The left image shows an overall top-down photo of the device. The bottom images show the cross-section. Schematic view detailing the dimensions of the liquid guides. (B) This figure describes the experimental schedules for fibrosis-mimicking devices. Four-step loading process for each well. Location of each hydrogel patterning area, as well as the placement of the media in top-down and isometric cross-section. (1) A total of 1.5 µL of hydrogel 1 is spontaneously guided into the central channel. (2) Central channel is filled with 5 µL of hydrogel. (3) A total of 10 µL of hydrogel 3 are patterned on the reservoir floor. (4) A total of 200 µL of media are dispensed. Red scale bar = 9 mm.
Figure 4
Figure 4
Alteration of 3D-cultured HK-2 and HUVECs with primary renal fibroblasts. Total cells were plated at a density of 5 × 10⁵ per 3D chip and stimulated with 5 ng/mL TGF-β1 or 10 μm inhibitor (SB 431542) for 24 h and fixated with 4% paraformaldehyde. (A) Cells in the 3D chip were stained with anti-α-SMA and anti-cytokeratin-8. The expression of α-SMA (ac) was increased and KRT8 (df) expression was decreased by TGF-β1 (5 ng/mL) significantly. The total length of the HUVECs: thin vessels were dramatically increased and thick vessels were decreased by TGF-β1 (D,E). The diameter was decreased for thin and thick vessels (F,G). These results were reversed by the inhibitor SB431542. Scale bars in micrographs indicate 100 µm. * p < 0.05, ** p < 0.01, and *** p < 0.001 versus the control group; # p < 0.05, ## p < 0.01, and ### p < 0.001 versus the TGF-β1 group. Each value represents three technical replicates of each of the three biological replicates. Thin vessels mean a length shorter than 50 µm and thick vessels represent a length longer than 50 µm.
Figure 4
Figure 4
Alteration of 3D-cultured HK-2 and HUVECs with primary renal fibroblasts. Total cells were plated at a density of 5 × 10⁵ per 3D chip and stimulated with 5 ng/mL TGF-β1 or 10 μm inhibitor (SB 431542) for 24 h and fixated with 4% paraformaldehyde. (A) Cells in the 3D chip were stained with anti-α-SMA and anti-cytokeratin-8. The expression of α-SMA (ac) was increased and KRT8 (df) expression was decreased by TGF-β1 (5 ng/mL) significantly. The total length of the HUVECs: thin vessels were dramatically increased and thick vessels were decreased by TGF-β1 (D,E). The diameter was decreased for thin and thick vessels (F,G). These results were reversed by the inhibitor SB431542. Scale bars in micrographs indicate 100 µm. * p < 0.05, ** p < 0.01, and *** p < 0.001 versus the control group; # p < 0.05, ## p < 0.01, and ### p < 0.001 versus the TGF-β1 group. Each value represents three technical replicates of each of the three biological replicates. Thin vessels mean a length shorter than 50 µm and thick vessels represent a length longer than 50 µm.
Figure 5
Figure 5
Comparison of 2D- and 3D-cultured models as renal fibrosis-mimicking platforms. Cells were plated at a density of 5 × 10⁵ per 2D well or 3D chip and stimulated with 5 ng/mL TGF-β1 or 10 µm inhibitor (SB 431542) for 24 h. Primary human renal fibroblasts were used in the 2D-cultured and in the 3D-cultured model. Fibroblasts were utilized at a density of 8 × 10⁴ cultured with HUVECs and HK-2. The primary human renal fibroblast-to-HUVEC ratio, or F:H ratio, was 1:5 for assessing fibrosis. HK-2 cells were used at a density of 2 × 10⁴. Detection of (A) IL-1β, (B) basic fibroblast growth factor (FGF-2), and (CE) TGF-beta 1, 2, and 3 in the supernatant was performed by multiplex analysis of cytokines and multiplex bead immunoassay. Each bar represents the mean ± SE. * p < 0.05, *** p < 0.001 versus 2D; ## p < 0.01, ### p < 0.001 versus TGF-β1.
Figure 5
Figure 5
Comparison of 2D- and 3D-cultured models as renal fibrosis-mimicking platforms. Cells were plated at a density of 5 × 10⁵ per 2D well or 3D chip and stimulated with 5 ng/mL TGF-β1 or 10 µm inhibitor (SB 431542) for 24 h. Primary human renal fibroblasts were used in the 2D-cultured and in the 3D-cultured model. Fibroblasts were utilized at a density of 8 × 10⁴ cultured with HUVECs and HK-2. The primary human renal fibroblast-to-HUVEC ratio, or F:H ratio, was 1:5 for assessing fibrosis. HK-2 cells were used at a density of 2 × 10⁴. Detection of (A) IL-1β, (B) basic fibroblast growth factor (FGF-2), and (CE) TGF-beta 1, 2, and 3 in the supernatant was performed by multiplex analysis of cytokines and multiplex bead immunoassay. Each bar represents the mean ± SE. * p < 0.05, *** p < 0.001 versus 2D; ## p < 0.01, ### p < 0.001 versus TGF-β1.
Figure 6
Figure 6
Real-time PCR shows the overall mRNA expression of the 3D chip. Cells were plated at a density of 5 × 10⁵ per 3D chip and stimulated with 5 ng/mL TGF-β1 or 10 μm inhibitor (SB 431542) for 24 h. Total RNA extracted from the 3D-cultured chip. The mRNA expression of (A) IL-1 β, (B) TNF-α, (C) IL-6, and (D) IL-8 represents the anti-inflammatory effect of TGF-β1 treatment. (E) VEGF expression as an angiogenic factor was increased. (F) IL-10 expression as an anti-fibrotic factor was significantly decreased by TGF-β1. * p < 0.05, ** p < 0.01, *** p < 0.001 versus control; # p < 0.05, ## p < 0.01, ### p < 0.001 versus TGF-β1.
Figure 6
Figure 6
Real-time PCR shows the overall mRNA expression of the 3D chip. Cells were plated at a density of 5 × 10⁵ per 3D chip and stimulated with 5 ng/mL TGF-β1 or 10 μm inhibitor (SB 431542) for 24 h. Total RNA extracted from the 3D-cultured chip. The mRNA expression of (A) IL-1 β, (B) TNF-α, (C) IL-6, and (D) IL-8 represents the anti-inflammatory effect of TGF-β1 treatment. (E) VEGF expression as an angiogenic factor was increased. (F) IL-10 expression as an anti-fibrotic factor was significantly decreased by TGF-β1. * p < 0.05, ** p < 0.01, *** p < 0.001 versus control; # p < 0.05, ## p < 0.01, ### p < 0.001 versus TGF-β1.

References

    1. Border W., Noble N. Transforming growth factor in tissue fibrosis. N. Engl. J. Med. 1994;331:1286–1292. - PubMed
    1. Wang W., Huang X.R., Li A.G., Liu F., Li J., Truong L.D., Wang X.J., Lan H.Y. Signaling mechanism of TGF-beta1 in prevention of renal inflammation: Role of Smad7. J. Am. Soc. Nephrol. 2005;16:1371–1383. doi: 10.1681/ASN.2004121070. - DOI - PubMed
    1. Liu Y. Renal fibrosis: New insights into the pathogenesis and therapeutics. Kidney Int. 2006;69:213–217. doi: 10.1038/sj.ki.5000054. - DOI - PubMed
    1. Andes D., Craig W.A. Animal model pharmacokinetics and pharmacodynamics: A critical review. Int. J. Antimicrob. Agents. 2002;19:261–268. doi: 10.1016/S0924-8579(02)00022-5. - DOI - PubMed
    1. Kim S., Takayama S. Organ-on-a-chip and the kidney. Kidney Res. Clin. Pract. 2015;34:165–169. doi: 10.1016/j.krcp.2015.08.001. - DOI - PMC - PubMed

MeSH terms

Substances

LinkOut - more resources