

ZNF521 Enhances MLL-AF9-Dependent Hematopoietic Stem Cell Transformation in Acute Myeloid Leukemias by Altering the Gene Expression Landscape
- PMID: 34639154
- PMCID: PMC8509509
- DOI: 10.3390/ijms221910814
ZNF521 Enhances MLL-AF9-Dependent Hematopoietic Stem Cell Transformation in Acute Myeloid Leukemias by Altering the Gene Expression Landscape
Abstract
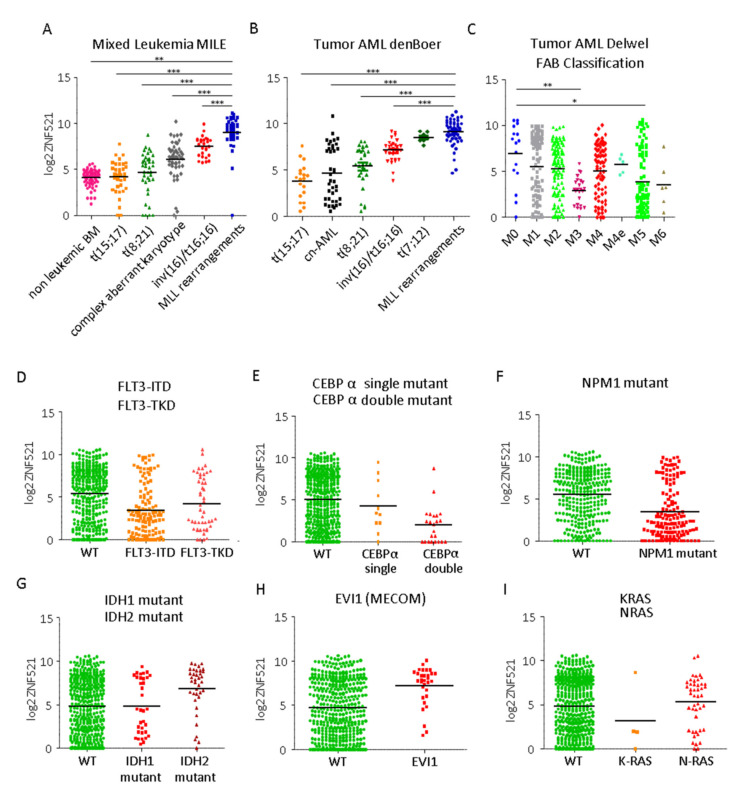
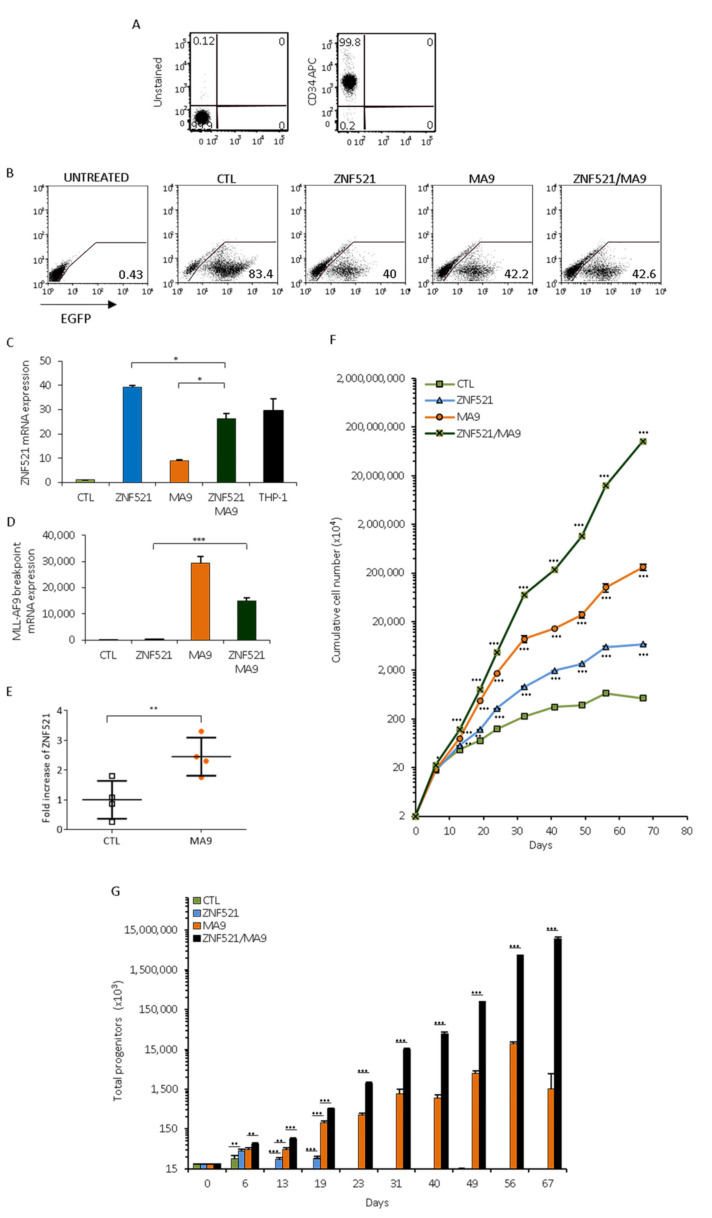
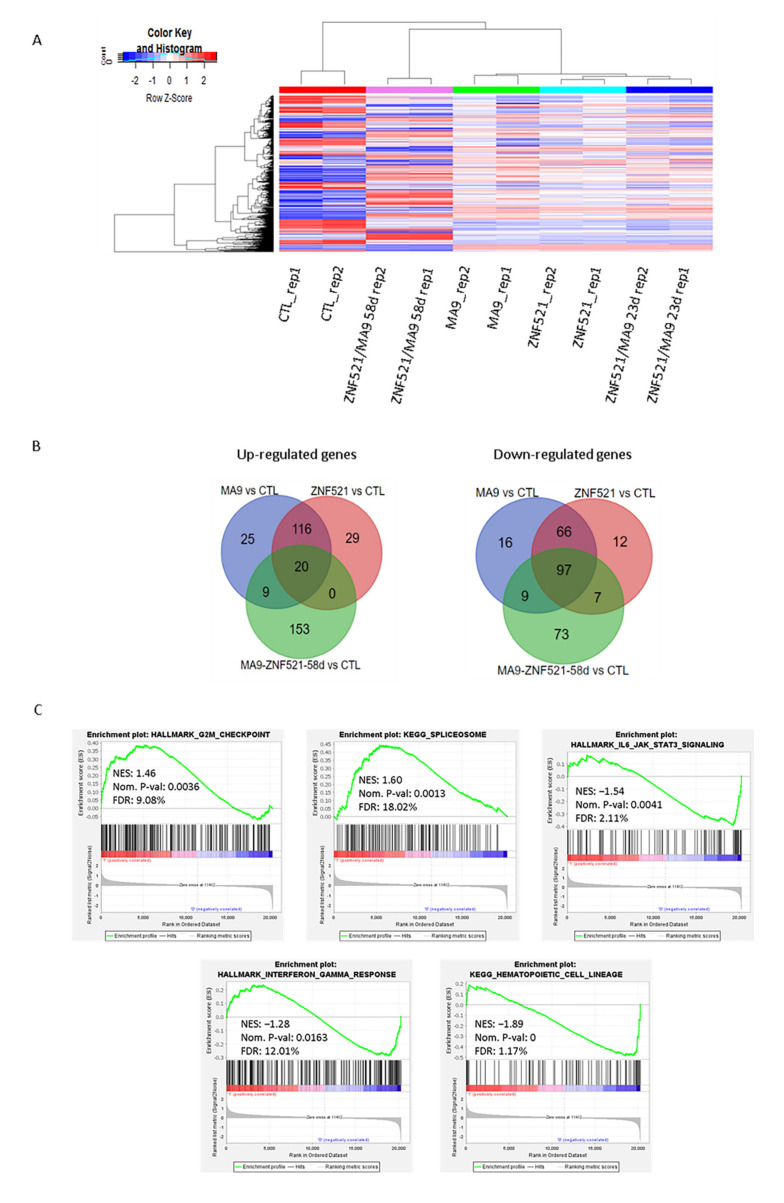
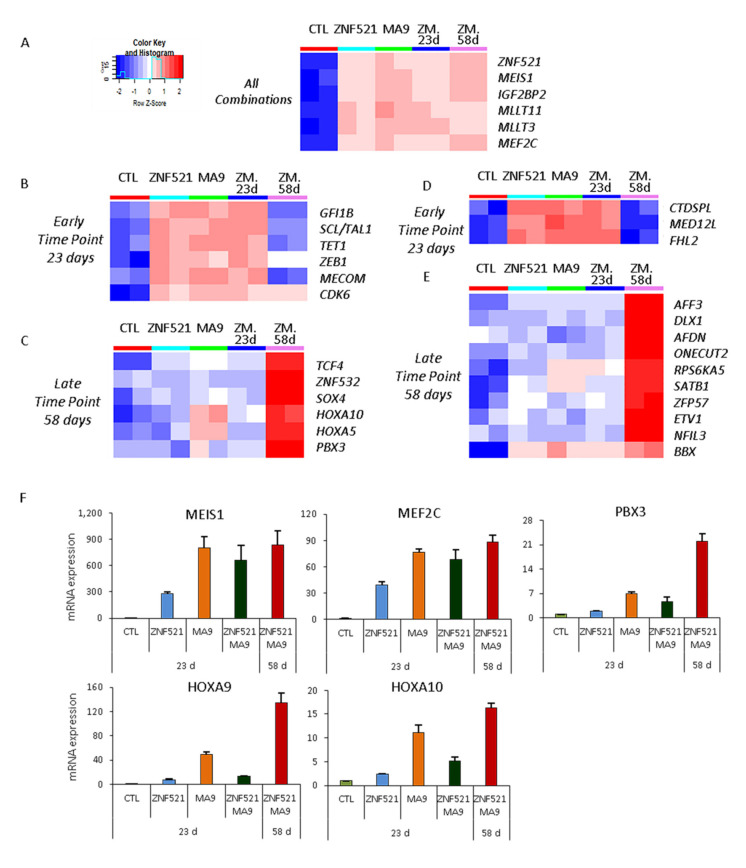
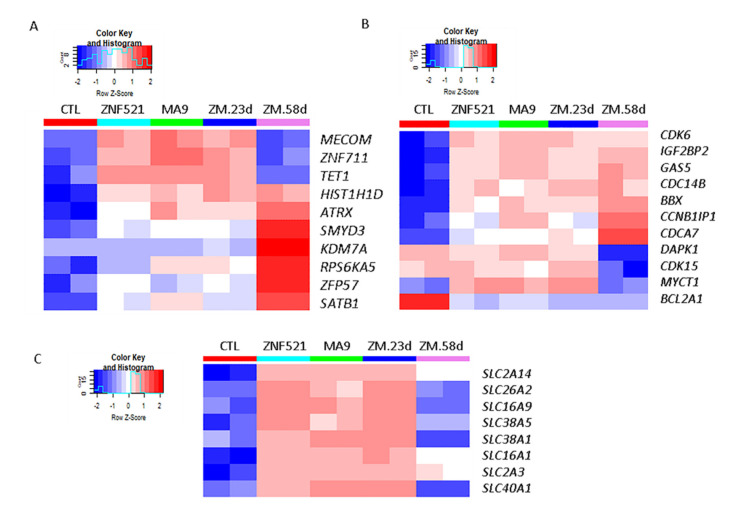
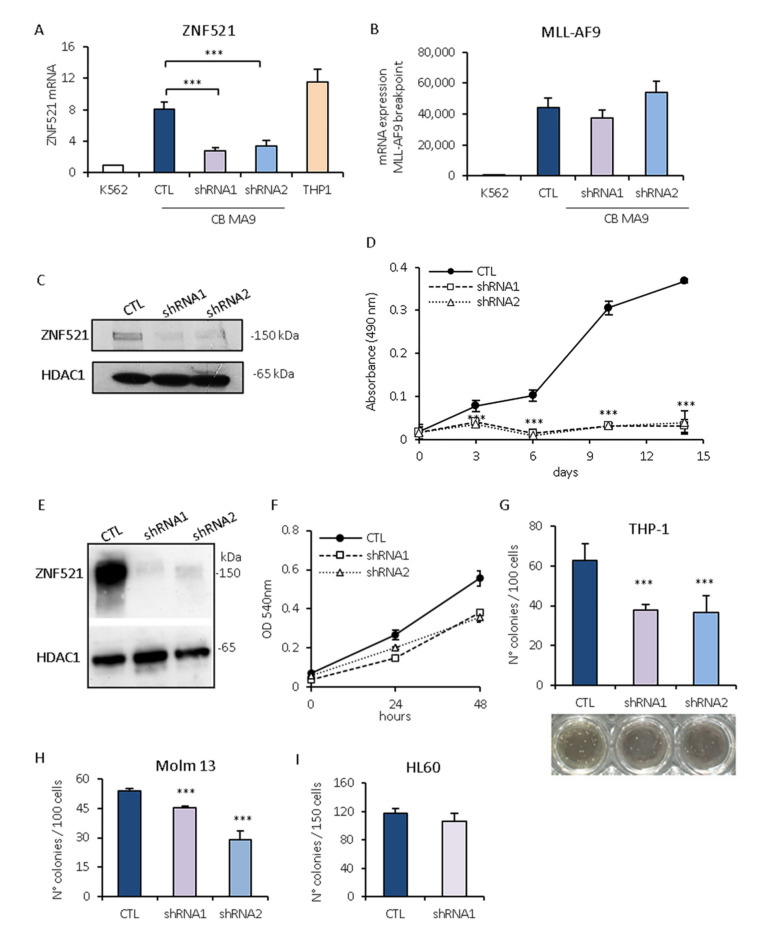
Leukemias derived from the MLL-AF9 rearrangement rely on dysfunctional transcriptional networks. ZNF521, a transcription co-factor implicated in the control of hematopoiesis, has been proposed to sustain leukemic transformation in collaboration with other oncogenes. Here, we demonstrate that ZNF521 mRNA levels correlate with specific genetic aberrations: in particular, the highest expression is observed in AMLs bearing MLL rearrangements, while the lowest is detected in AMLs with FLT3-ITD, NPM1, or CEBPα double mutations. In cord blood-derived CD34+ cells, enforced expression of ZNF521 provides a significant proliferative advantage and enhances MLL-AF9 effects on the induction of proliferation and the expansion of leukemic progenitor cells. Transcriptome analysis of primary CD34+ cultures displayed subsets of genes up-regulated by MLL-AF9 or ZNF521 single transgene overexpression as well as in MLL-AF9/ZNF521 combinations, at either the early or late time points of an in vitro leukemogenesis model. The silencing of ZNF521 in the MLL-AF9 + THP-1 cell line coherently results in an impairment of growth and clonogenicity, recapitulating the effects observed in primary cells. Taken together, these results underscore a role for ZNF521 in sustaining the self-renewal of the immature AML compartment, most likely through the perturbation of the gene expression landscape, which ultimately favors the expansion of MLL-AF9-transformed leukemic clones.
Keywords: acute myeloid leukemia (AML); chromosomal translocations; cord blood-derived hematopoietic stem cells (CB-CD34+); fusion gene MLL-AF9; gene expression; human zinc finger protein 521 (hZNF521); mixed lineage leukemia gene (MLL) AF9 (MLLT3 or LTG9).
Conflict of interest statement
The authors declare no conflict of interest.
Figures
Similar articles
-
Exploring the contribution of Zfp521/ZNF521 on primary hematopoietic stem/progenitor cells and leukemia progression.Cell Tissue Res. 2024 Dec;398(3):161-173. doi: 10.1007/s00441-024-03926-2. Epub 2024 Oct 22. Cell Tissue Res. 2024. PMID: 39436449 Free PMC article. Review.
-
ZNF521 sustains the differentiation block in MLL-rearranged acute myeloid leukemia.Oncotarget. 2017 Apr 18;8(16):26129-26141. doi: 10.18632/oncotarget.15387. Oncotarget. 2017. PMID: 28412727 Free PMC article.
-
ZFP521 regulates murine hematopoietic stem cell function and facilitates MLL-AF9 leukemogenesis in mouse and human cells.Blood. 2017 Aug 3;130(5):619-624. doi: 10.1182/blood-2016-09-738591. Epub 2017 Jun 14. Blood. 2017. PMID: 28615219 Free PMC article.
-
MLL-AF9 and FLT3 cooperation in acute myelogenous leukemia: development of a model for rapid therapeutic assessment.Leukemia. 2008 Jan;22(1):66-77. doi: 10.1038/sj.leu.2404951. Epub 2007 Sep 13. Leukemia. 2008. PMID: 17851551 Free PMC article.
-
Learning from mouse models of MLL fusion gene-driven acute leukemia.Biochim Biophys Acta Gene Regul Mech. 2020 Aug;1863(8):194550. doi: 10.1016/j.bbagrm.2020.194550. Epub 2020 Apr 19. Biochim Biophys Acta Gene Regul Mech. 2020. PMID: 32320749 Review.
Cited by
-
The Role of Epithelial-to-Mesenchymal Transition Transcription Factors (EMT-TFs) in Acute Myeloid Leukemia Progression.Biomedicines. 2024 Aug 21;12(8):1915. doi: 10.3390/biomedicines12081915. Biomedicines. 2024. PMID: 39200378 Free PMC article. Review.
-
Enhanced ZNF521 expression induces an aggressive phenotype in human ovarian carcinoma cell lines.PLoS One. 2022 Oct 3;17(10):e0274785. doi: 10.1371/journal.pone.0274785. eCollection 2022. PLoS One. 2022. PMID: 36191006 Free PMC article.
-
Editorial to the Special Issue "Recent Advances in Biochemical Mechanisms of Acute Myeloid Leukemia".Biomedicines. 2023 May 2;11(5):1339. doi: 10.3390/biomedicines11051339. Biomedicines. 2023. PMID: 37239010 Free PMC article.
-
Role of solute carrier transporters in ovarian cancer (Review).Int J Mol Med. 2025 Feb;55(2):24. doi: 10.3892/ijmm.2024.5465. Epub 2024 Nov 29. Int J Mol Med. 2025. PMID: 39611477 Free PMC article. Review.
-
Cellular and Biochemical Characterization of Mesenchymal Stem Cells from Killian Nasal Polyp.Int J Mol Sci. 2022 Oct 30;23(21):13214. doi: 10.3390/ijms232113214. Int J Mol Sci. 2022. PMID: 36362001 Free PMC article.
References
-
- Corral J., Lavenir I., Impey H., Warren A.J., Forster A., Larson T.A., Bell S., McKenzie A.N., King G., Rabbitts T.H. An MLL-AF9 fusion gene made by homologous recombination causes acute leukemia in chimeric mice: A method to create fusion oncogenes. Cell. 1996;85:853–861. doi: 10.1016/S0092-8674(00)81269-6. - DOI - PubMed
-
- Smith L.L., Yeung J., Zeisig B.B., Popov N., Huijbers I., Barnes J., Wilson A.J., Taskesen E., Delwel R., Gil J., et al. Functional crosstalk between Bmi1 and MLL/Hoxa9 axis in establishment of normal hematopoietic and leukemic stem cells. Cell Stem. Cell. 2011;8:649–662. doi: 10.1016/j.stem.2011.05.004. - DOI - PubMed
MeSH terms
Substances
LinkOut - more resources
Full Text Sources
Medical
Molecular Biology Databases
Miscellaneous
