. 2021 Oct 7;22(19):10850.
doi: 10.3390/ijms221910850.

Saussurea involucrata (Snow Lotus) ICE1 and ICE2 Orthologues Involved in Regulating Cold Stress Tolerance in Transgenic Arabidopsis

Affiliations

Saussurea involucrata (Snow Lotus) ICE1 and ICE2 Orthologues Involved in Regulating Cold Stress Tolerance in Transgenic Arabidopsis

Chia-Ling Wu et al. Int J Mol Sci. .

Abstract

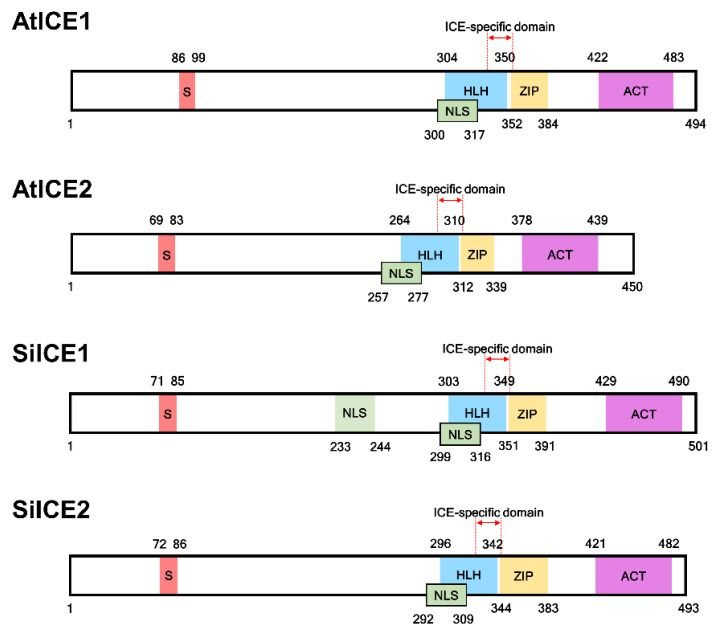
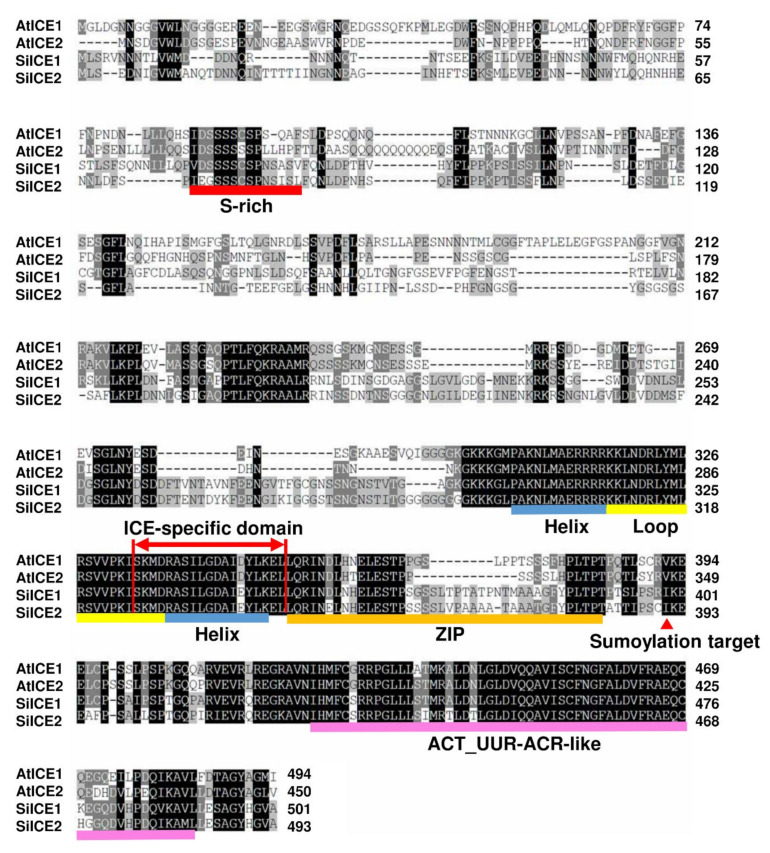
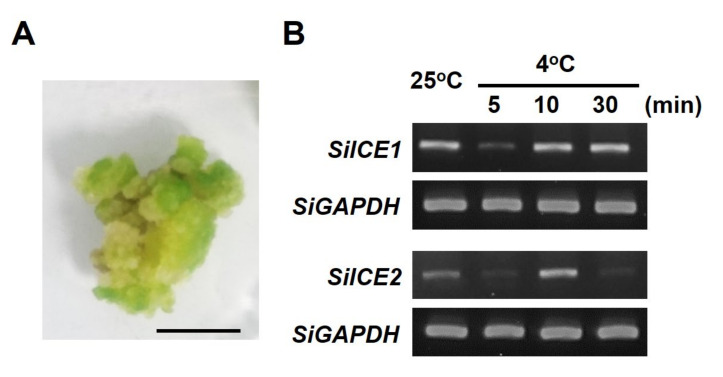
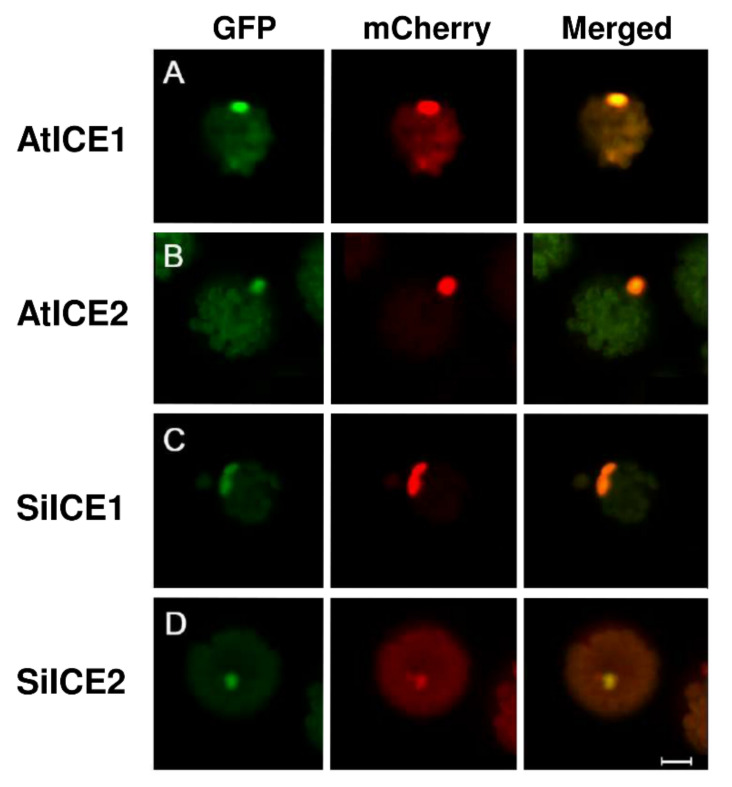
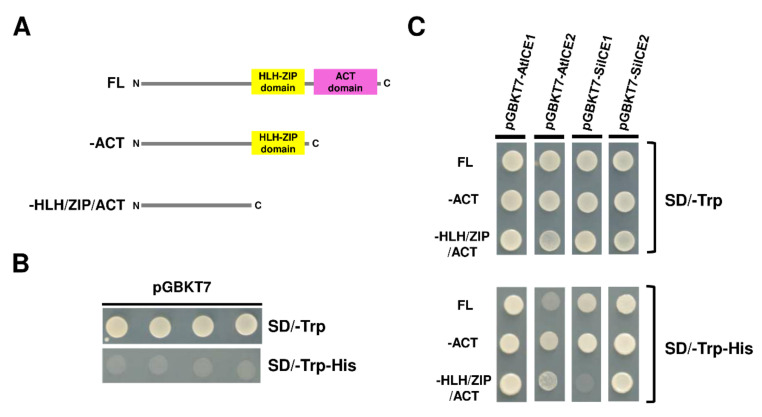
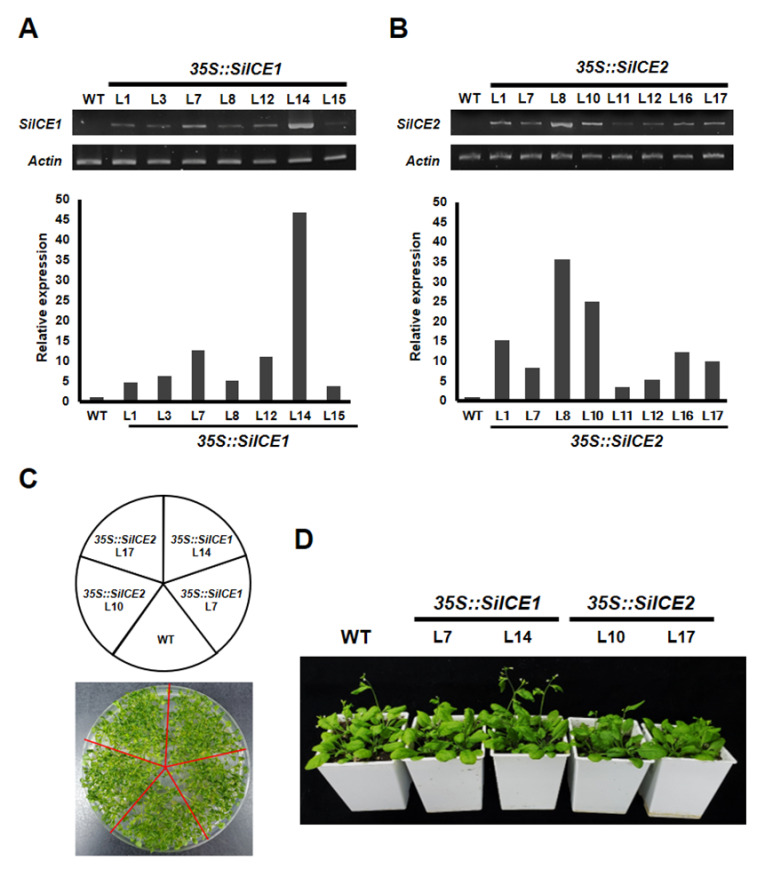
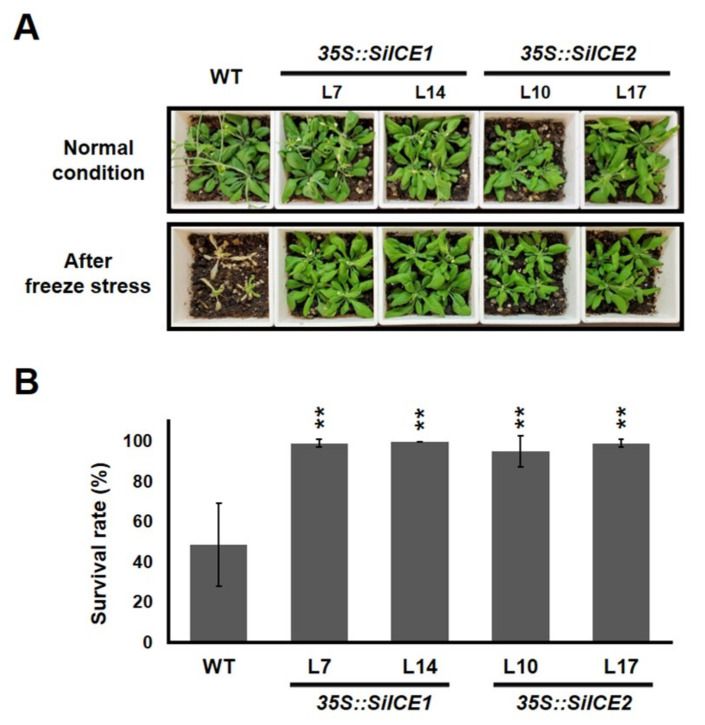
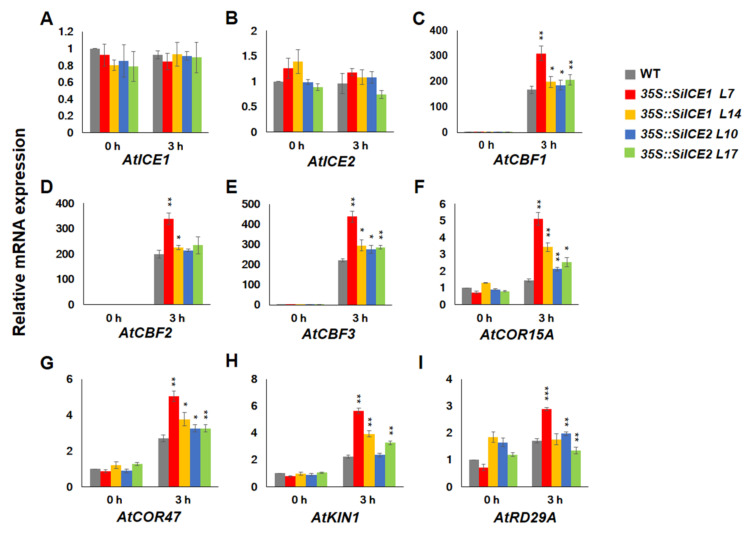
As with other environmental stresses, cold stress limits plant growth, geographical distribution, and agricultural productivity. CBF/DREB (CRT-binding factors/DRE-binding proteins) regulate tolerance to cold/freezing stress across plant species. ICE (inducer of CBF expression) is regarded as the upstream inducer of CBF expression and plays a crucial role as a main regulator of cold acclimation. Snow lotus (Saussurea involucrata) is a well-known traditional Chinese herb. This herb is known to have greater tolerance to cold/freezing stress compared to other plants. According to transcriptome datasets, two putative ICE homologous genes, SiICE1 and SiICE2, were identified in snow lotus. The predicted SiICE1 cDNA contains an ORF of 1506 bp, encoding a protein of 501 amino acids, whereas SiICE2 cDNA has an ORF of 1482 bp, coding for a protein of 493 amino acids. Sequence alignment and structure analysis show SiICE1 and SiICE2 possess a S-rich motif at the N-terminal region, while the conserved ZIP-bHLH domain and ACT domain are at the C-terminus. Both SiICE1 and SiICE2 transcripts were cold-inducible. Subcellular localization and yeast one-hybrid assays revealed that SiICE1 and SiICE2 are transcriptional regulators. Overexpression of SiICE1 (35S::SiICE1) and SiICE2 (35S::SiICE2) in transgenic Arabidopsis increased the cold tolerance. In addition, the expression patterns of downstream stress-related genes, CBF1, CBF2, CBF3, COR15A, COR47, and KIN1, were up-regulated when compared to the wild type. These results thus provide evidence that SiICE1 and SiICE2 function in cold acclimation and this cold/freezing tolerance may be regulated through a CBF-controlling pathway.

Keywords: CBF expression; ICE orthologues; cold stress tolerance; snow lotus.


Conflict of interest statement

The authors declare no conflict of interest.

Figures

Figure 1
Figure 1
Structural comparison among SiICE1, SiICE2, AtCE1, and AtICE2 in snow lotus and Arabidopsis, respectively. Red region indicates serine (S)-rich area. Blue area is helix–loop–helix (HLH). Yellow box represents zipper region (ZIP). Purple shows the ACT_UUR_ACR-like (ACT) region. Numbers located on the top/bottom of the boxes with different colors are the numbers of amino acids within each ICE protein. NLS: nuclear localization signal.
Figure 2
Figure 2
Amino acid sequence alignment and analysis of SiICE1, SiICE2, AtICE1, and AtICE2 by employing ClustalW2 program. Black area indicates regions with amino acid identity among these ICE proteins. Gray box exhibits where physically and chemically similar amino acids are replaced within different ICE proteins. Different colors are used to underline the distinct predicted structures. Red line shows serine-rich (S-rich) region; blue–yellow–blue line indicates helix–loop–helix (HLH) domain; orange is zipper region (ZIP domain); and light-purple represents ACT_UUR_ACR-like (ACT) structure. ICE-specific domain is shown as double red arrows. Red arrowhead symbolizes the target site (lysine) for sumoylation.
Figure 3
Figure 3
Identity comparison of amino acid sequences of different ICE proteins, including AtICE1, AtICE2, SiICE1, and SiICE2. (A) Comparison of full-length (FL) amino acid sequences of four different ICE proteins. (B) Comparison of the bHLH-ZIP domain. (C) Comparison of the ICE-specific domain. (D) Comparison of the ACT_UUT-ACR (ACT) domain.
Figure 4
Figure 4
Simulated three-dimensional structure of a bHLH-ZIP dimer located within AtICE1, AtICE2, SiICE1, and SiICE2 proteins, respectively, obtained by using the VMD program. Red/yellow/green and green/blue indicate a helix structure, respectively.
Figure 5
Figure 5
Phylogenetic analysis of SiICE1 and SiICE2 with orthologous ICE proteins from other plant species, including dicots and monocots. The full-length amino acid sequence alignment of SiICE1, SiICE2, and other ICE proteins was analyzed by using the ClustalW2 program, followed by MEGA X counted 1000 times using the neighbor-joining method [50,51,52]. A phylogenetic tree was then constructed. Except for SiICE1 and SiICE2 of Saussurea involucrata, others include AtICE1 (NP_189309) and AtICE2 (NP_172746) of Arabidopsis thaliana, BnICE1 (AEL33687) of Brassica napus, BrICE1 (ACB70963) of Brassica rapa, CbICE1 (AAS79350) of Capsella bursa-pastoris, CsICE (ACT90640) of Camellia sinensis, EcICE1 (ADY68776) of Eucalyptus camaldulensis, EgICE1 (AEF33833) of Eucalyptus globulus, EsICE (ACT68317) of Eutrema salsugineum, GmICE1 (ACJ39211) of Glycine max, HvICE2 (ABA25896) of Hordeum vulgare, LsICE1 (ADX86750.1) of Lactuca sativa, MdbHLH1 (ABS50251) of Malus domestica, OsICE1(Os11g0523700) and OsICE2 (Os01g0928000) of Oryza sativa, PsICE1 (ABF48720) of Populus suaveolens, PtrICE1 (ABN58427) of Populus trichocarpa, RsICE1 (ADY68771) of Raphanus sativus, TaICE41 (ACB69501) and TaICE87 (ACB69502) of Triticum aestivum, VaICE1 (AGP04217), VaICE2 (AGP04218), and VaICE14 (ADY17816) of Vitis amurensis, VvICE1 (AFI49627), VvICE1a (AGQ03810), and VvICE1b (AGQ03811) of Vitis vinifera, VrICE1 (AGG34704), VrICE2 (AIA58705), VrICE3 (AIA58706), and VrICE4 (AIA58707) of Vitis riparia, and ZmICE2 (ACG46593) of Zea mays.
Figure 6
Figure 6
SiICE1 and SiICE2 differential gene expression in response to cold stress in the callus of snow lotus. Snow lotus callus cultivated for 2 weeks under long-day/light conditions, then dark treatment for 1 week, was divided into two groups. The control group was untreated and cultured at 25 °C, whereas the experimental group was low-temperature treated for 5, 10, or 30 min at 4 °C, respectively. Thereafter, mRNA expression of SiICE1 and SiICE2 was examined, respectively. (A) Phenotype of a snow lotus callus. Scale bar = 1 cm. (B) Semi-qPCR analysis of SiICE1 and SiICE2 gene expression. SiGAPDH represents the reference control of gene expression.
Figure 7
Figure 7
Nuclear localization of GFP-SiICE1 and GFP-SiICE2. A green fluorescent protein (GFP) gene was used as a reporter gene which is transiently expressed in the protoplast of Arabidopsis. The localization of GFP-SiICE1and GFP-SiICE2 fusion proteins is then shown under the confocal microscope by the presence of green fluorescence. Left panel: green fluorescence represents the location site of (A) AtICE1, (B) AtICE2, (C) SiICE1, and (D) SiICE2, respectively. Middle panel: mCherry with red fluorescence indicates the location of AtCO-mCherry, which is used as a positive control for the nuclear localization assay. Right panel: merged image indicates the superimposition of GFP and mCherry. The white proportional scale symbolizes 10 μm.
Figure 8
Figure 8
Yeast one-hybrid analysis of SiICE1, SiICE2, AtICE1, and AtICE2 with full-length (FL), –ACT, or –HLH-ZIP domain. (A) Orthologous ICE genes, including SiICE1, SiICE2, AtICE1, or AtICE2, were constructed in the pGBKT7 vector. Thus, different ICE genes carrying full-length (FL), lacking ACT (–ACT), or missing both ACT and HLH-ZIP (–HLH/ZIP/ACT) domains were inserted into the pGBKT7 vector, respectively. (B) Only the plasmid pGBKT7 vector was transformed into yeast strain AH109. Four different clones were selected and cultured in media SD/-Trp or SD/-Trp-His and used as a negative control. (C) SiICE1, SiICE2, AtICE1, or AtICE2 genes carrying full-length (FL), –ACT, or –HLH/ZIP/ACT domains in pGBKT7 vector were transformed into AH109 yeast cells, respectively. Colony formation was then examined in the selection media SD/-Trp and SD/-Trp-His.
Figure 9
Figure 9
Semi-qRT-PCR of SiICE1 and SiICE2 expression in transgenic Arabidopsis. (A) Seven 35S::SiICE1 transgenic plants, L1, L3, L7, L8, L12, L14, and L15, were randomly selected and semi-qRT-PCR reactions were performed. Wild type (WT) was used as a control group, while Actin2 was employed as a reference control for gene expression at the transcriptional level. (B) Similarly, a semi-qRT-PCR assay was conducted for SiICE2 expression, including L1, L7, L8, L10, L11, L12, L16, and L17 35S::SiICE2 transgenic plants. The lower panel shows the quantitative results of 9A and 9B, respectively. (C,D) Phenotypes of the WT, 35S::SiICE1 (L7, L14), and 35S::SiICE2 (L10, L17) transgenic plants. Seeds for different transgenic Arabidopsis were planted in 1/2 MS agar plates for 2 weeks (shown in (C)). Thereafter, seedlings were cultivated in soil for 14 days, followed by phenotypic analysis and photographed, respectively, as shown in (D). L7 and L14 of 35S::SiICE1 transgenic Arabidopsis and L10 and L17 of 35S::SiICE2 transgenic plants were selected due to relatively higher SiICE1 or SiICE2 gene expression in A and B, respectively.
Figure 10
Figure 10
Transgenic Arabidopsis, 35S::SiICE1 and 35S::SiICE2, cultivated in soil and the effect of cold stress on the phenotype and survival rate are displayed. (A) Seedlings grown on the 1/2 MS media under 22 °C long-day/light conditions for 14 days were transplanted in soil for further cultivation for 7 days under long-day/light conditions. Thereafter, WT, 35S::SiICE1 (L7, L14), or 35S::SiICE2 (L10, L17) transgenic plants were moved to 0 °C for 24 h, then transferred to 22 °C long-day/light conditions for 7 days in order to recover from the cold/freezing stress. Phenotypes were examined and photographed for both the WT and every transgenic plant. (B) Survival rates of the WT, 35S::SiICE1, and 35S::SiICE2 transgenic plants were calculated after cold/freezing treatment. Six independent experiments were performed and 40 seedlings in each group were analyzed by using the Student’s t-test. Asterisks indicate the significant differences in comparison with the control at p < 0.01 (**).
Figure 11
Figure 11
qRT-PCR analysis showing relative mRNA expression of overexpressed 35S::SiICE1 and 35S::SiICE2 transgenic Arabidopsis in response to cold/freezing stress. Seedlings, cultivated under long-day/light conditions for 14 days, of WT, 35S::SiICE1 (L7, L14), or 35S::SiICE2 (L10, L17) transgenic plants were moved to −5 °C for 0 h (room temperature control) or 3 h (low-temperature experimental groups), respectively. Gene-specific primers were employed to perform qPCR reactions in order to detect target gene expression at the mRNA level. Target genes included (A) AtICE1, (B) AtICE2, (C) AtCBF1, (D) AtCBF2, (E) AtCBF3, (F) AtCOR15A, (G) AtCOR47, (H) AtKIN1, and (I) AtRD29A/COR78. Actin2 of Arabidopsis was used as a reference control. Each analyzed value is the average of three experimental replicates and the standard deviation (SD) is calculated for each group. Asterisks indicate significant differences at p < 0.05 (*), p < 0.01 (**), and p < 0.001 (***).
Figure 12
Figure 12
The hypothetical model of SiICE1 and SiICE2 involved in the ICE-CBF-COR transcriptional regulatory network in response to cold/ freezing tolerance. Solid and dotted arrows show the direct and indirect links, respectively. Elliptical objects indicate the functional proteins acting as the transcription factors that control the stress-inducible gene expression. Cis-acting elements in the promoter region that are involved in the stress-responsive transcription are shown in gray boxes. The right panel represents the ICE-CBF-COR controlling pathway in response to cold stress.

References

    1. Went F.W. The effect of temperature on plant growth. Annu. Rev. Plant Physiol. 1953;4:347–362. doi: 10.1146/annurev.pp.04.060153.002023. - DOI
    1. Saijo Y., Loo E.P. Plant immunity in signal integration between biotic and abiotic stress responses. New Phytol. 2020;225:87–104. doi: 10.1111/nph.15989. - DOI - PubMed
    1. Hatfield J.L., Boote K.J., Kimball B.A., Ziska L.H., Izaurralde R.C., Ort D., Thomson A.M., Wolfe D.W. Climate impacts on agriculture: Implications for crop production. Agron. J. 2011;103:351–370. doi: 10.2134/agronj2010.0303. - DOI
    1. Barlow K.M., Christy B.P., O’Leary G.J., Riffkin P.A., Nuttall J.G. Simulating the impact of extreme heat and frost events on wheat crop production: A review. Field Crops Res. 2015;171:109–119. doi: 10.1016/j.fcr.2014.11.010. - DOI
    1. Hatfield J.L., Prueger J.H. Temperature extremes: Effect on plant growth and development. Weather Clim. Extrem. 2015;10:4–10. doi: 10.1016/j.wace.2015.08.001. - DOI

MeSH terms

Substances