

Exploration of the Cs Trapping Phenomenon by Combining Graphene Oxide with α-K6P2W18O62 as Nanocomposite
- PMID: 34639973
- PMCID: PMC8509777
- DOI: 10.3390/ma14195577
Exploration of the Cs Trapping Phenomenon by Combining Graphene Oxide with α-K6P2W18O62 as Nanocomposite
Abstract
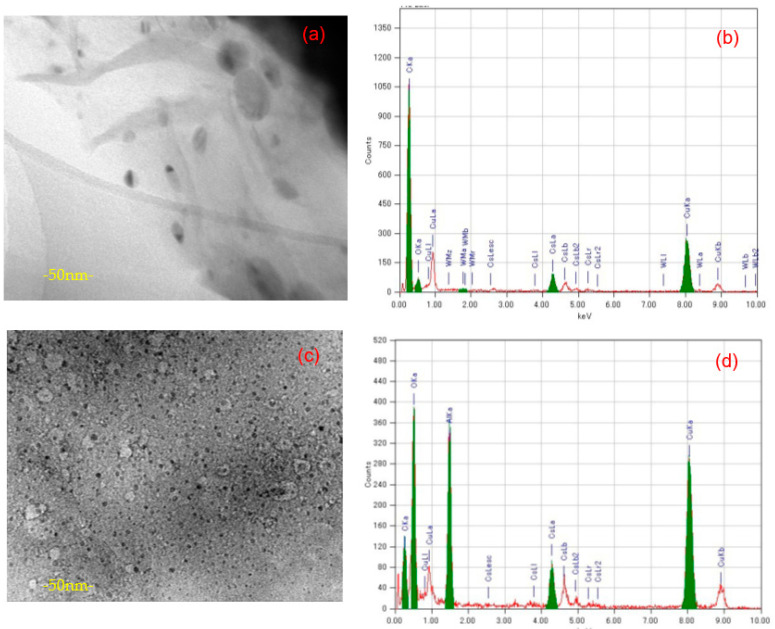
A graphene oxide-based α-K6P2W18O62 (Dawson-type polyoxometalate) nanocomposite was formed by using two types of graphene oxide (GO) samples with different C/O compositions. Herein, based on the interaction of GO, polyoxometalates (POMs), and their nanocomposites with the Cs cation, quantitative data have been provided to explicate the morphology and Cs adsorption character. The morphology of the GO-POM nanocomposites was characterized by using TEM and SEM imaging. These results show that the POM particle successfully interacted above the surface of GO. The imaging also captured many small black spots on the surface of the nanocomposite after Cs adsorption. Furthermore, ICP-AES, the PXRD pattern, IR spectra, and Raman spectra all emphasized that the Cs adsorption occurred. The adsorption occurred by an aggregation process. Furthermore, the difference in the C/O ratio in each GO sample indicated that the ratio has significantly influenced the character of the GO-POM nanocomposite for the Cs adsorption. It was shown that the oxidized zone (sp2/sp3 hybrid carbon) of each nanocomposite sample was enlarged by forming the nanocomposite compared to the corresponding original GO sample. The Cs adsorption performance was also influenced after forming a composite. The present study also exhibited the fact that the sharp and intense diffractions in the PXRD were significantly reduced after the Cs adsorption. The result highlights that the interlayer distance was changed after Cs adsorption in all nanocomposite samples. This has a good correlation with the Raman spectra in which the second-order peaks changed after Cs adsorption.
Keywords: Dawson-type polyoxometalate; cesium; graphene oxide; nanocomposite; sp2/sp3 carbon domain.
Conflict of interest statement
There are no conflict to declare.
Figures


Similar articles
-
Ultrahigh-efficiency antibacterial and adsorption performance induced by copper-substituted polyoxomolybdate-decorated graphene oxide nanocomposites.J Colloid Interface Sci. 2022 Apr 15;612:664-678. doi: 10.1016/j.jcis.2021.12.175. Epub 2021 Dec 30. J Colloid Interface Sci. 2022. PMID: 35026570
-
Efficient removal of Chromium(VI) from aqueous solution using chitosan grafted graphene oxide (CS-GO) nanocomposite.Int J Biol Macromol. 2019 Jan;121:285-292. doi: 10.1016/j.ijbiomac.2018.09.170. Epub 2018 Sep 26. Int J Biol Macromol. 2019. PMID: 30267821
-
Dawson-Type Polyoxomolybdate Anions (P2 Mo18 O626- ) Captured by Ionic Liquid on Graphene Oxide as High-Capacity Anode Material for Lithium-Ion Batteries.Chemistry. 2017 Jun 27;23(36):8729-8735. doi: 10.1002/chem.201701121. Epub 2017 Jun 5. Chemistry. 2017. PMID: 28440567
-
A review of the applications of organo-functionalized magnetic graphene oxide nanocomposites for heavy metal adsorption.Chemosphere. 2018 Feb;193:1004-1017. doi: 10.1016/j.chemosphere.2017.11.093. Epub 2017 Nov 20. Chemosphere. 2018. PMID: 29874727 Review.
-
Magnetic Solid-Phase Extraction of Organic Compounds Based on Graphene Oxide Nanocomposites.Molecules. 2020 Mar 4;25(5):1148. doi: 10.3390/molecules25051148. Molecules. 2020. PMID: 32143401 Free PMC article. Review.
Cited by
-
Improvement of Cs detection performance and formation of CsCl and Cs nanoparticles by tuning graphene oxide quantum dot-based nanocomposite.RSC Adv. 2022 Jul 6;12(30):19667-19677. doi: 10.1039/d2ra02091b. eCollection 2022 Jun 29. RSC Adv. 2022. PMID: 35865579 Free PMC article.
References
-
- Nishihara K., Yamagishi I., Yasuda K., Ishimori K., Tanaka K., Kuno T., Inada S., Gotoh Y. Radionuclide release to stagnant water in the Fukushima-1 nuclear power plant. J. Nucl. Sci. Technol. 2014;52:301–307. doi: 10.1080/00223131.2014.946455. - DOI
-
- Uchida S., Tagami K. Soil-to-plant transfer factors of fallout 137Cs and native 133Cs in various crops collected in Japan. J. Radioanal. Nucl. Chem. 2007;273:205–210. doi: 10.1007/s10967-007-0737-5. - DOI
LinkOut - more resources
Full Text Sources
