

Estimation of the Plastic Zone in Fatigue via Micro-Indentation
- PMID: 34640281
- PMCID: PMC8510475
- DOI: 10.3390/ma14195885
Estimation of the Plastic Zone in Fatigue via Micro-Indentation
Abstract
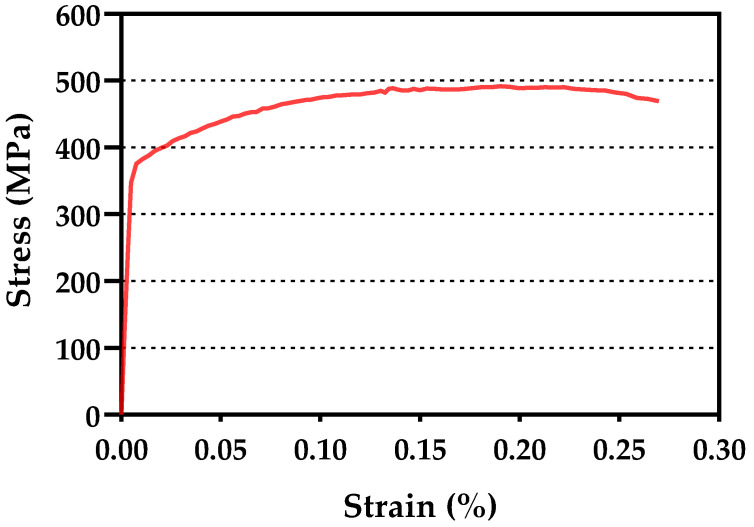
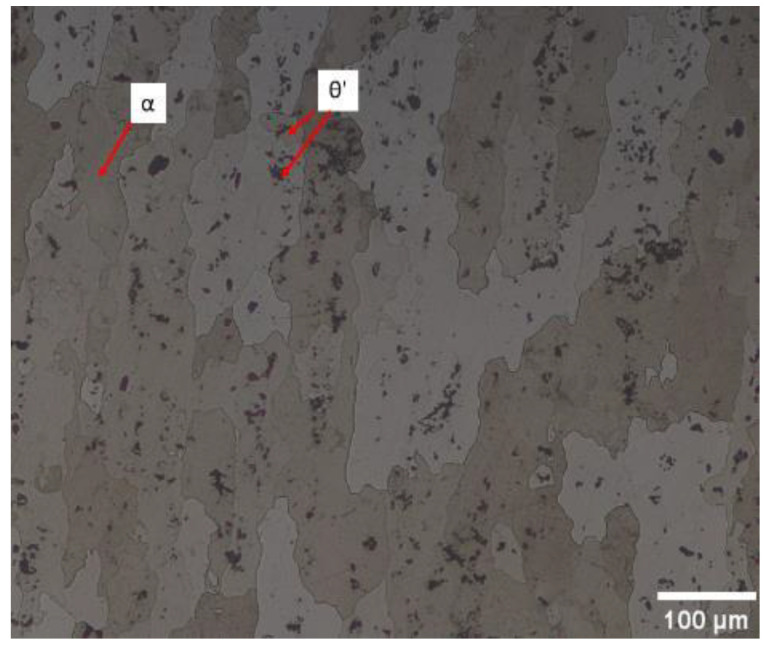
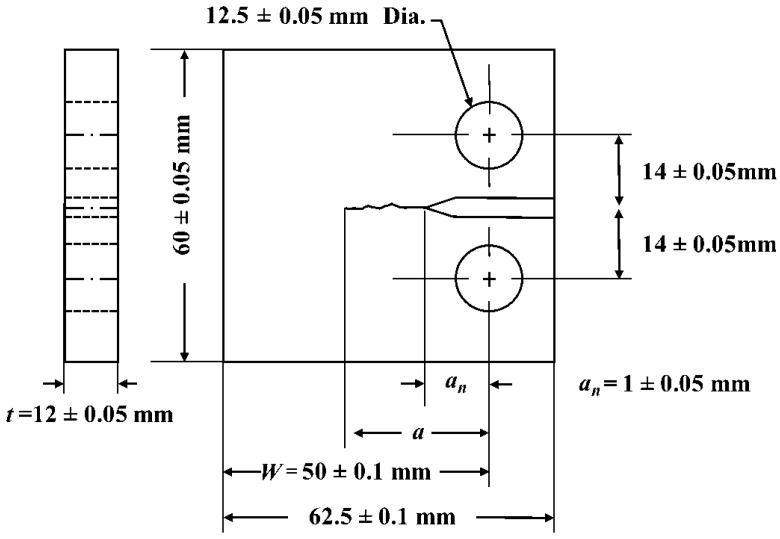
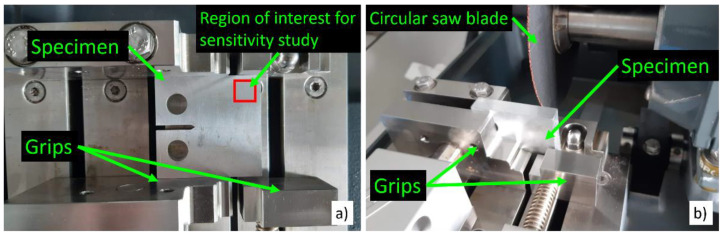
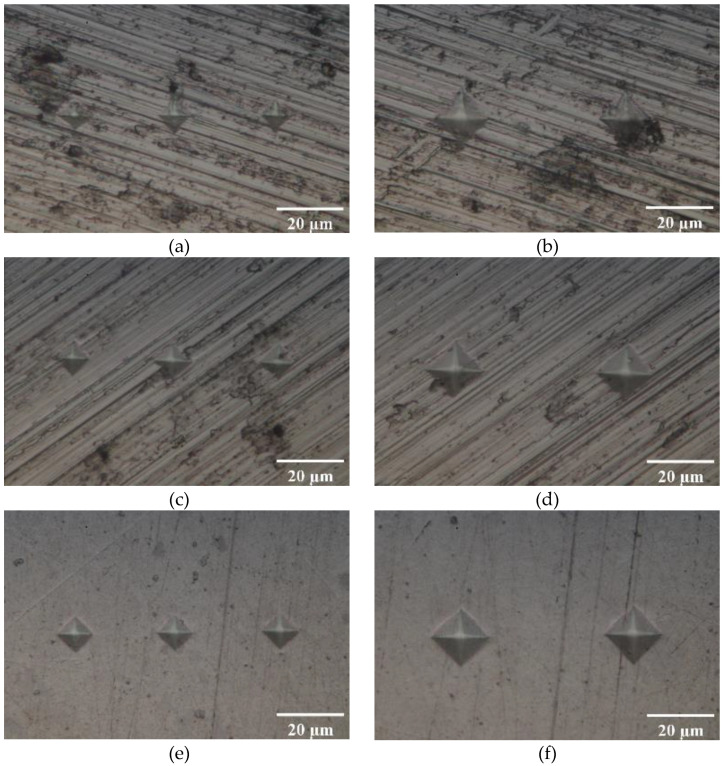
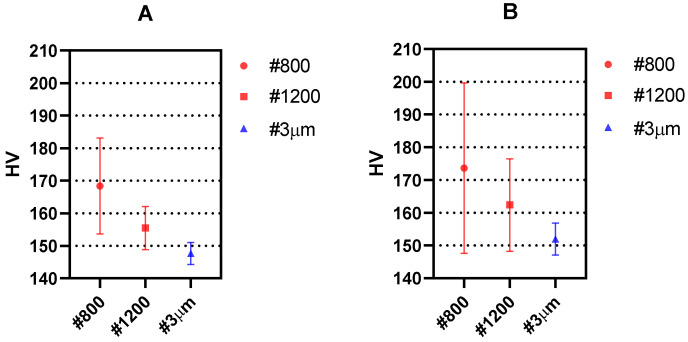
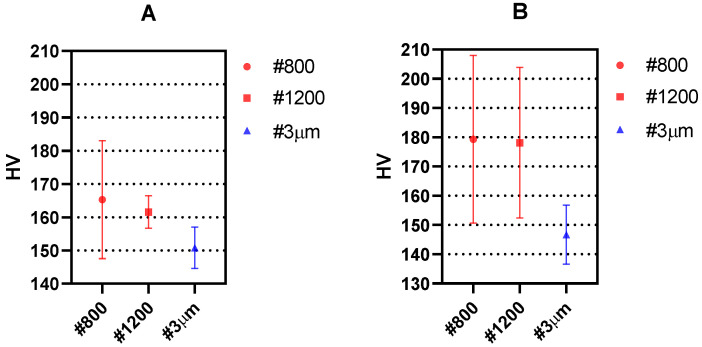
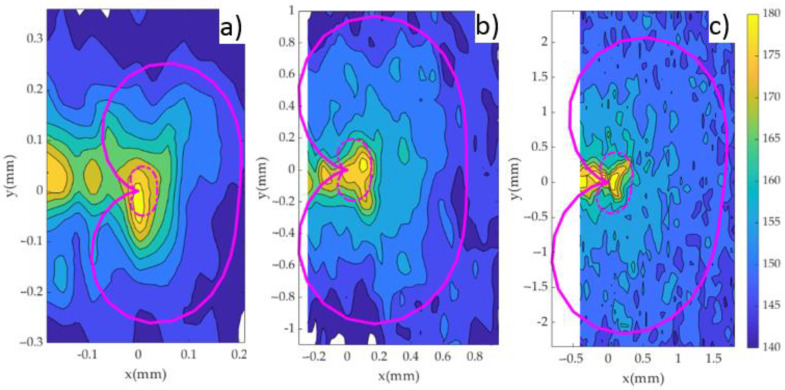
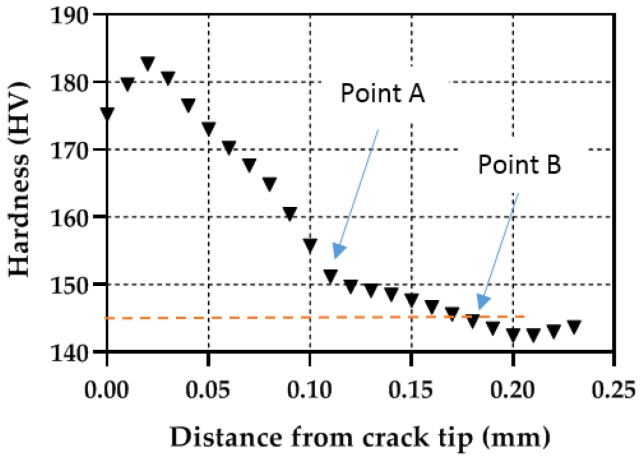
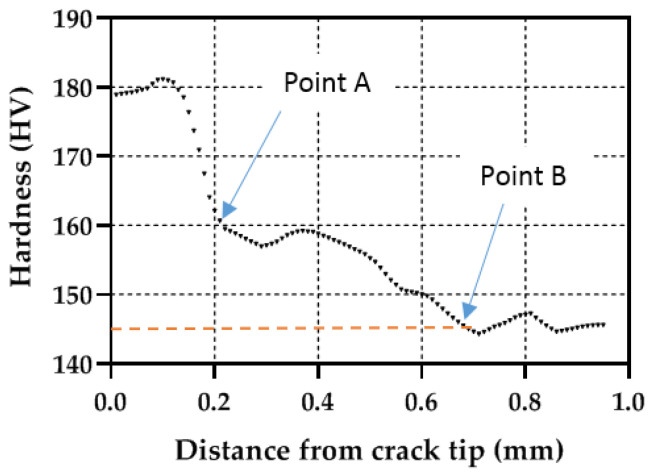
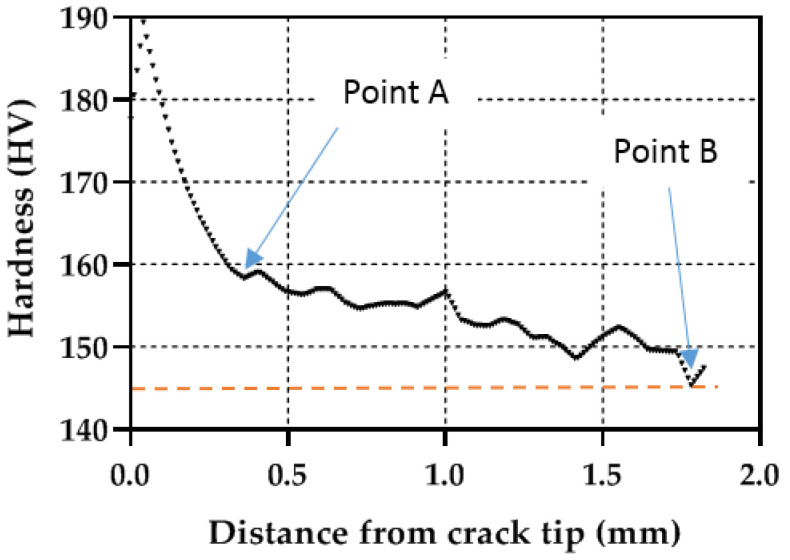
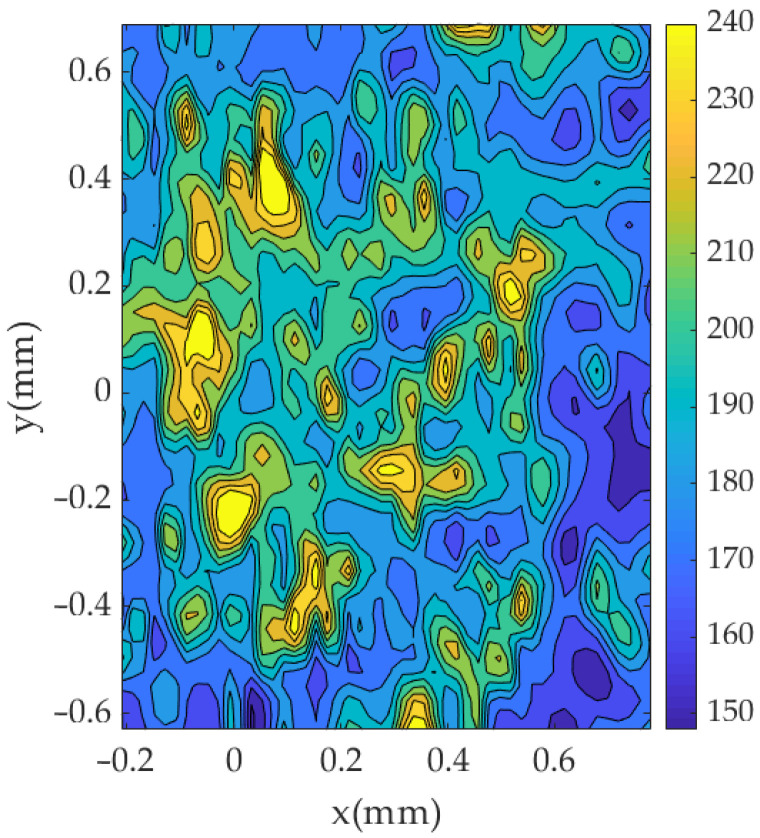
Accurate knowledge of the plastic zone of fatigue cracks is a very direct and effective way to quantify the damage of components subjected to cyclic loads. In this work, we propose an ultra-fine experimental characterisation of the plastic zone based on Vickers micro-indentations. The methodology is applied to different compact tension (CT) specimens made of aluminium alloy 2024-T351 subjected to increasing stress intensity factors. The experimental work and sensitivity analysis showed that polishing the surface to #3 μm surface finish and applying a 25 g-force load for 15 s produced the best results in terms of resolution and quality of the data. The methodology allowed the size and shape of both the cyclic and the monotonic plastic zones to be visualised through 2D contour maps. Comparison with Westergaard's analytical model indicates that the methodology, in general, overestimates the plastic zone. Comparison with S355 low carbon steel suggests that the methodology works best for alloys exhibiting a high strain hardening ratio.
Keywords: fatigue of materials; micro-indentation; plastic zone in fatigue cracks.
Conflict of interest statement
The authors declare no conflict of interest.
Figures
References
-
- Banerjee S. Influence of specimen size and configuration on the plastic zone size, toughness and crack growth. Engineering Fract. Mech. 1981;15:343–390. doi: 10.1016/0013-7944(81)90065-5. - DOI
-
- Davidson D.L., Lankford J. Fatigue crack tip plastic tip strain in high-strength aluminum alloys. Fatigue Fract. Eng. Mater. Struct. 1980;3:289–303. doi: 10.1111/j.1460-2695.1980.tb01379.x. - DOI
-
- ASTM International . Fracture Toughness Testing and its Applications. ASTM International; West Conshohocken, PA, USA: 1965.
-
- Lu L., Wang S. Relationship between crack growth resistance curves and critical CTOA. Eng. Fract. Mech. 2017;173:146–156. doi: 10.1016/j.engfracmech.2016.12.010. - DOI
-
- Dougherty J.D., Srivatsan T.S., Padovan J. Fatigue crack propagation and closure behavior of modified 1070 steel: Experimental results. Eng. Fract. Mech. 1997;56:189–212. doi: 10.1016/S0013-7944(96)00104-X. - DOI
Grants and funding
LinkOut - more resources
Full Text Sources
