Review
. 2021 Sep 30;10(19):4533.
doi: 10.3390/jcm10194533.

The Impact of COVID-19 on Kidney Transplant Recipients in Pre-Vaccination and Delta Strain Era: A Systematic Review and Meta-Analysis

Affiliations
Review

The Impact of COVID-19 on Kidney Transplant Recipients in Pre-Vaccination and Delta Strain Era: A Systematic Review and Meta-Analysis

Kumar Jayant et al. J Clin Med. .

Abstract

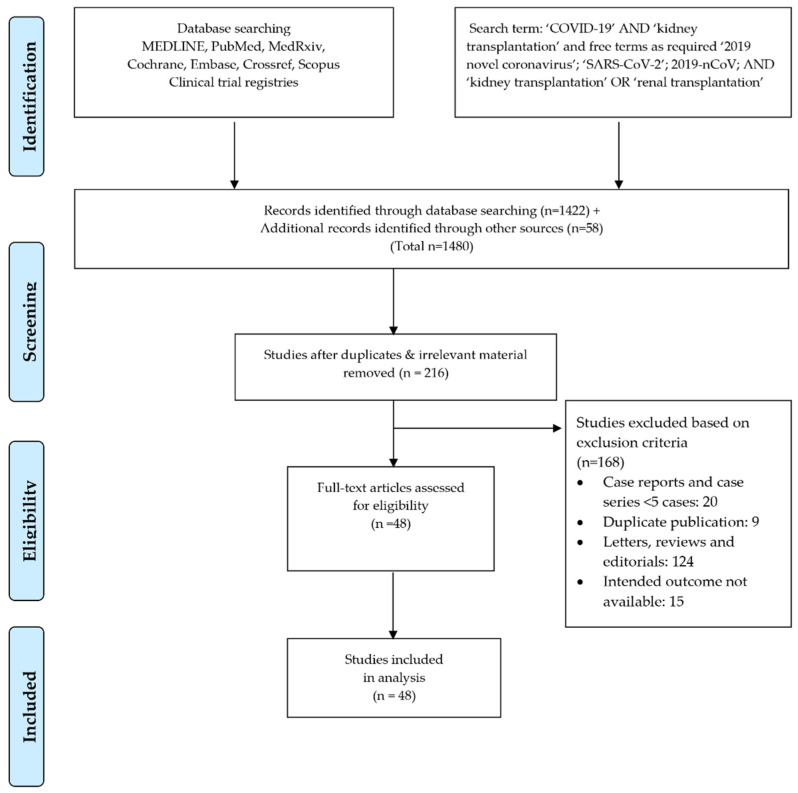
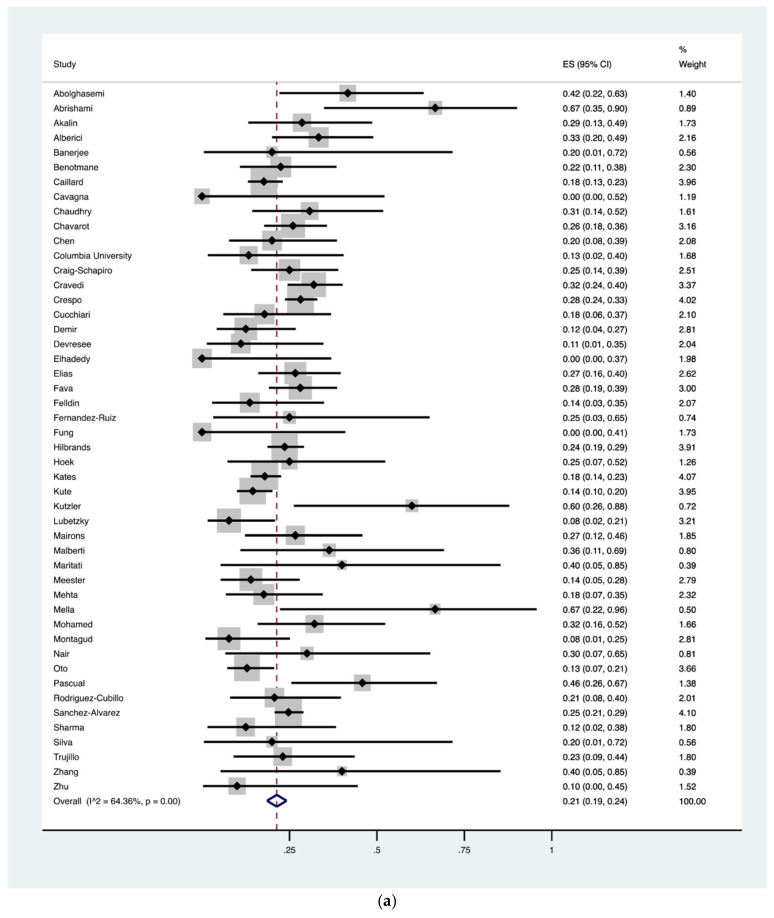
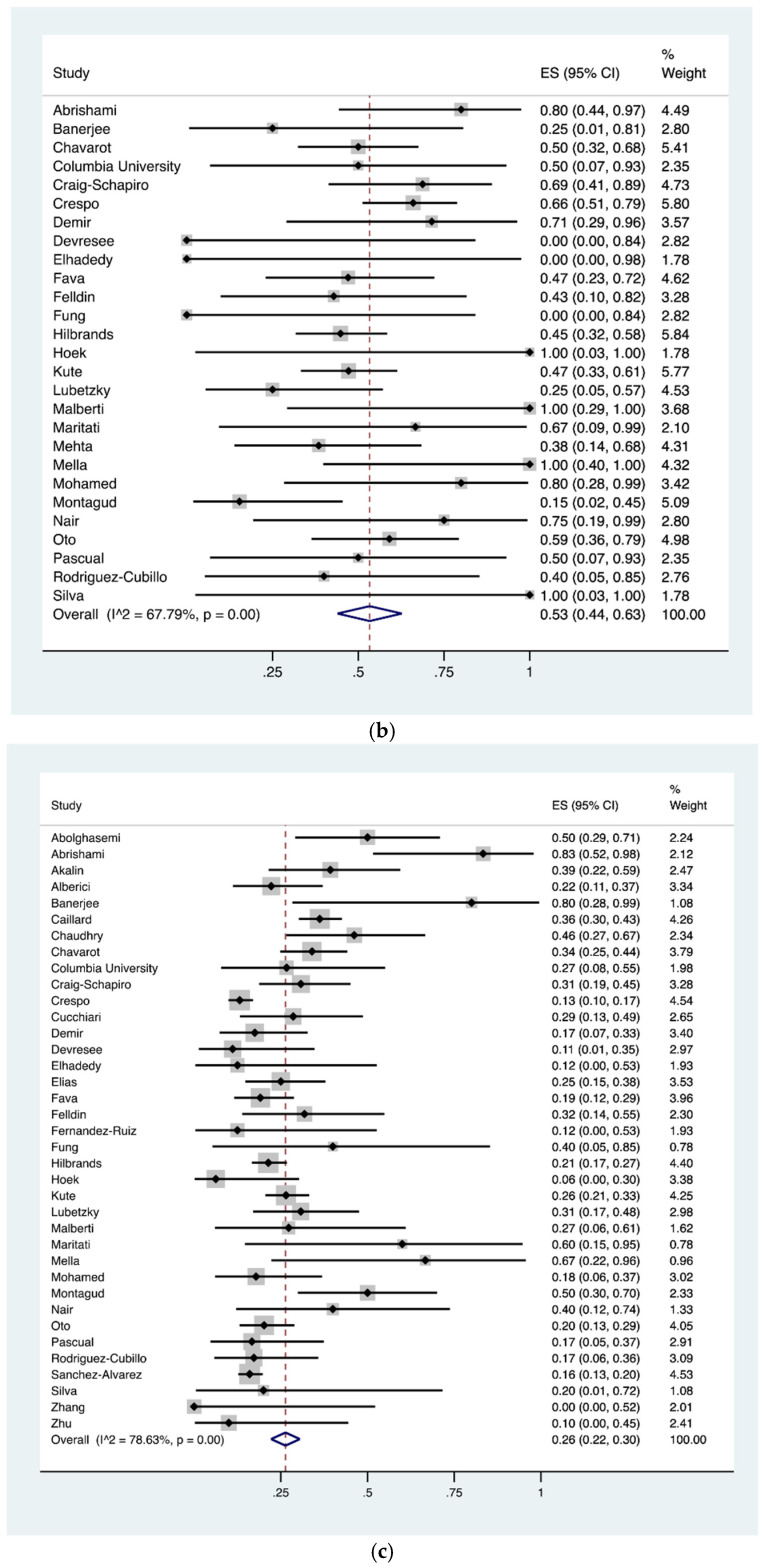
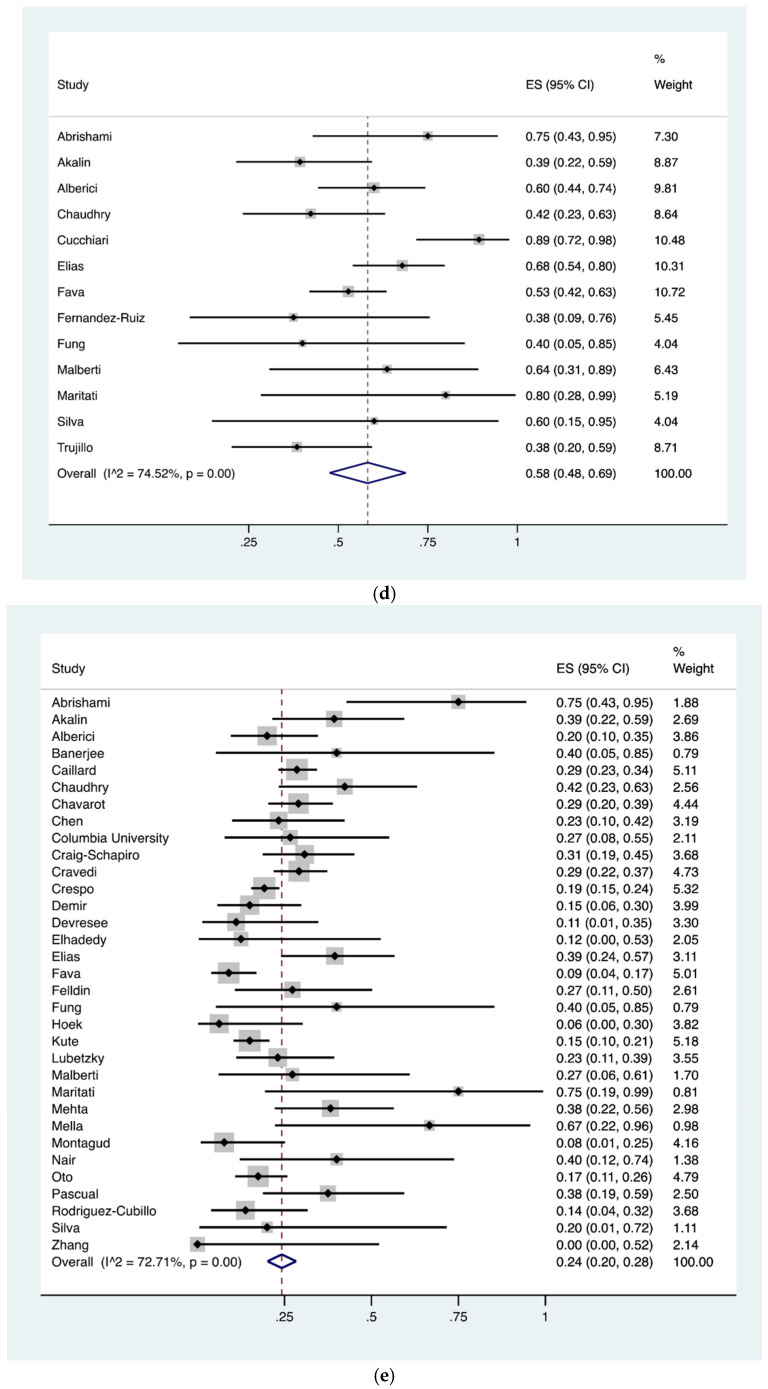
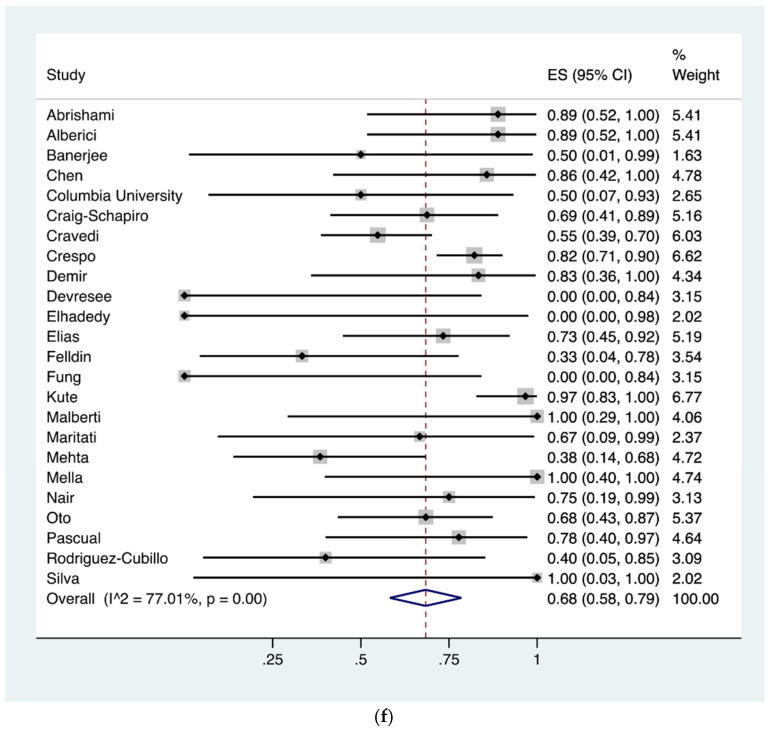
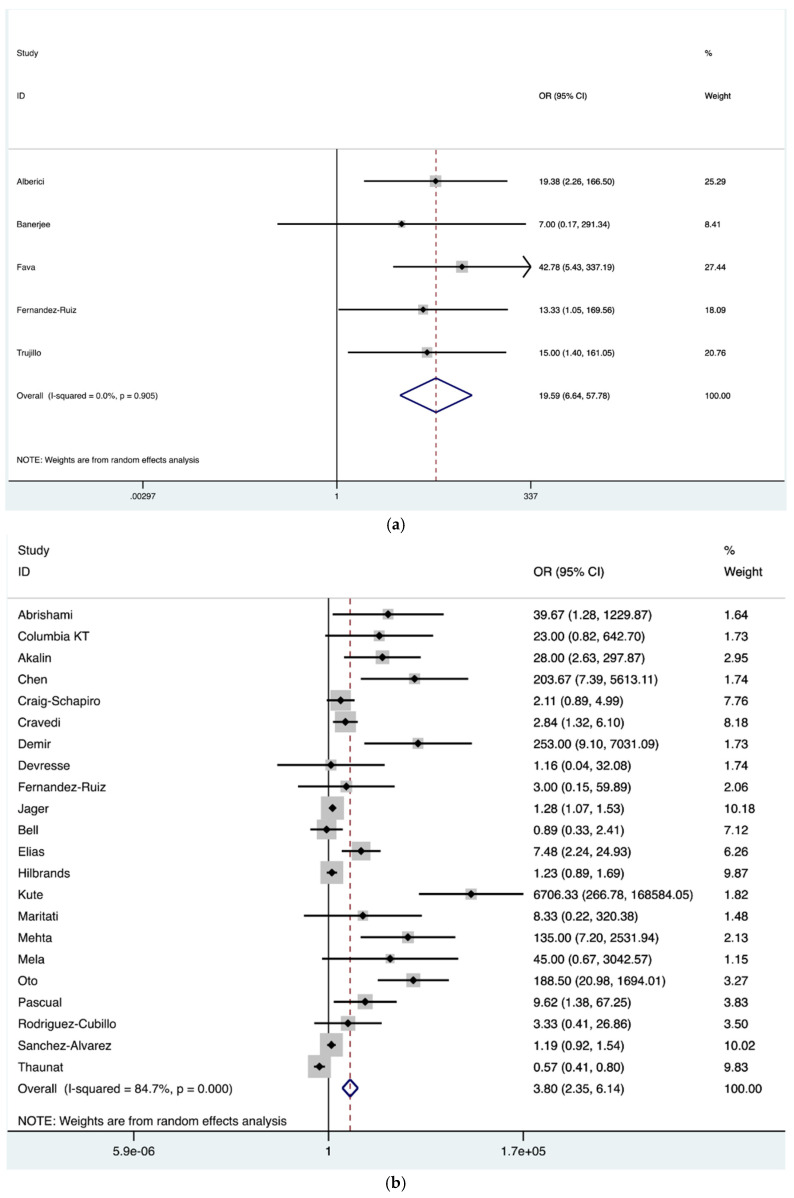
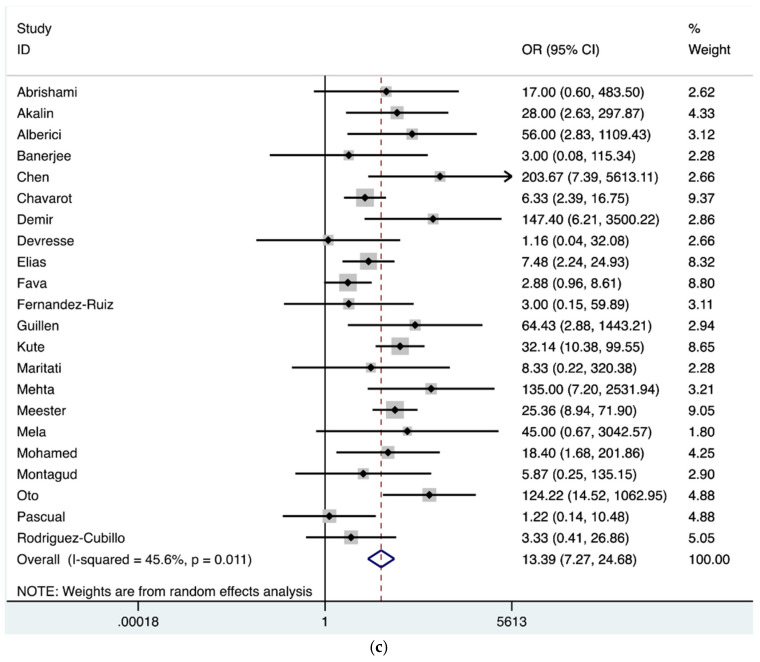
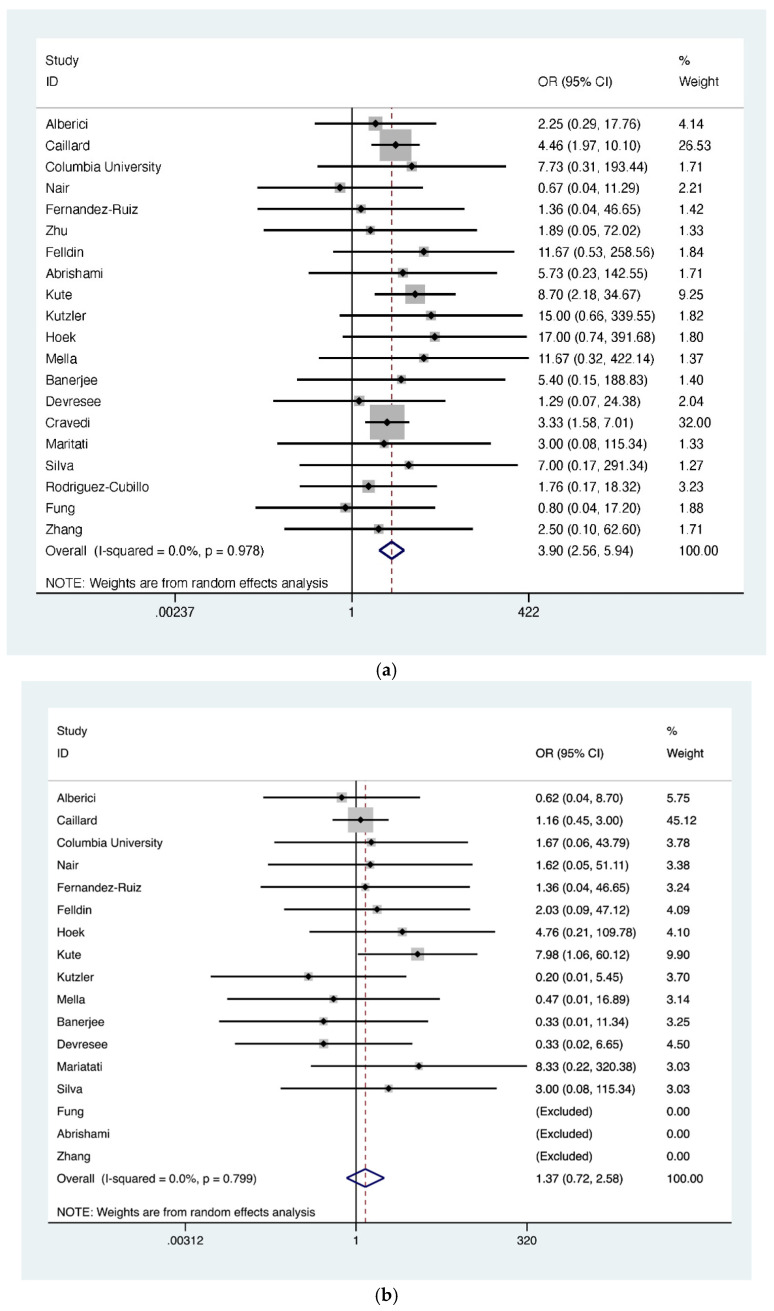
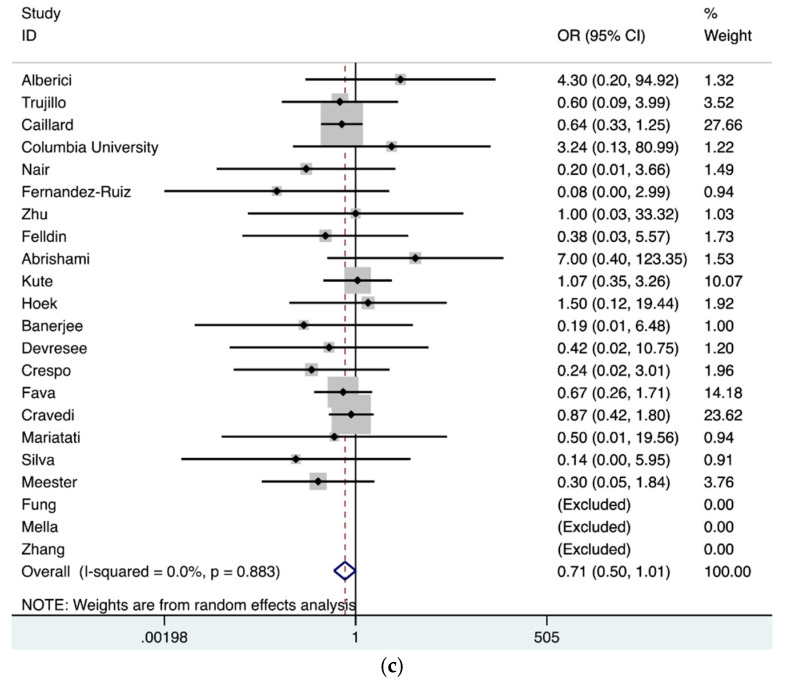
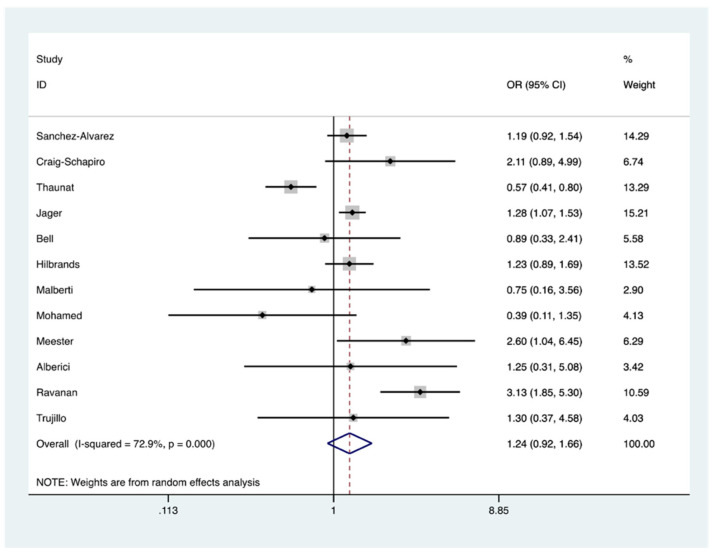
Herein, we performed a meta-analysis of published clinical outcomes of corona virus disease 2019 (COVID-19) in hospitalized kidney transplant recipients. A systematic database search was conducted between December 1, 2019 and April 20, 2020. We analyzed 48 studies comprising 3137 kidney transplant recipients with COVID-19. Fever (77%), cough (65%), dyspnea (48%), and gastrointestinal symptoms (28%) were predominant on hospital admission. The most common comorbidities were hypertension (83%), diabetes mellitus (34%), and cardiac disease (23%). The pooled prevalence of acute respiratory distress syndrome and acute kidney injury were 58% and 48%, respectively. Invasive ventilation and dialysis were required in 24% and 22% patients, respectively. In-hospital mortality rate was as high as 21%, and increased to over 50% for patients in intensive care unit (ICU) or requiring invasive ventilation. Risk of mortality in patients with acute respiratory distress syndrome (ARDS), on mechanical ventilation, and ICU admission was increased: OR = 19.59, OR = 3.80, and OR = 13.39, respectively. Mortality risk in the elderly was OR = 3.90; however, no such association was observed in terms of time since transplantation and gender. Fever, cough, dyspnea, and gastrointestinal symptoms were common on admission for COVID-19 in kidney transplant patients. Mortality was as high as 20% and increased to over 50% in patients in ICU and required invasive ventilation.

Keywords: COVID-19; SARS-CoV-2; kidney transplantation.


Conflict of interest statement

The authors declare no conflict of interest.

Figures

Figure 1
Figure 1
Search strategy and study selection used in this systematic review as per the PRISMA protocol.
Figure 2
Figure 2
Quality assessment of included studies. (green-low risk of bias; yellow-unclear risk of bias; red-high risk of bias).
Figure 3
Figure 3
(a) Pooled prevalence of in-hospital mortality in kidney transplant recipients diagnosed with corona virus disease 2019 (COVID-19). In-hospital mortality was outlined in 718/3137 patients (48 studies). The vertical red dashed line represents the overall mean effect size of the studies (0.22) and prevalence of 22%. The edges of the blue diamond represent 95% confidence intervals (0.19–0.24); (b) Pooled prevalence of intensive care unit (ICU) mortality in kidney transplant recipients diagnosed with COVID-19. ICU mortality was outlined in 184/355 patients (24 studies). The vertical red dashed line represents the overall mean effect size of the studies (0.53) and prevalence of 53%. The edges of the blue diamond represent 95% confidence intervals (0.44–0.63); (c) Pooled prevalence of intensive care unit (ICU) admission in kidney transplant recipients diagnosed with COVID-19. ICU admission data were required in 570/2439 patients (37 studies). The vertical red dashed line represents the overall mean effect size of the studies (0.26) and a prevalence of 26%. The edges of the blue diamond represent 95% confidence intervals (0.22–0.30); (d) Pooled prevalence of acute respiratory distress syndrome (ARDS) in kidney transplant recipients diagnosed with COVID-19. ARDS was present in 197/344 patients as reported in 13 studies. The vertical red dashed line represents the overall mean effect size of the studies (0.58) and a prevalence of 58%. The edges of the blue diamond represent 95% confidence intervals (0.48–0.69); (e) Pooled prevalence of mechanical ventilation requirement in kidney transplant recipients diagnosed with COVID-19. Mechanical ventilation was needed in 433/1848 patients (33 studies). The vertical red dashed line represents the overall mean effect size of the studies (0.24) and prevalence of 25%. The edges of the blue diamond represent 95% confidence intervals (0.20–0.28); (f) Pooled prevalence of mortality while on invasive ventilation in kidney transplant recipients diagnosed with COVID-19. Mortality in patients requiring invasive ventilation was 206/285 as reported (24 studies). The vertical red dashed line represents the overall mean effect size of the studies (0.68) and prevalence of 68%. The edges of the blue diamond represent 95% confidence intervals (0.58–0.79).
Figure 3
Figure 3
(a) Pooled prevalence of in-hospital mortality in kidney transplant recipients diagnosed with corona virus disease 2019 (COVID-19). In-hospital mortality was outlined in 718/3137 patients (48 studies). The vertical red dashed line represents the overall mean effect size of the studies (0.22) and prevalence of 22%. The edges of the blue diamond represent 95% confidence intervals (0.19–0.24); (b) Pooled prevalence of intensive care unit (ICU) mortality in kidney transplant recipients diagnosed with COVID-19. ICU mortality was outlined in 184/355 patients (24 studies). The vertical red dashed line represents the overall mean effect size of the studies (0.53) and prevalence of 53%. The edges of the blue diamond represent 95% confidence intervals (0.44–0.63); (c) Pooled prevalence of intensive care unit (ICU) admission in kidney transplant recipients diagnosed with COVID-19. ICU admission data were required in 570/2439 patients (37 studies). The vertical red dashed line represents the overall mean effect size of the studies (0.26) and a prevalence of 26%. The edges of the blue diamond represent 95% confidence intervals (0.22–0.30); (d) Pooled prevalence of acute respiratory distress syndrome (ARDS) in kidney transplant recipients diagnosed with COVID-19. ARDS was present in 197/344 patients as reported in 13 studies. The vertical red dashed line represents the overall mean effect size of the studies (0.58) and a prevalence of 58%. The edges of the blue diamond represent 95% confidence intervals (0.48–0.69); (e) Pooled prevalence of mechanical ventilation requirement in kidney transplant recipients diagnosed with COVID-19. Mechanical ventilation was needed in 433/1848 patients (33 studies). The vertical red dashed line represents the overall mean effect size of the studies (0.24) and prevalence of 25%. The edges of the blue diamond represent 95% confidence intervals (0.20–0.28); (f) Pooled prevalence of mortality while on invasive ventilation in kidney transplant recipients diagnosed with COVID-19. Mortality in patients requiring invasive ventilation was 206/285 as reported (24 studies). The vertical red dashed line represents the overall mean effect size of the studies (0.68) and prevalence of 68%. The edges of the blue diamond represent 95% confidence intervals (0.58–0.79).
Figure 4
Figure 4
(a) Forest plot depicting COVID-19 associated mortality risk in kidney transplant recipients with ARDS in contrast to no ARDS. The diamond shows increased risk in patients with ARDS, OR = 19.59 (red dashed line). The edges of the blue diamond represent 95% confidence intervals (6.64–57.78). ARDS: Acute respiratory distress syndrome; (b) Forest plot depicting COVID-19 associated mortality risk in kidney transplant recipients on invasive ventilation in contrast to not on invasive ventilation. The diamond shows increased risk in patients receiving invasive ventilation, OR 3.80 represented by red dashed line with the edges of the blue diamond representing 95% confidence intervals (2.35–6.14); (c) Forest plot depicting COVID-19 associated mortality risk in kidney transplant recipients receiving critical care in contrast to hospital admission without critical care. The diamond shows increased risk in patients receiving critical care group, OR 13.39 represented by red dashed line with the edges of the blue diamond representing 95% confidence intervals (7.27–24.68). OR: Odds ratio.
Figure 4
Figure 4
(a) Forest plot depicting COVID-19 associated mortality risk in kidney transplant recipients with ARDS in contrast to no ARDS. The diamond shows increased risk in patients with ARDS, OR = 19.59 (red dashed line). The edges of the blue diamond represent 95% confidence intervals (6.64–57.78). ARDS: Acute respiratory distress syndrome; (b) Forest plot depicting COVID-19 associated mortality risk in kidney transplant recipients on invasive ventilation in contrast to not on invasive ventilation. The diamond shows increased risk in patients receiving invasive ventilation, OR 3.80 represented by red dashed line with the edges of the blue diamond representing 95% confidence intervals (2.35–6.14); (c) Forest plot depicting COVID-19 associated mortality risk in kidney transplant recipients receiving critical care in contrast to hospital admission without critical care. The diamond shows increased risk in patients receiving critical care group, OR 13.39 represented by red dashed line with the edges of the blue diamond representing 95% confidence intervals (7.27–24.68). OR: Odds ratio.
Figure 5
Figure 5
(a) Forest plot depicting COVID-19 associated mortality risk in kidney transplant recipients. The diamond shows higher risk in patient group ≥60 years of age, OR= 3.90 (red dashed line). The edges of the blue diamond represent 95% confidence intervals (2.56–5.94); (b) Forest plot depicting COVID-19 associated mortality risk in kidney transplant recipients in the late post-transplant period group (>2 years) in contrast to the early post-transplant period (≤2 years). The diamond shows no increased risk between the groups; OR 1.37 represented by red dashed line with the edges of the blue diamond representing 95% confidence intervals (0.72–2.58); (c) Forest plot depicting sex related mortality risk in COVID-19 suffering kidney transplant recipients. The diamond shows no increased risk between the groups; OR 0.71 represented by vertical red dashed line with the edges of the blue diamond representing 95% confidence intervals (0.50–1.01). OR: Odds ratio.
Figure 5
Figure 5
(a) Forest plot depicting COVID-19 associated mortality risk in kidney transplant recipients. The diamond shows higher risk in patient group ≥60 years of age, OR= 3.90 (red dashed line). The edges of the blue diamond represent 95% confidence intervals (2.56–5.94); (b) Forest plot depicting COVID-19 associated mortality risk in kidney transplant recipients in the late post-transplant period group (>2 years) in contrast to the early post-transplant period (≤2 years). The diamond shows no increased risk between the groups; OR 1.37 represented by red dashed line with the edges of the blue diamond representing 95% confidence intervals (0.72–2.58); (c) Forest plot depicting sex related mortality risk in COVID-19 suffering kidney transplant recipients. The diamond shows no increased risk between the groups; OR 0.71 represented by vertical red dashed line with the edges of the blue diamond representing 95% confidence intervals (0.50–1.01). OR: Odds ratio.
Figure 6
Figure 6
Forest plot depicting COVID-19 associated mortality risk in chronic kidney disease (CKD) patients on waitlist/dialysis in contrast to kidney transplant recipients. The diamond shows no increased risk of death; OR 1.24 represented by red dashed line with the edges of the blue diamond representing 95% confidence intervals (0.92–1.66). OR: Odds ratio.

References

    1. Wang L., He W., Yu X., Hu D., Bao M., Liu H., Zhou J., Jiang H. Coronavirus Disease 2019 in Elderly Patients: Characteristics and Prognostic Factors Based on 4-Week Follow-Up. J. Infect. 2020;80:639–645. doi: 10.1016/j.jinf.2020.03.019. - DOI - PMC - PubMed
    1. Zheng K.I., Gao F., Wang X.-B., Sun Q.-F., Pan K.-H., Wang T.-Y., Ma H.-L., Chen Y.-P., Liu W.-Y., George J., et al. Letter to the Editor: Obesity as a Risk Factor for Greater Severity of COVID-19 in Patients with Metabolic Associated Fatty Liver Disease. Metabolism. 2020;108:154244. doi: 10.1016/j.metabol.2020.154244. - DOI - PMC - PubMed
    1. Zhou F., Yu T., Du R., Fan G., Liu Y., Liu Z., Xiang J., Wang Y., Song B., Gu X., et al. Clinical Course and Risk Factors for Mortality of Adult Inpatients with COVID-19 in Wuhan, China: A Retrospective Cohort Study. Lancet. 2020;395:1054–1062. doi: 10.1016/S0140-6736(20)30566-3. - DOI - PMC - PubMed
    1. Laupacis A., Keown P., Pus N., Krueger H., Ferguson B., Wong C., Muirhead N. A Study of the Quality of Life and Cost-Utility of Renal Transplantation. Kidney Int. 1996;50:235–242. doi: 10.1038/ki.1996.307. - DOI - PubMed
    1. Kostro J.Z., Hellmann A., Kobiela J., Skóra I., Lichodziejewska-Niemierko M., Dębska-Ślizień A., Śledziński Z. Quality of Life After Kidney Transplantation: A Prospective Study. Transplant. Proc. 2016;48:50–54. doi: 10.1016/j.transproceed.2015.10.058. - DOI - PubMed

LinkOut - more resources