. 2022 Mar 1;12(3):670-691.
doi: 10.1158/2159-8290.CD-21-0683.

Single-Cell Atlas of Lineage States, Tumor Microenvironment, and Subtype-Specific Expression Programs in Gastric Cancer

Affiliations

Single-Cell Atlas of Lineage States, Tumor Microenvironment, and Subtype-Specific Expression Programs in Gastric Cancer

Vikrant Kumar et al. Cancer Discov. .

Abstract

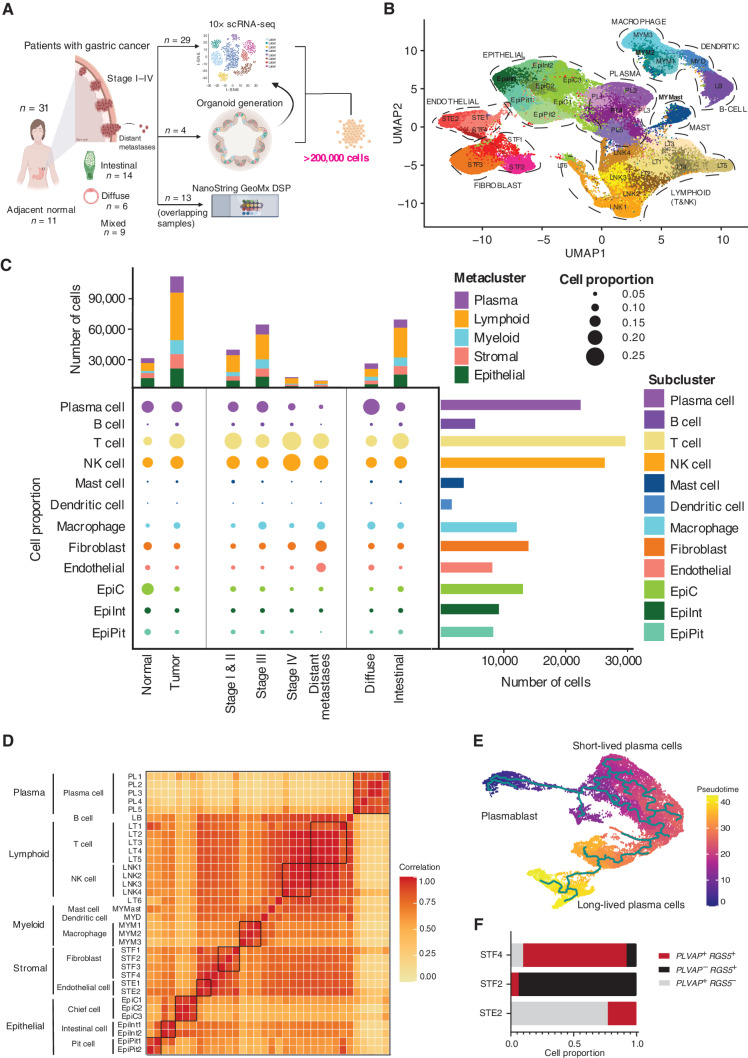
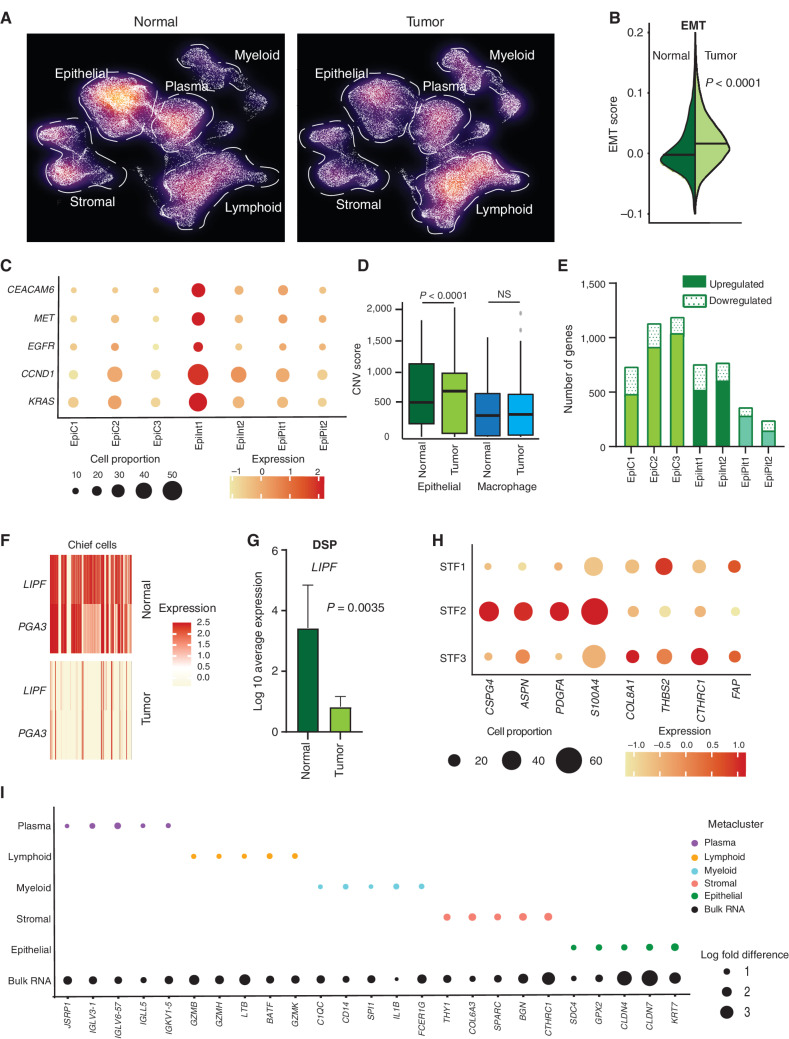
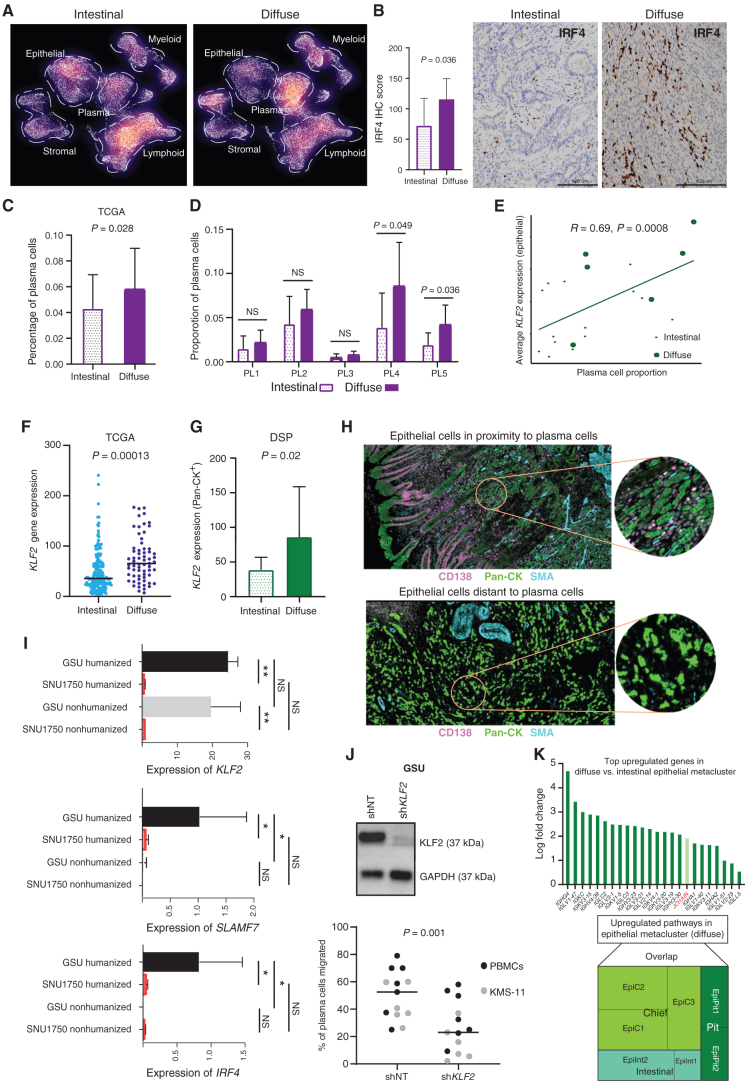
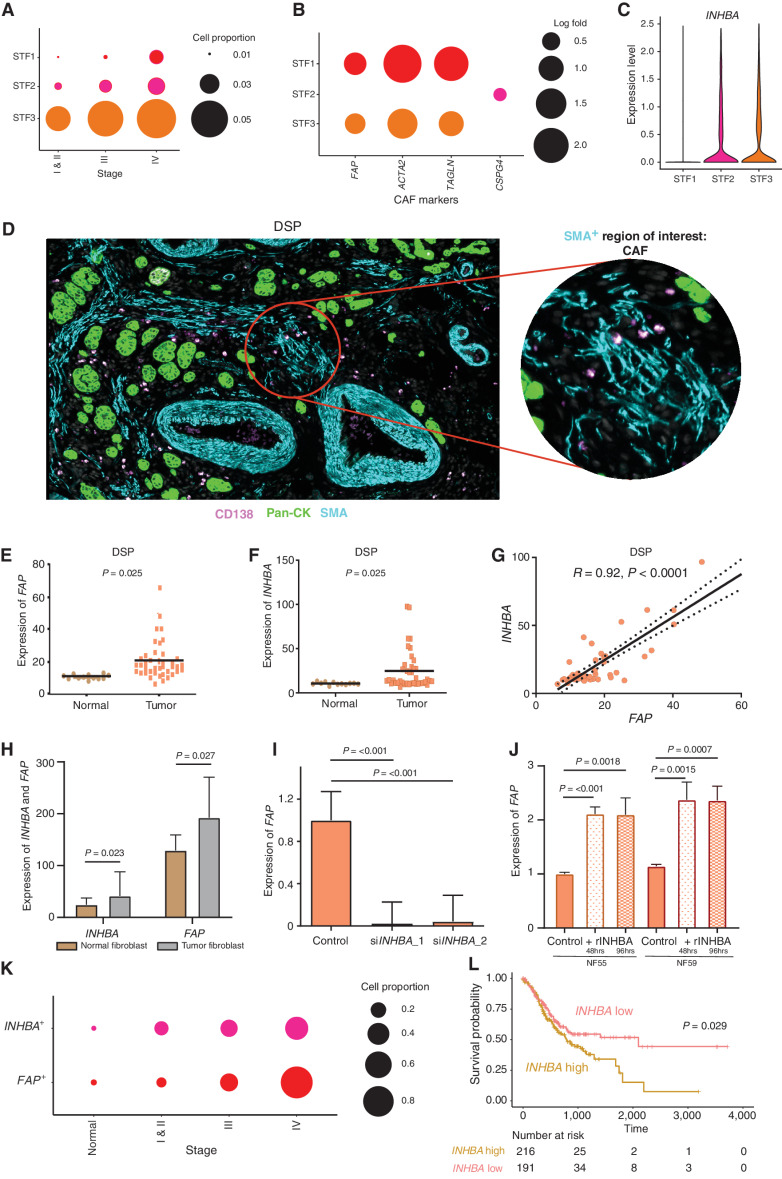
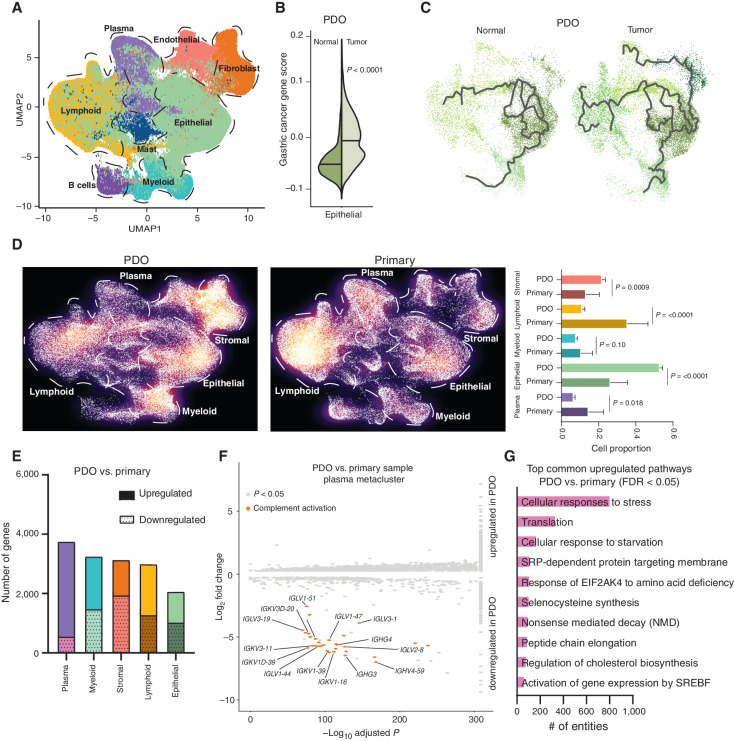
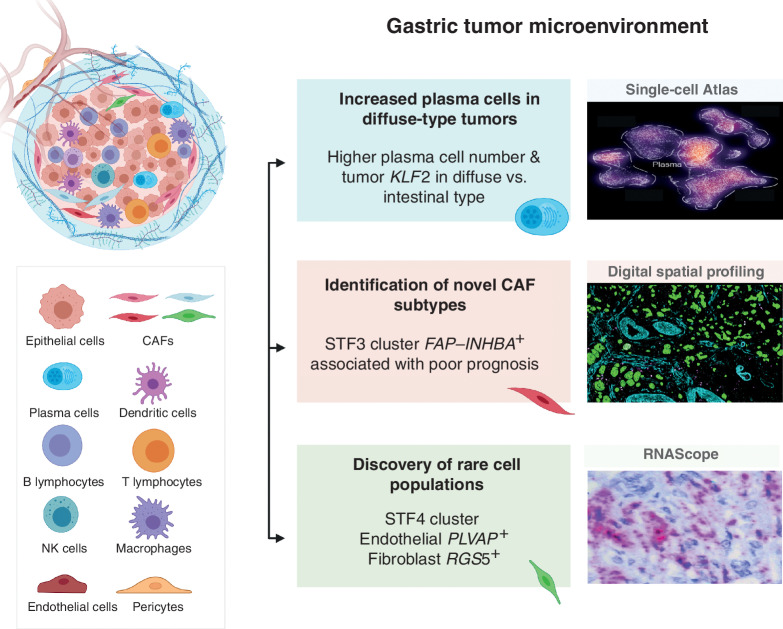
Gastric cancer heterogeneity represents a barrier to disease management. We generated a comprehensive single-cell atlas of gastric cancer (>200,000 cells) comprising 48 samples from 31 patients across clinical stages and histologic subtypes. We identified 34 distinct cell-lineage states including novel rare cell populations. Many lineage states exhibited distinct cancer-associated expression profiles, individually contributing to a combined tumor-wide molecular collage. We observed increased plasma cell proportions in diffuse-type tumors associated with epithelial-resident KLF2 and stage-wise accrual of cancer-associated fibroblast subpopulations marked by high INHBA and FAP coexpression. Single-cell comparisons between patient-derived organoids (PDO) and primary tumors highlighted inter- and intralineage similarities and differences, demarcating molecular boundaries of PDOs as experimental models. We complemented these findings by spatial transcriptomics, orthogonal validation in independent bulk RNA-sequencing cohorts, and functional demonstration using in vitro and in vivo models. Our results provide a high-resolution molecular resource of intra- and interpatient lineage states across distinct gastric cancer subtypes.

Significance: We profiled gastric malignancies at single-cell resolution and identified increased plasma cell proportions as a novel feature of diffuse-type tumors. We also uncovered distinct cancer-associated fibroblast subtypes with INHBA-FAP-high cell populations as predictors of poor clinical prognosis. Our findings highlight potential origins of deregulated cell states in the gastric tumor ecosystem. This article is highlighted in the In This Issue feature, p. 587.


Figures

Figure 1. scRNA-seq of gastric tumor and normal samples defines 34 cell states including rare cell populations. A, Schematic representation of experimental design and techniques used in this study. Thirty-one unique patients with gastric cancer undergoing surgical resection or endoscopy had tumor samples (n = 31) and adjacent normal samples (n = 11) harvested for analysis. Tumors ranged from stage I to IV and included samples of both primary tumors, distant (peritoneal) metastases, and matched normal gastric tissues. Twenty-nine tumors had scRNA-seq performed using the 10× platform (along with 11 adjacent normal tissues). Four patients had PDOs generated from their tumors (4 tumors + 4 adjacent normal), which were also sequenced by 10× scRNA-seq. A subset of 13 samples also had DSP performed using the NanoString GeoMx platform (10 tumor + 3 normal). In total, more than 200,000 cells were sequenced in this study. B, Uniform Manifold Approximation and Projection (UMAP) of 152,423 cells representing 34 unique cell states color-coded by their corresponding cell lineage or subtype. Each dot in the UMAP represents a single cell. C, Cell-lineage compositions of gastric cancer and normal samples inferred by scRNA-seq data. Middle (bubble plot), cell subclusters (rows) by tumor versus normal, stage, and gastric cancer histologic subtype (diffuse vs. intestinal). The size of the circle represents the cell proportion of each specific cell lineage/type. The circles are color-coded by defined cell lineages/types as shown in B. The stacked bar graph on the top shows the number of cells in each meta-cluster for each category. The histogram on the right shows the absolute cell numbers in each subcluster. D, Cluster–cluster heat map of gene-expression data of all 34 cell states across all samples using Pearson correlation matrix. Darker colors correspond to higher correlation. E, Pseudotime analysis of plasma metacluster generated using Monocle. The trajectory was rooted against the plasmablasts. Pseudotime analysis demonstrates different stages of plasma cell differentiation and maturation including plasmablasts, short-lived plasma cells, and long-lived plasma cells. F, Expression of PLVAP and RGS5 in endothelial (STE2) and fibroblast (STF2 and STF4) clusters. Doublets were identified and filtered out using DoubletFinder. PLVAP+ RGS5− cells are predominantly present in the endothelial cluster (STE2). PLVAP− RGS5+ cells are predominant in the fibroblast cluster (STF2). The STF4 cluster shows cells expressing PLVAP+ RGS5+, suggestive of a rare mixed-lineage population.
Figure 1.
scRNA-seq of gastric tumor and normal samples defines 34 cell states including rare cell populations. A, Schematic representation of experimental design and techniques used in this study. Thirty-one unique patients with gastric cancer undergoing surgical resection or endoscopy had tumor samples (n = 31) and adjacent normal samples (n = 11) harvested for analysis. Tumors ranged from stage I to IV and included samples of both primary tumors, distant (peritoneal) metastases, and matched normal gastric tissues. Twenty-nine tumors had scRNA-seq performed using the 10× platform (along with 11 adjacent normal tissues). Four patients had PDOs generated from their tumors (4 tumors + 4 adjacent normal), which were also sequenced by 10× scRNA-seq. A subset of 13 samples also had DSP performed using the NanoString GeoMx platform (10 tumor + 3 normal). In total, more than 200,000 cells were sequenced in this study. B, Uniform Manifold Approximation and Projection (UMAP) of 152,423 cells representing 34 unique cell states color-coded by their corresponding cell lineage or subtype. Each dot in the UMAP represents a single cell. C, Cell-lineage compositions of gastric cancer and normal samples inferred by scRNA-seq data. Middle (bubble plot), cell subclusters (rows) by tumor versus normal, stage, and gastric cancer histologic subtype (diffuse vs. intestinal). The size of the circle represents the cell proportion of each specific cell lineage/type. The circles are color-coded by defined cell lineages/types as shown in B. The stacked bar graph on the top shows the number of cells in each meta-cluster for each category. The histogram on the right shows the absolute cell numbers in each subcluster. D, Cluster–cluster heat map of gene-expression data of all 34 cell states across all samples using Pearson correlation matrix. Darker colors correspond to higher correlation. E, Pseudotime analysis of plasma metacluster generated using Monocle. The trajectory was rooted against the plasmablasts. Pseudotime analysis demonstrates different stages of plasma cell differentiation and maturation including plasmablasts, short-lived plasma cells, and long-lived plasma cells. F, Expression of PLVAP and RGS5 in endothelial (STE2) and fibroblast (STF2 and STF4) clusters. Doublets were identified and filtered out using DoubletFinder. PLVAP+RGS5 cells are predominantly present in the endothelial cluster (STE2). PLVAPRGS5+ cells are predominant in the fibroblast cluster (STF2). The STF4 cluster shows cells expressing PLVAP+RGS5+, suggestive of a rare mixed-lineage population.
Figure 2. scRNA-seq deconvolutes gastric tumor programs associated with distinct cell states. A, Density plot of UMAP representation comparing normal and gastric tumor samples after random downsampling to approximately 30,000 cells each to allow statistical equivalence. Each dot represents a single cell. Dashed lines highlight higher proportions of epithelial cells in normal samples and myeloid cells in tumor samples. B, Split violin plot of EMT oncogenic gene signature score in normal and tumor cells, showing a significantly higher score in tumor cells. C, Bubble plot depicting the expression of gastric cancer oncogenes in tumor epithelial cell clusters. The size of the circle represents the percentage of cells expressing the gene in that specific epithelial cell cluster, whereas the color represents the average expression of the gene. D, Box plot depicting CNV scores for epithelial cells (green) and macrophage cells (blue) in normal and tumor samples. CNV scores were computed using InferCNV. P values were computed using Wilcoxon rank-sum test. E, Bar graph depicting differences in transcriptomic profiles between tumor and normal tissue by number of upregulated and downregulated genes in epithelial cell clusters. F, Heat map of LIPF and PGA3 gene expression (classic chief cell marker genes) in tumor versus normal samples. Darker color signifies higher expression. G, Gene expression of LIPF by DSP analysis, in tumor epithelial cells (Pan-CK+) compared with normal samples (n = 13). H, Bubble plot depicting sublineage-specific expression of CAF marker genes FAP, CSPG4, PDGFA, ASPN, S100A4, COL8A1, THBS2, and CTHRC1 in fibroblast clusters. STF1 and STF3 are LUM-associated fibroblasts, whereas STF2 comprises proangiogenic pericytes. The size of the circle represents the percentage of cells expressing the gene in that specific fibroblast cell cluster, whereas the color represents the average expression of the gene. I, Bubble plot depicting significant log fold differences in expression of genes between tumor and normal by metacluster mapped against the bulk RNA-seq data (five genes per metacluster are shown). The size of the circle represents the log fold change in the expression of specific genes.
Figure 2.
scRNA-seq deconvolutes gastric tumor programs associated with distinct cell states. A, Density plot of UMAP representation comparing normal and gastric tumor samples after random downsampling to approximately 30,000 cells each to allow statistical equivalence. Each dot represents a single cell. Dashed lines highlight higher proportions of epithelial cells in normal samples and myeloid cells in tumor samples. B, Split violin plot of EMT oncogenic gene signature score in normal and tumor cells, showing a significantly higher score in tumor cells. C, Bubble plot depicting the expression of gastric cancer oncogenes in tumor epithelial cell clusters. The size of the circle represents the percentage of cells expressing the gene in that specific epithelial cell cluster, whereas the color represents the average expression of the gene. D, Box plot depicting CNV scores for epithelial cells (green) and macrophage cells (blue) in normal and tumor samples. CNV scores were computed using InferCNV. P values were computed using Wilcoxon rank-sum test. E, Bar graph depicting differences in transcriptomic profiles between tumor and normal tissue by number of upregulated and downregulated genes in epithelial cell clusters. F, Heat map of LIPF and PGA3 gene expression (classic chief cell marker genes) in tumor versus normal samples. Darker color signifies higher expression. G, Gene expression of LIPF by DSP analysis, in tumor epithelial cells (Pan-CK+) compared with normal samples (n = 13). H, Bubble plot depicting sublineage-specific expression of CAF marker genes FAP, CSPG4, PDGFA, ASPN, S100A4, COL8A1, THBS2, and CTHRC1 in fibroblast clusters. STF1 and STF3 are LUM-associated fibroblasts, whereas STF2 comprises proangiogenic pericytes. The size of the circle represents the percentage of cells expressing the gene in that specific fibroblast cell cluster, whereas the color represents the average expression of the gene. I, Bubble plot depicting significant log fold differences in expression of genes between tumor and normal by metacluster mapped against the bulk RNA-seq data (five genes per metacluster are shown). The size of the circle represents the log fold change in the expression of specific genes.
Figure 3. Differential TME analysis between histologic subtypes identifies increased plasma cells in diffuse-type tumors. A, Density plot of UMAP representation comparing diffuse and intestinal gastric cancer samples after random downsampling to approximately 25,000 cells each. Each dot represents a single cell. Dashed lines highlight a higher proportion of plasma cells in diffuse gastric cancer. B, IHC staining of IRF4 expression in diffuse (n = 5) and intestinal (n = 12) gastric cancer samples (scale bar, 400 μm). Bar graph showing significantly higher average IRF4 IHC score in diffuse compared with intestinal gastric cancer. C, Plasma cell proportions deconvoluted by CIBERSORTX in diffuse and intestinal gastric cancer in the TCGA data set (diffuse n = 63; intestinal n = 167). D, Bar graph showing enrichment of plasma cell proportions in PL4 and PL5 plasma subclusters in diffuse versus intestinal gastric cancer single-cell samples. E, Pearson correlation plot showing significant positive correlation of plasma cell proportion to average KLF2 expression in the epithelial metacluster. F, Bee swarm plot showing increased KLF2 expression in diffuse versus intestinal gastric cancer samples in the bulk RNA-seq TCGA-STAD data set. G, Bar graph showing increased KLF2 expression in Pan-CK+ epithelial morphologic regions of diffuse versus intestinal gastric cancer by DSP (n = 10). H, DSP analysis depicting epithelial ROIs proximal (top) and distal to plasma cells (bottom). Analysis is based on immunofluorescence staining for Pan-CK (epithelial, green), CD138 (plasma, pink), smooth muscle actin (SMA; fibroblast, cyan), and DAPI (blue). Each circular ROI is 300 μm in diameter. I, Bar graph showing expression of KLF2, IRF4, and SLAMF7 genes in GSU humanized and nonhumanized mice against SNU1750 humanized and nonhumanized mice. *, P < 0.05; **, P < 0.01. J, Western blot (top) showing stable knockdown of KLF2 in gastric cancer cell line GSU (shKLF2) compared with shNT (nontargeting) control. Loss of KLF2 in GSU significantly reduces migration of plasma cells derived from peripheral blood mononuclear cells (PBMC) and multiple myeloma cell line KMS-11 (N = 17; bottom). K, Upregulation of immunoglobulin genes in diffuse versus intestinal epithelial metacluster (top). Tree map shows the overlap of upregulated pathways in epithelial metacluster versus subclusters, with the EpiC cluster showing the greatest overlap (bottom).
Figure 3.
Differential TME analysis between histologic subtypes identifies increased plasma cells in diffuse-type tumors. A, Density plot of UMAP representation comparing diffuse and intestinal gastric cancer samples after random downsampling to approximately 25,000 cells each. Each dot represents a single cell. Dashed lines highlight a higher proportion of plasma cells in diffuse gastric cancer. B, IHC staining of IRF4 expression in diffuse (n = 5) and intestinal (n = 12) gastric cancer samples (scale bar, 400 μm). Bar graph showing significantly higher average IRF4 IHC score in diffuse compared with intestinal gastric cancer. C, Plasma cell proportions deconvoluted by CIBERSORTX in diffuse and intestinal gastric cancer in the TCGA data set (diffuse n = 63; intestinal n = 167). D, Bar graph showing enrichment of plasma cell proportions in PL4 and PL5 plasma subclusters in diffuse versus intestinal gastric cancer single-cell samples. E, Pearson correlation plot showing significant positive correlation of plasma cell proportion to average KLF2 expression in the epithelial metacluster. F, Bee swarm plot showing increased KLF2 expression in diffuse versus intestinal gastric cancer samples in the bulk RNA-seq TCGA-STAD data set. G, Bar graph showing increased KLF2 expression in Pan-CK+ epithelial morphologic regions of diffuse versus intestinal gastric cancer by DSP (n = 10). H, DSP analysis depicting epithelial ROIs proximal (top) and distal to plasma cells (bottom). Analysis is based on immunofluorescence staining for Pan-CK (epithelial, green), CD138 (plasma, pink), smooth muscle actin (SMA; fibroblast, cyan), and DAPI (blue). Each circular ROI is 300 μm in diameter. I, Bar graph showing expression of KLF2, IRF4, and SLAMF7 genes in GSU humanized and nonhumanized mice against SNU1750 humanized and nonhumanized mice. *, P < 0.05; **, P < 0.01. J, Western blot (top) showing stable knockdown of KLF2 in gastric cancer cell line GSU (shKLF2) compared with shNT (nontargeting) control. Loss of KLF2 in GSU significantly reduces migration of plasma cells derived from peripheral blood mononuclear cells (PBMC) and multiple myeloma cell line KMS-11 (N = 17; bottom). K, Upregulation of immunoglobulin genes in diffuse versus intestinal epithelial metacluster (top). Tree map shows the overlap of upregulated pathways in epithelial metacluster versus subclusters, with the EpiC cluster showing the greatest overlap (bottom).
Figure 4. scRNA-seq enables identification of distinct gastric cancer fibroblast subtypes and INHBA–FAP axis as a CAF regulator. A, Bubble plots demonstrating stage-dependent increases in the proportion of fibroblast cells with STF3 being the dominant subcluster. The size of the circle represents the proportion of cells expressing subcluster-specific genes. B, Bubble plots showing fibroblast subclusters (STF1–3) expressing distinct CAF canonical markers (FAP, CSPG4, ACTA2, and TAGLN). The size of the circle represents the proportion of cells expressing different genes. C, Violin plot showing the expression of INHBA in STF2 and STF3 fibroblast clusters with negligible expression in the STF1 fibroblast cluster. D, Fibroblast ROIs captured by DSP analysis based on immunofluorescence staining for Pan-CK (epithelial, green), CD138 (plasma, pink), SMA (fibroblast, cyan), and DAPI (blue). The circular ROI is 300 μm in diameter. E, Bee swarm plot showing differential expression of FAP in fibroblast ROIs of normal and tumor samples by DSP (n = 13). F, Bee swarm plot showing differential expression of INHBA in fibroblast ROIs of normal and tumor samples by DSP (n = 13). G, Pearson correlation graph demonstrating strong positive correlations between INHBA and FAP gene expression in fibroblast ROIs using DSP. H, Bar graph showing significant expression of FAP and INHBA genes in flow-sorted tumor fibroblasts compared with matched normal fibroblasts (n = 10 each). I, Bar graph showing significant reduction in FAP gene expression after siRNA-mediated INHBA knockdown in tumor fibroblast lines. Two independent siRNAs were used. J, Bar graph showing significant increases in FAP gene expression in two normal fibroblast lines after treatment with recombinant INHBA (rINHBA) for 48 and 96 hours, respectively. K, Bubble plot depicting stage-dependent increases of FAP+ and INHBA+ cells in fibroblast cluster STF3 (P = 0.041). The circle sizes represent the relative proportion of cells expressing these genes. P values were computed using Kendall's τ method. L, Kaplan–Meier survival curves of TCGA-STAD data showing significant differences in overall survival between INHBA-high and INHBA-low samples. P values were computed using log-rank tests.
Figure 4.
scRNA-seq enables identification of distinct gastric cancer fibroblast subtypes and INHBAFAP axis as a CAF regulator. A, Bubble plots demonstrating stage-dependent increases in the proportion of fibroblast cells with STF3 being the dominant subcluster. The size of the circle represents the proportion of cells expressing subcluster-specific genes. B, Bubble plots showing fibroblast subclusters (STF1–3) expressing distinct CAF canonical markers (FAP, CSPG4, ACTA2, and TAGLN). The size of the circle represents the proportion of cells expressing different genes. C, Violin plot showing the expression of INHBA in STF2 and STF3 fibroblast clusters with negligible expression in the STF1 fibroblast cluster. D, Fibroblast ROIs captured by DSP analysis based on immunofluorescence staining for Pan-CK (epithelial, green), CD138 (plasma, pink), SMA (fibroblast, cyan), and DAPI (blue). The circular ROI is 300 μm in diameter. E, Bee swarm plot showing differential expression of FAP in fibroblast ROIs of normal and tumor samples by DSP (n = 13). F, Bee swarm plot showing differential expression of INHBA in fibroblast ROIs of normal and tumor samples by DSP (n = 13). G, Pearson correlation graph demonstrating strong positive correlations between INHBA and FAP gene expression in fibroblast ROIs using DSP. H, Bar graph showing significant expression of FAP and INHBA genes in flow-sorted tumor fibroblasts compared with matched normal fibroblasts (n = 10 each). I, Bar graph showing significant reduction in FAP gene expression after siRNA-mediated INHBA knockdown in tumor fibroblast lines. Two independent siRNAs were used. J, Bar graph showing significant increases in FAP gene expression in two normal fibroblast lines after treatment with recombinant INHBA (rINHBA) for 48 and 96 hours, respectively. K, Bubble plot depicting stage-dependent increases of FAP+ and INHBA+ cells in fibroblast cluster STF3 (P = 0.041). The circle sizes represent the relative proportion of cells expressing these genes. P values were computed using Kendall's τ method. L, Kaplan–Meier survival curves of TCGA-STAD data showing significant differences in overall survival between INHBA-high and INHBA-low samples. P values were computed using log-rank tests.
Figure 5. Comparative analysis of primary and organoid samples. A, UMAP representation of approximately 200,000 cells (∼48,000 cells from tumor PDOs with matched normal PDOs, combined with primary samples; ∼152,000 cells) recapitulating the major five metaclusters color-coded by their cell types. Each dot in the UMAP represents a single cell. B, Violin plot showing the expression of gastric cancer gene module scores in tumor PDOs compared with matched normal samples. C, Trajectory plot analysis of epithelial cells from tumor and normal PDOs demonstrating the expression of cellular differentiation gene programs in tumor PDOs depicted by long multiple branches. D, Density plot of UMAP representation comparing PDO and primary gastric samples demonstrating enrichment of lymphoid and plasma metaclusters in primary samples compared with PDOs. E, Graph showing the number of upregulated and downregulated genes in PDOs versus primary samples in the five metaclusters. The plasma meta-cluster shows the highest number of differentially expressed genes as compared with other metaclusters. F, Volcano plot of upregulated and downregulated genes in the plasma metacluster between PDOs and primary samples, showing significant downregulation of antibody-mediated complement factor genes in PDOs. x-axis shows the −log10 adjusted P value and y-axis log2 fold change in gene expression. G, Top common upregulated pathways in PDOs versus primary samples across all metaclusters.
Figure 5.
Comparative analysis of primary and organoid samples. A, UMAP representation of approximately 200,000 cells (∼48,000 cells from tumor PDOs with matched normal PDOs, combined with primary samples; ∼152,000 cells) recapitulating the major five metaclusters color-coded by their cell types. Each dot in the UMAP represents a single cell. B, Violin plot showing the expression of gastric cancer gene module scores in tumor PDOs compared with matched normal samples. C, Trajectory plot analysis of epithelial cells from tumor and normal PDOs demonstrating the expression of cellular differentiation gene programs in tumor PDOs depicted by long multiple branches. D, Density plot of UMAP representation comparing PDO and primary gastric samples demonstrating enrichment of lymphoid and plasma metaclusters in primary samples compared with PDOs. E, Graph showing the number of upregulated and downregulated genes in PDOs versus primary samples in the five metaclusters. The plasma meta-cluster shows the highest number of differentially expressed genes as compared with other metaclusters. F, Volcano plot of upregulated and downregulated genes in the plasma metacluster between PDOs and primary samples, showing significant downregulation of antibody-mediated complement factor genes in PDOs. x-axis shows the −log10 adjusted P value and y-axis log2 fold change in gene expression. G, Top common upregulated pathways in PDOs versus primary samples across all metaclusters.
Figure 6. Comprehensive single-cell atlas of gastric cancer. This study included more than 200,000 cells from 31 primary gastric tumor samples. In total, 34 distinct cell-lineage states were identified, related by developmental trajectories and previously unreported rare cell populations. An increase in plasma cell proportions was observed as a feature of diffuse-type tumors associated with epithelial-resident KLF2. A stage-wise accrual of novel cancer-associated fibroblast subpopulations was marked by high INHBA and FAP coexpression. Findings were complemented using digital spatial transcriptomics and RNAScope. Our results provide a high-resolution molecular resource for gastric cancer translational studies, identifying intra- and interpatient lineage states across distinct gastric cancer subtypes.
Figure 6.
Comprehensive single-cell atlas of gastric cancer. This study included more than 200,000 cells from 31 primary gastric tumor samples. In total, 34 distinct cell-lineage states were identified, related by developmental trajectories and previously unreported rare cell populations. An increase in plasma cell proportions was observed as a feature of diffuse-type tumors associated with epithelial-resident KLF2. A stage-wise accrual of novel cancer-associated fibroblast subpopulations was marked by high INHBA and FAP coexpression. Findings were complemented using digital spatial transcriptomics and RNAScope. Our results provide a high-resolution molecular resource for gastric cancer translational studies, identifying intra- and interpatient lineage states across distinct gastric cancer subtypes.

Comment in

  • Cancer Discov. 12:587.
  • Cancer Discov. 12:587.

References

    1. Bray F, Ferlay J, Soerjomataram I, Siegel RL, Torre LA, Jemal A. Global cancer statistics 2018: GLOBOCAN estimates of incidence and mortality worldwide for 36 cancers in 185 countries. CA Cancer J Clin 2018;68:394–424. - PubMed
    1. The global, regional, and national burden of stomach cancer in 195 countries, 1990–2017: a systematic analysis for the Global Burden of Disease study 2017. Lancet Gastroenterol Hepatol 2020;5:42–54. - PMC - PubMed
    1. Cancer Genome Atlas Research Network. Comprehensive molecular characterization of gastric adenocarcinoma. Nature 2014;513:202–9. - PMC - PubMed
    1. Cristescu R, Lee J, Nebozhyn M, Kim KM, Ting JC, Wong SSet al. . Molecular analysis of gastric cancer identifies subtypes associated with distinct clinical outcomes. Nat Med 2015;21:449–56. - PubMed
    1. Sundar R, Liu DH, Hutchins GG, Slaney HL, Silva AN, Oosting Jet al. . Spatial profiling of gastric cancer patient-matched primary and locoregional metastases reveals principles of tumour dissemination. Gut 2021;70:1823–32. - PMC - PubMed

Publication types