. 2021 Nov 17;41(46):9539-9560.
doi: 10.1523/JNEUROSCI.2600-20.2021. Epub 2021 Oct 12.

Neurokinin B-Expressing Neurons of the Central Extended Amygdala Mediate Inhibitory Synaptic Input onto Melanin-Concentrating Hormone Neuron Subpopulations

Affiliations

Neurokinin B-Expressing Neurons of the Central Extended Amygdala Mediate Inhibitory Synaptic Input onto Melanin-Concentrating Hormone Neuron Subpopulations

Akie Fujita et al. J Neurosci. .

Abstract

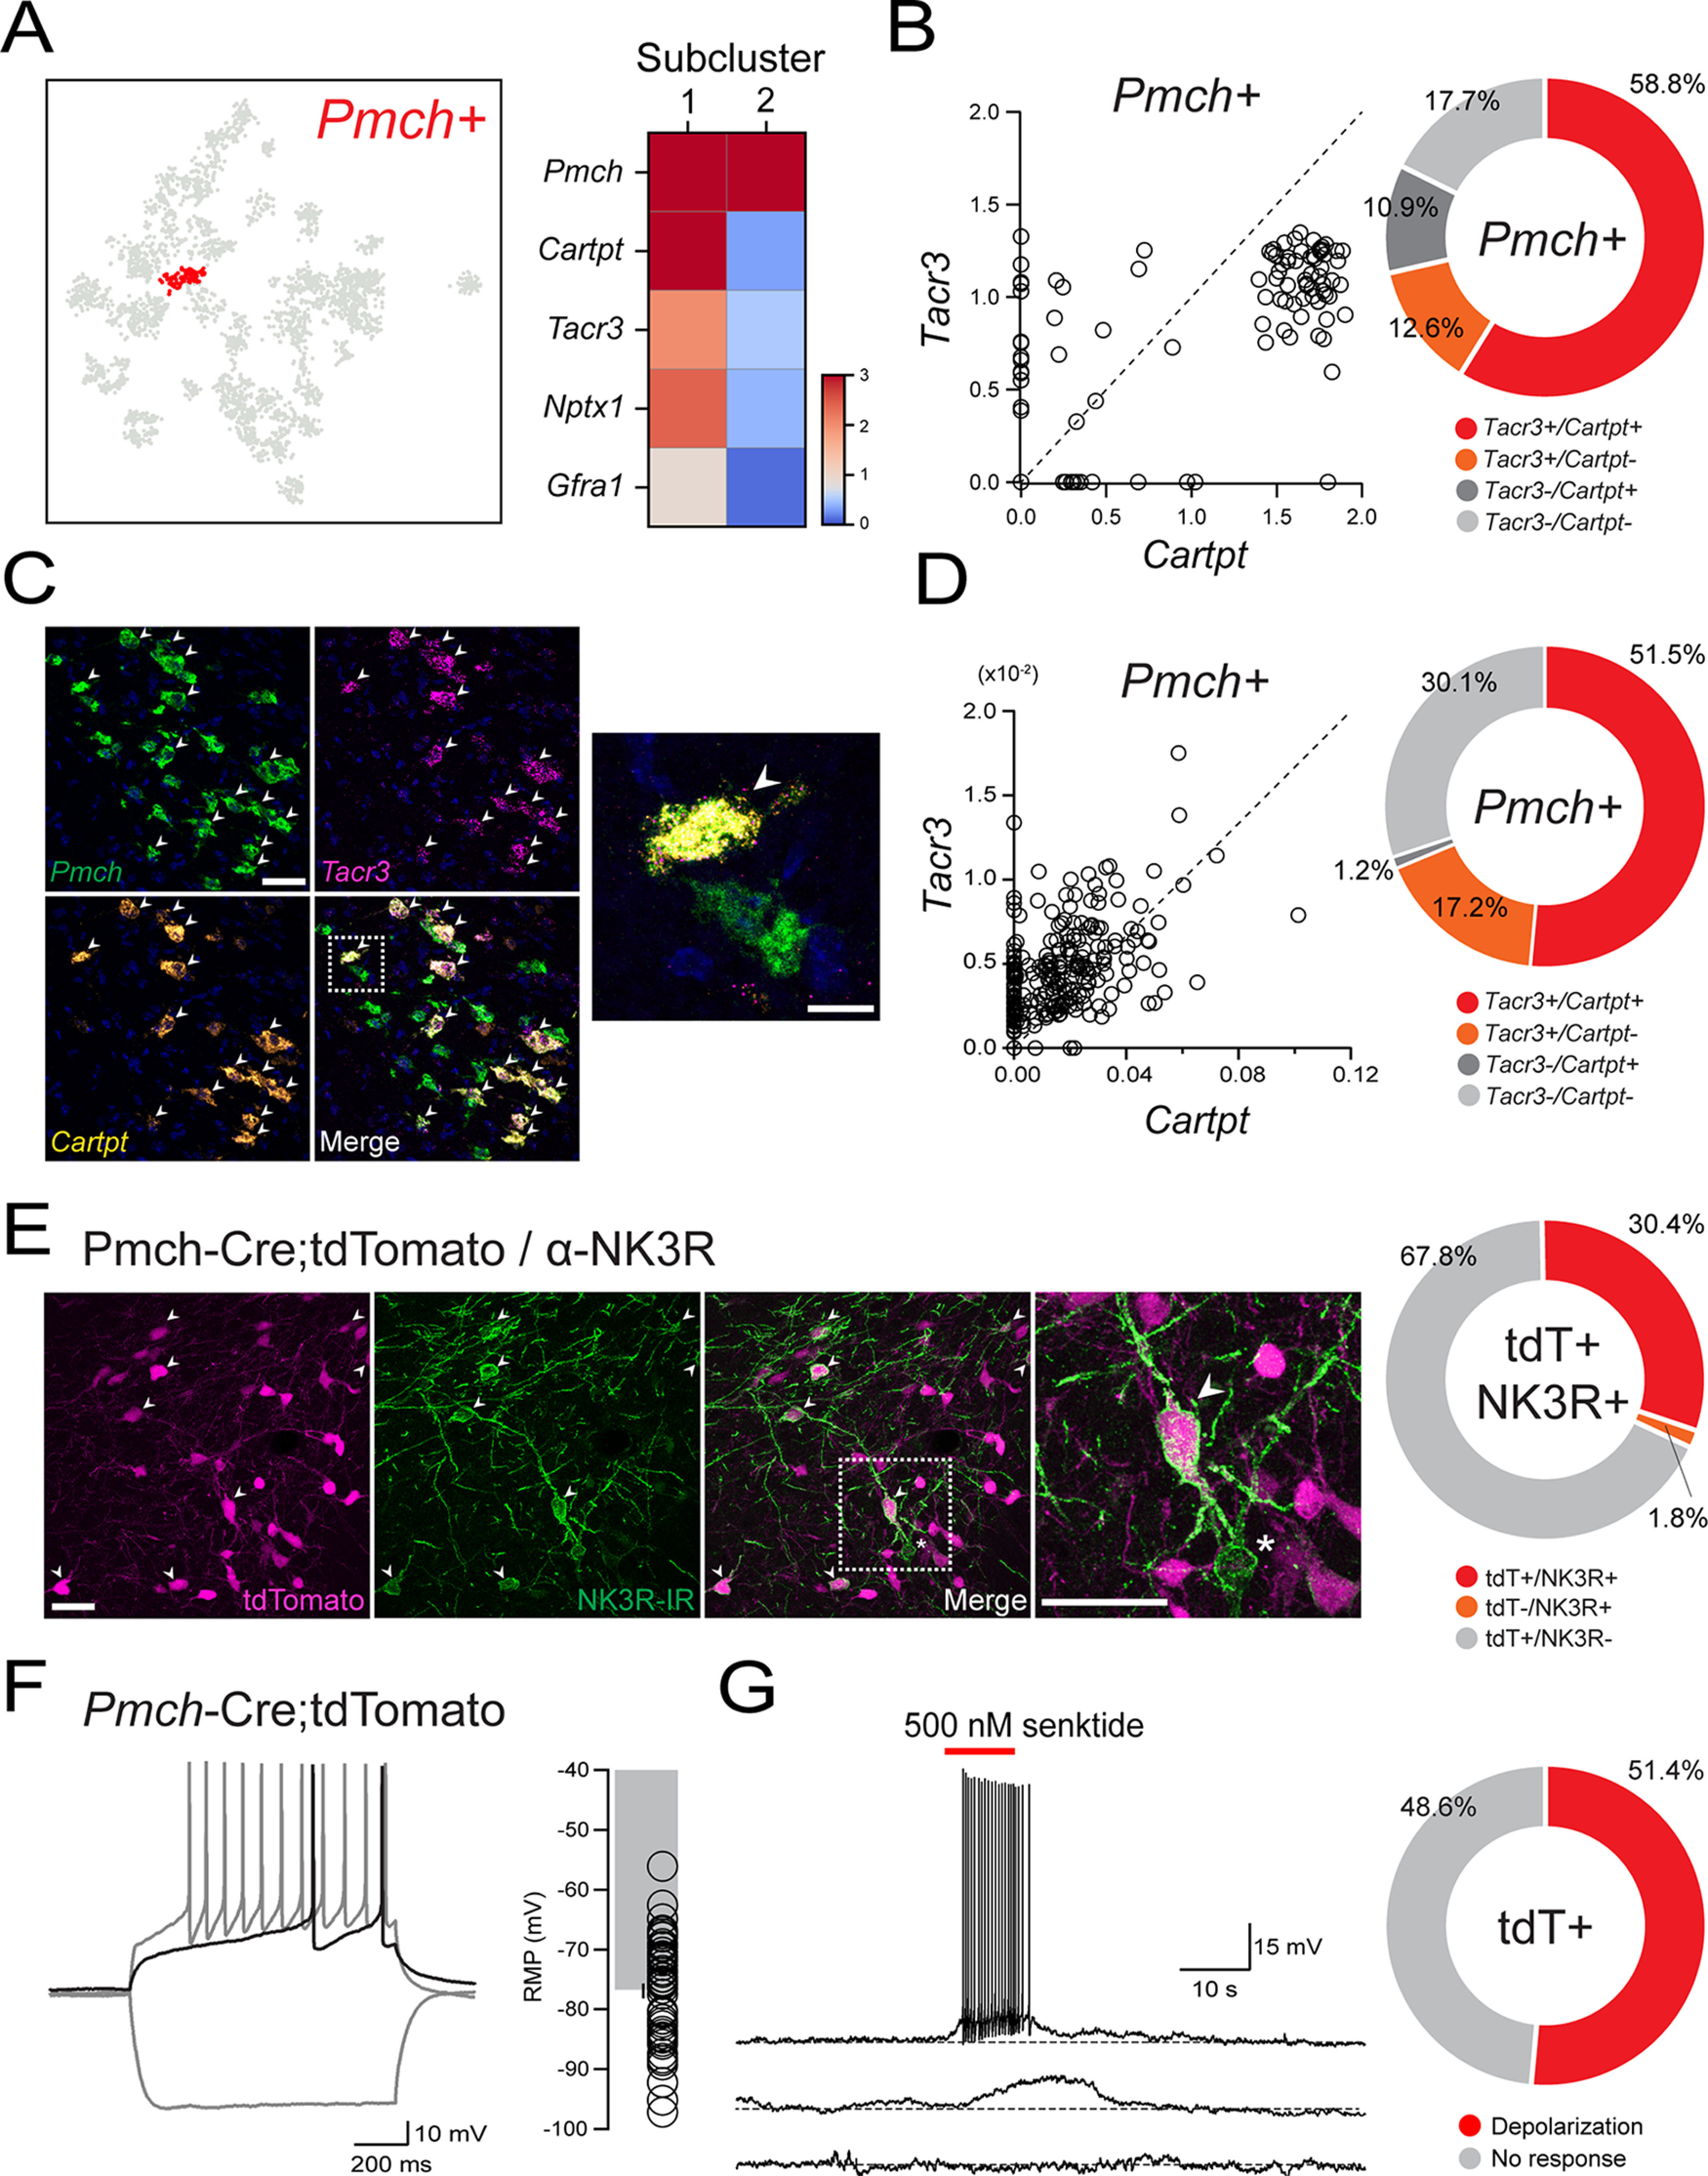
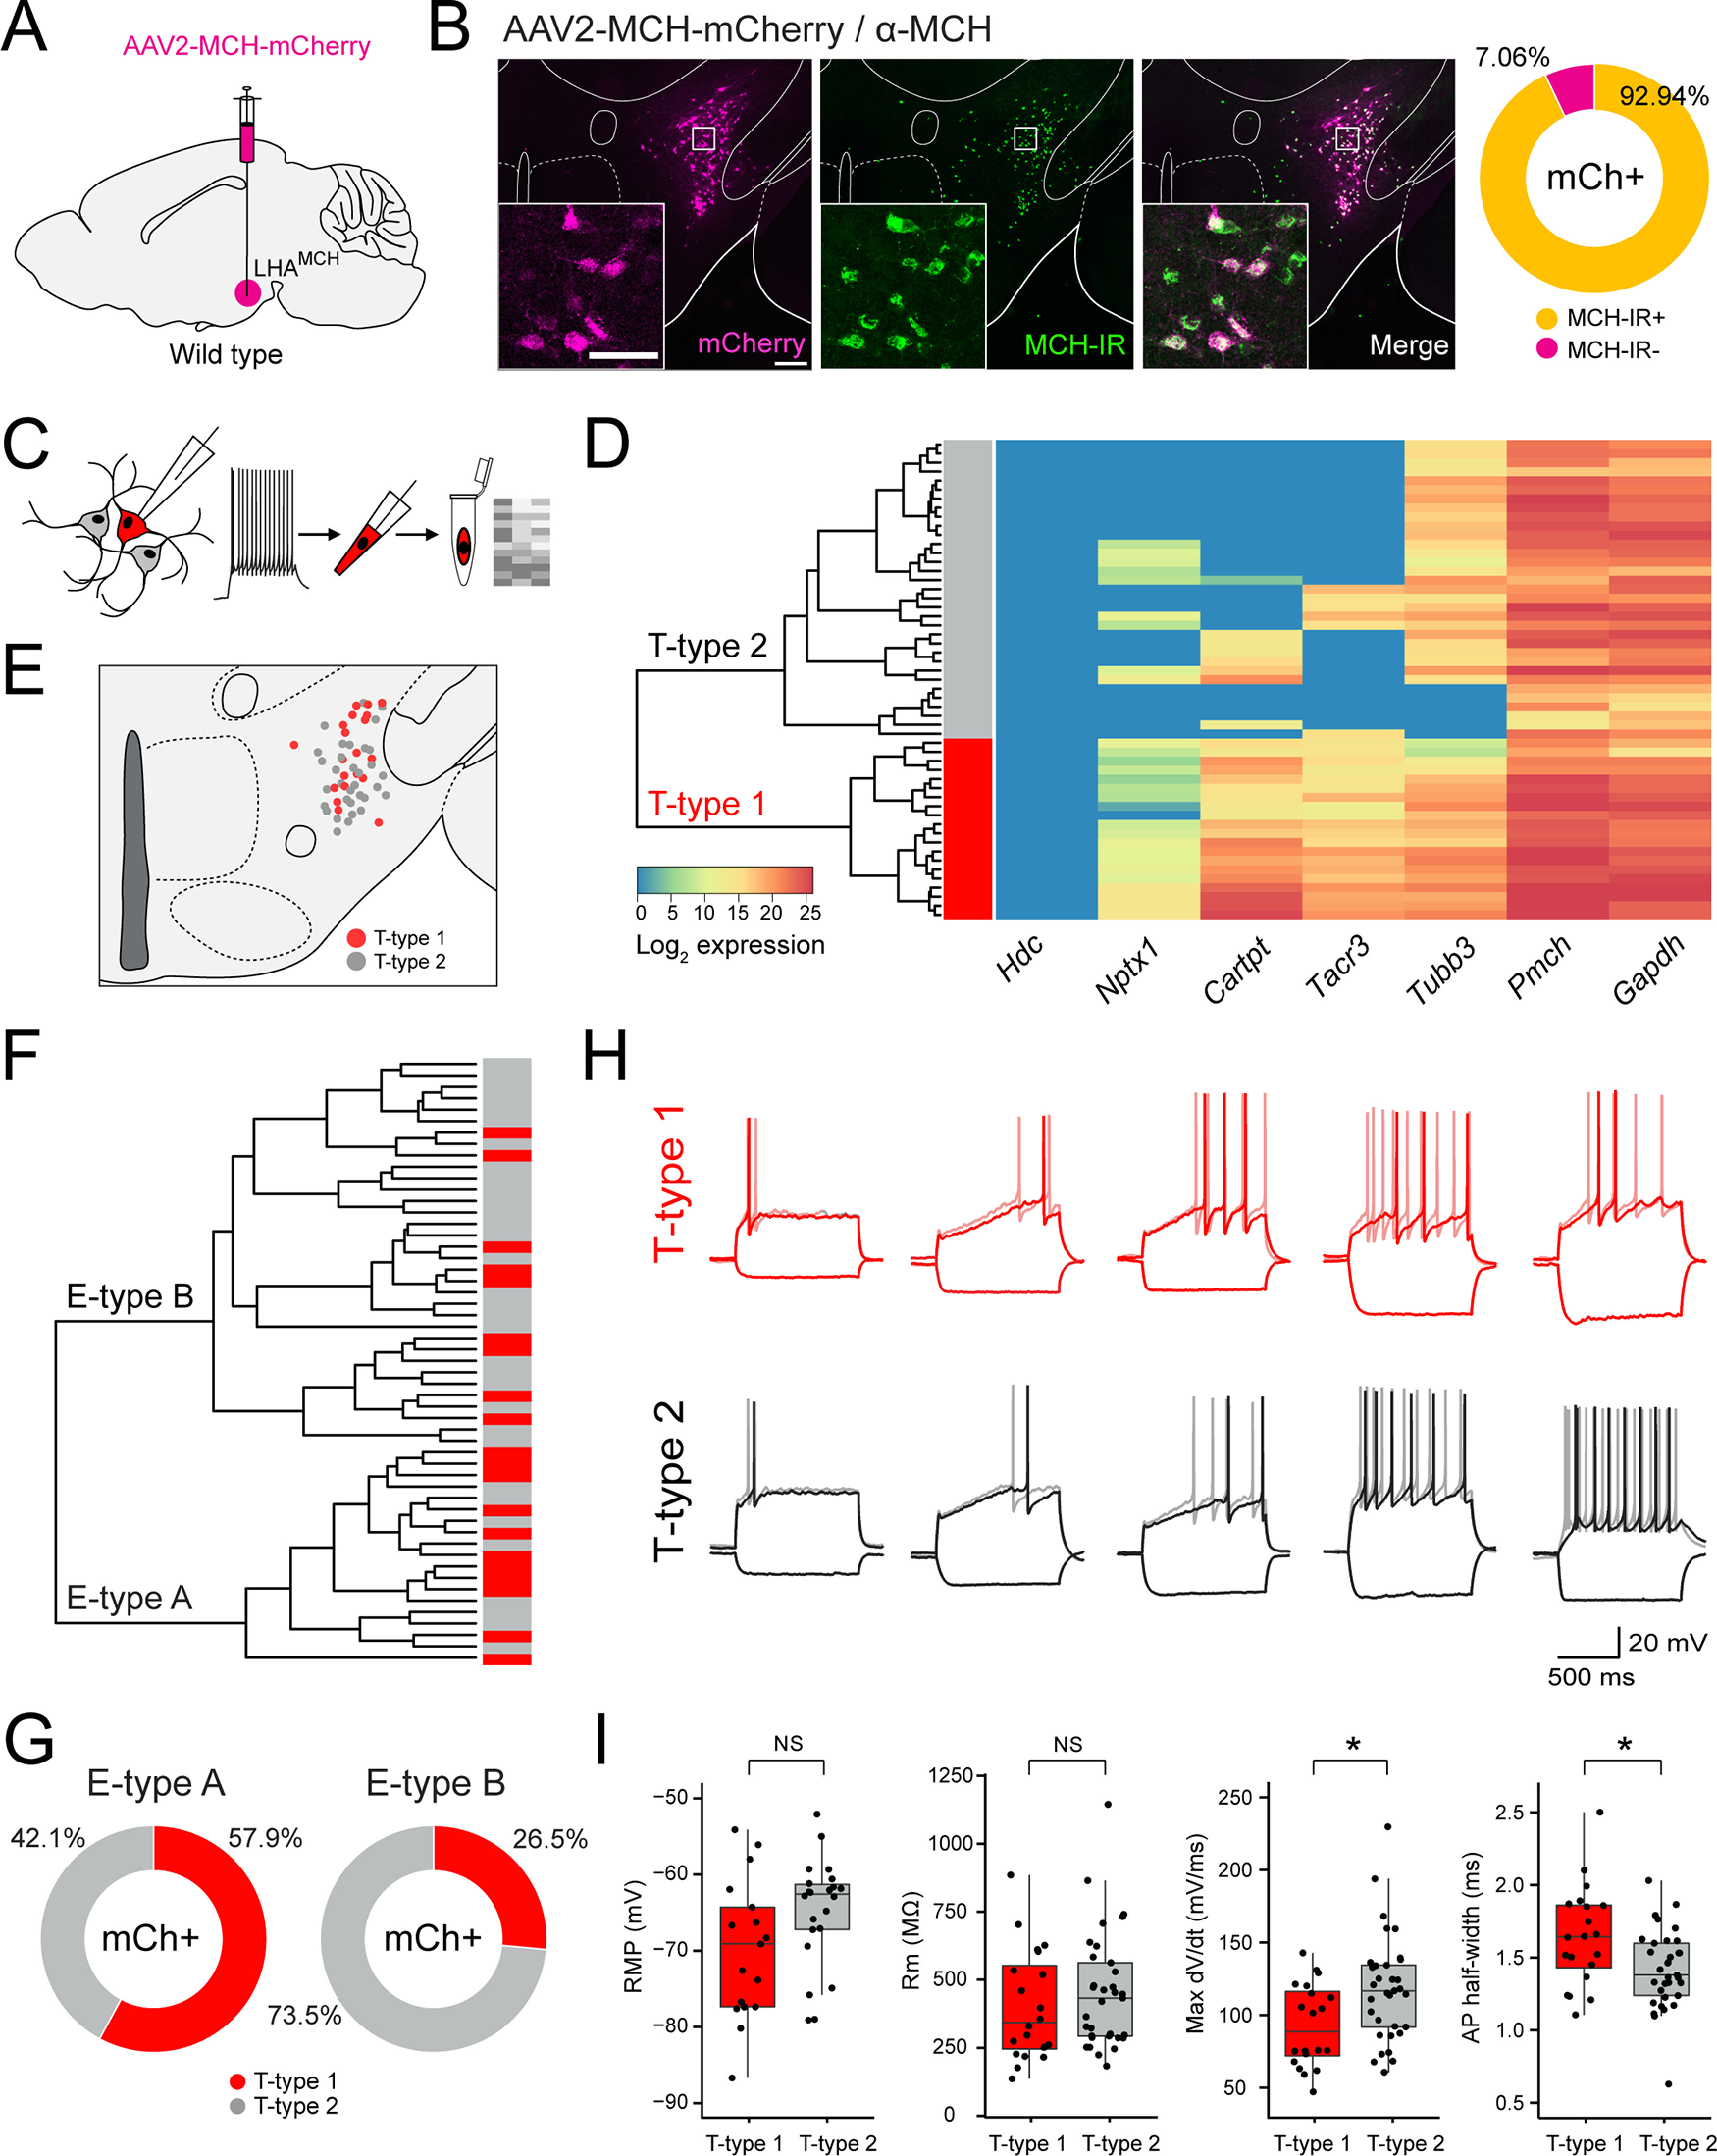
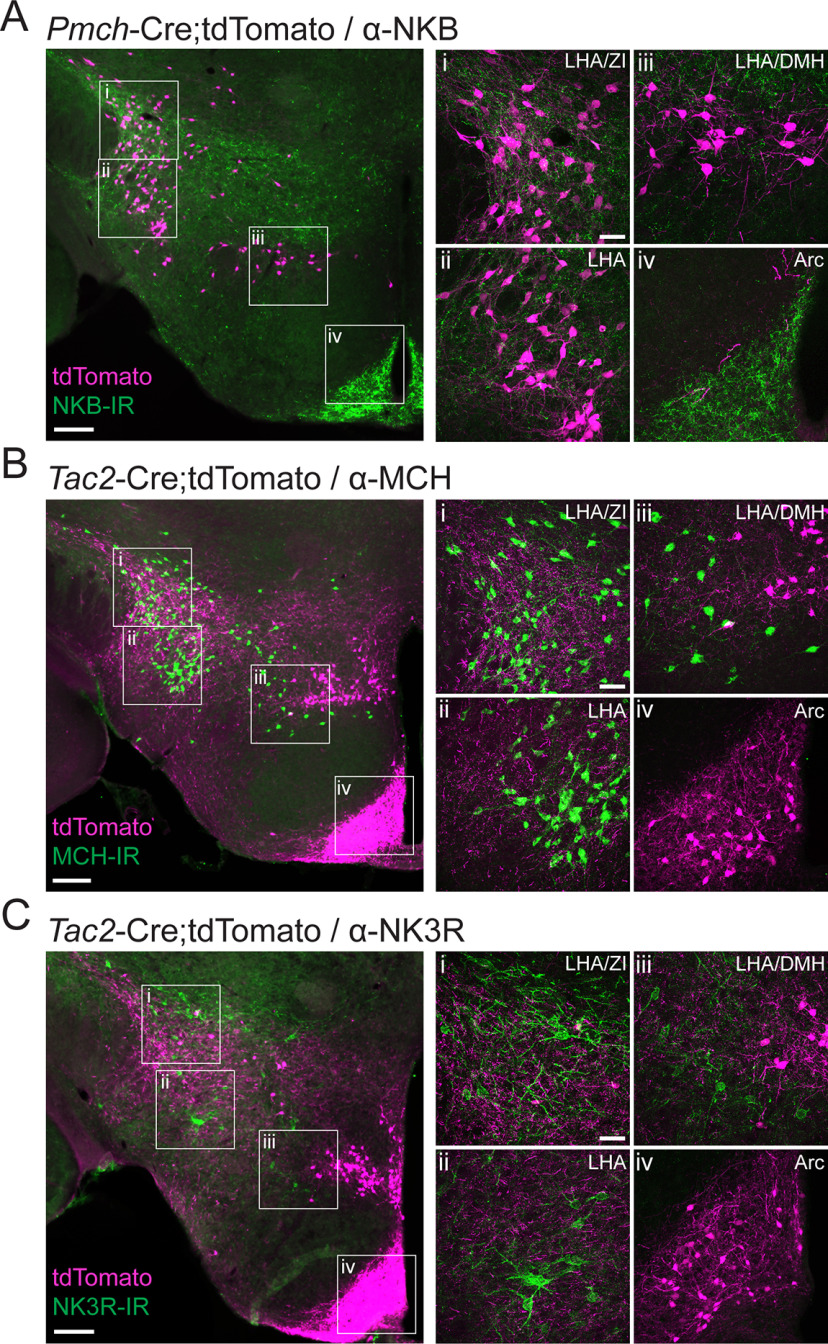
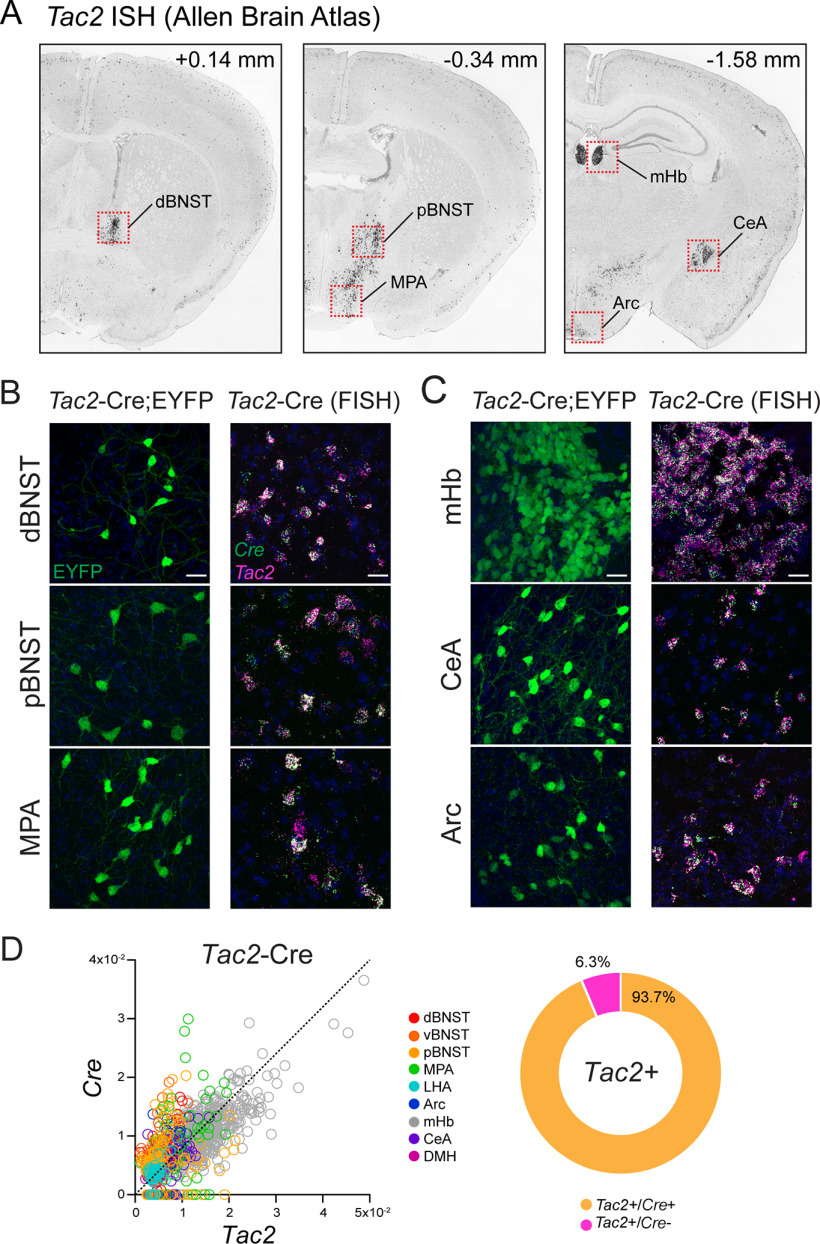
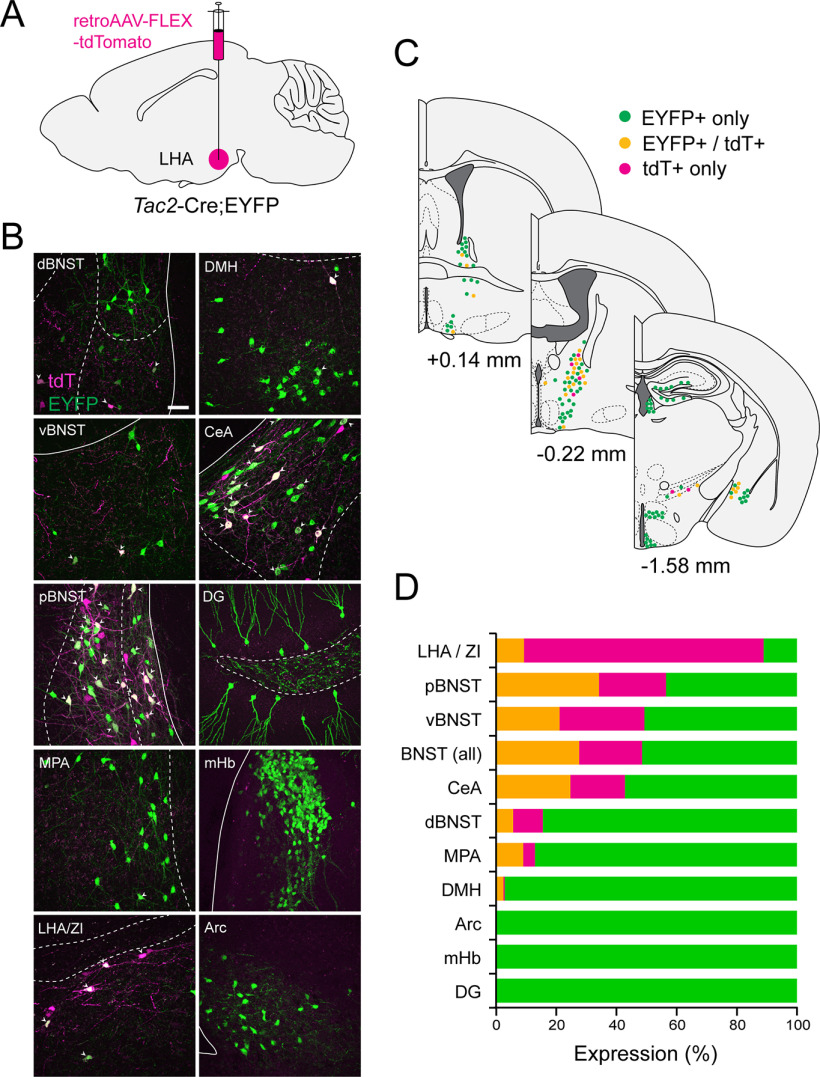
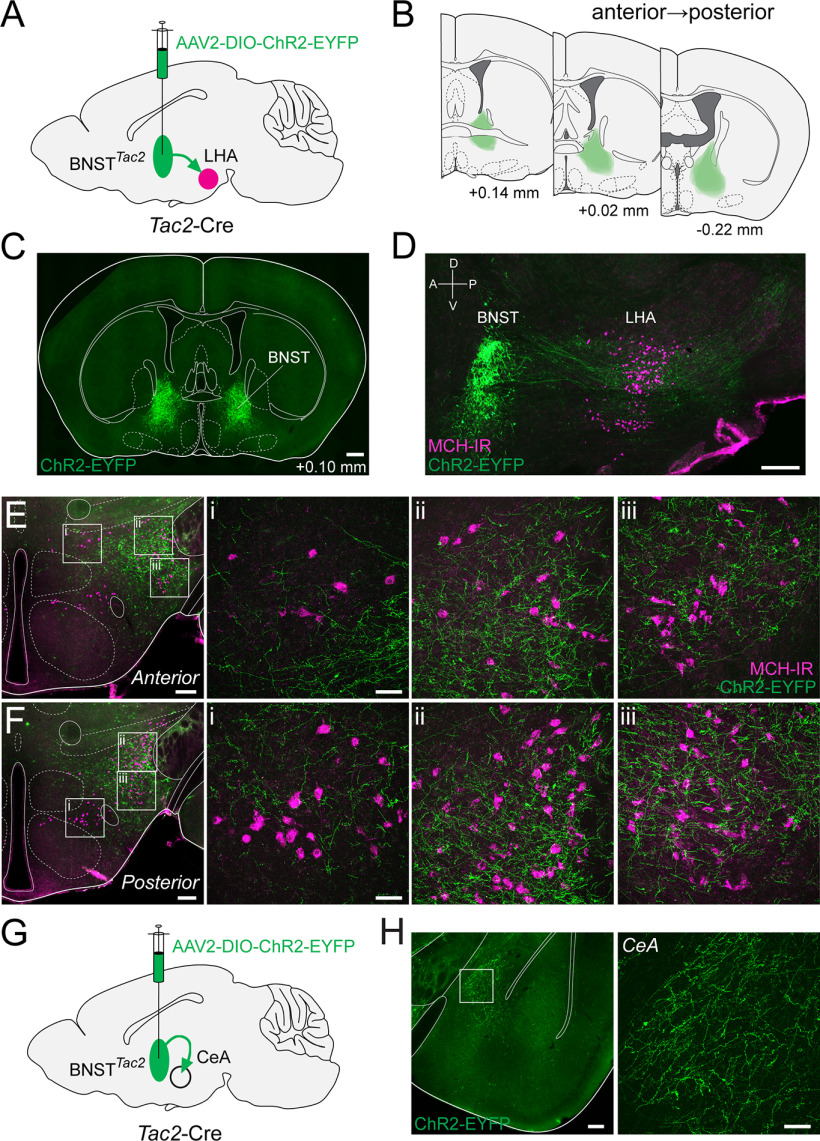
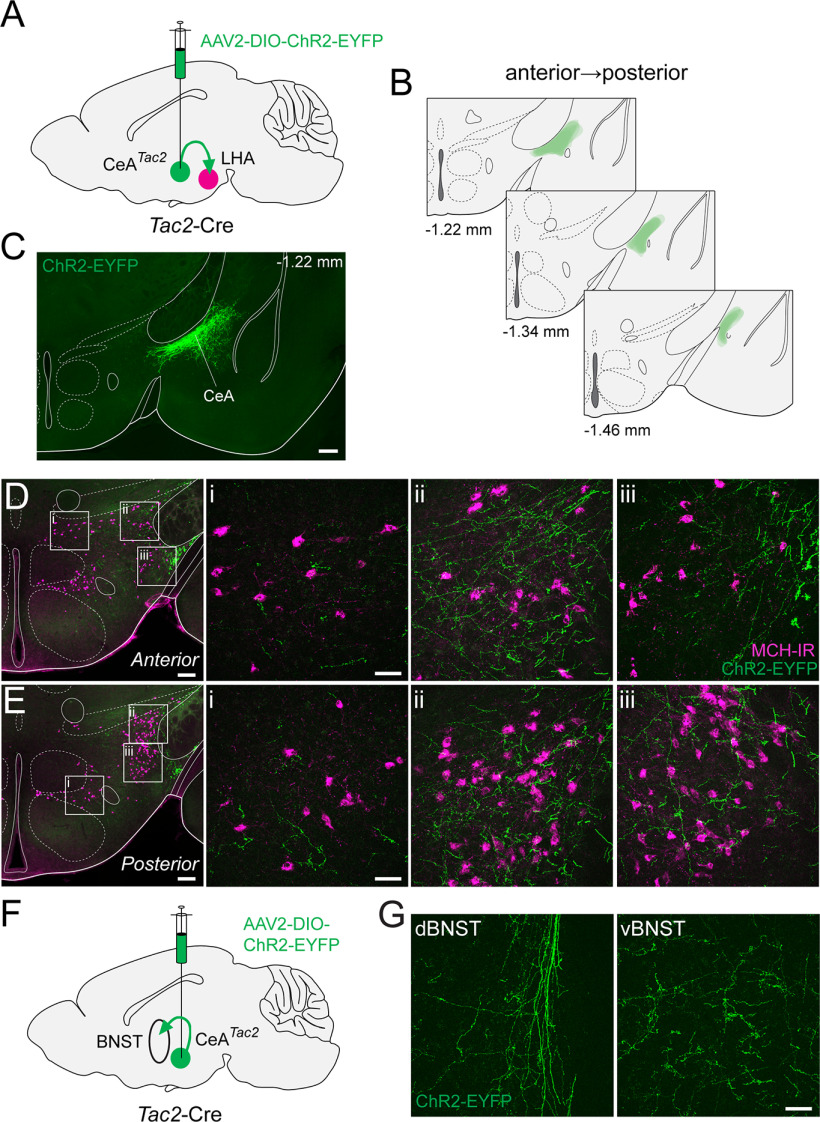
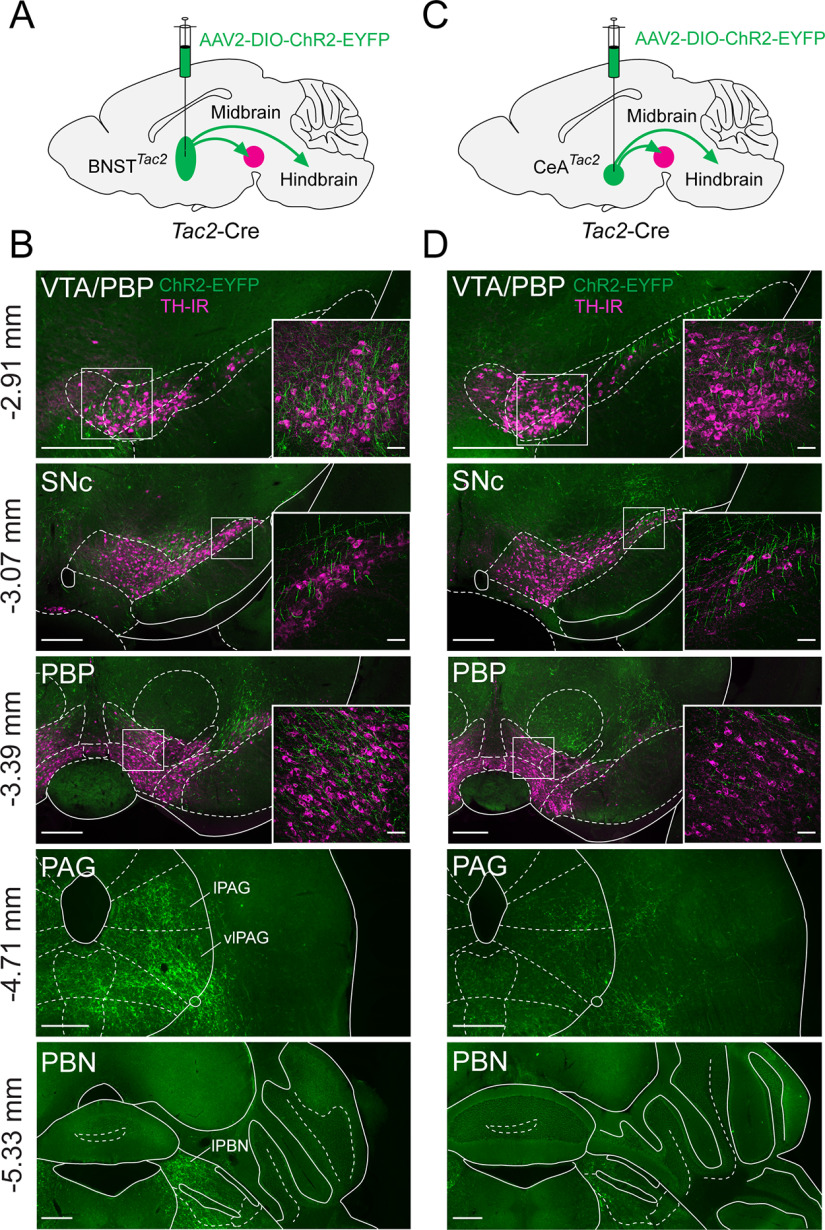
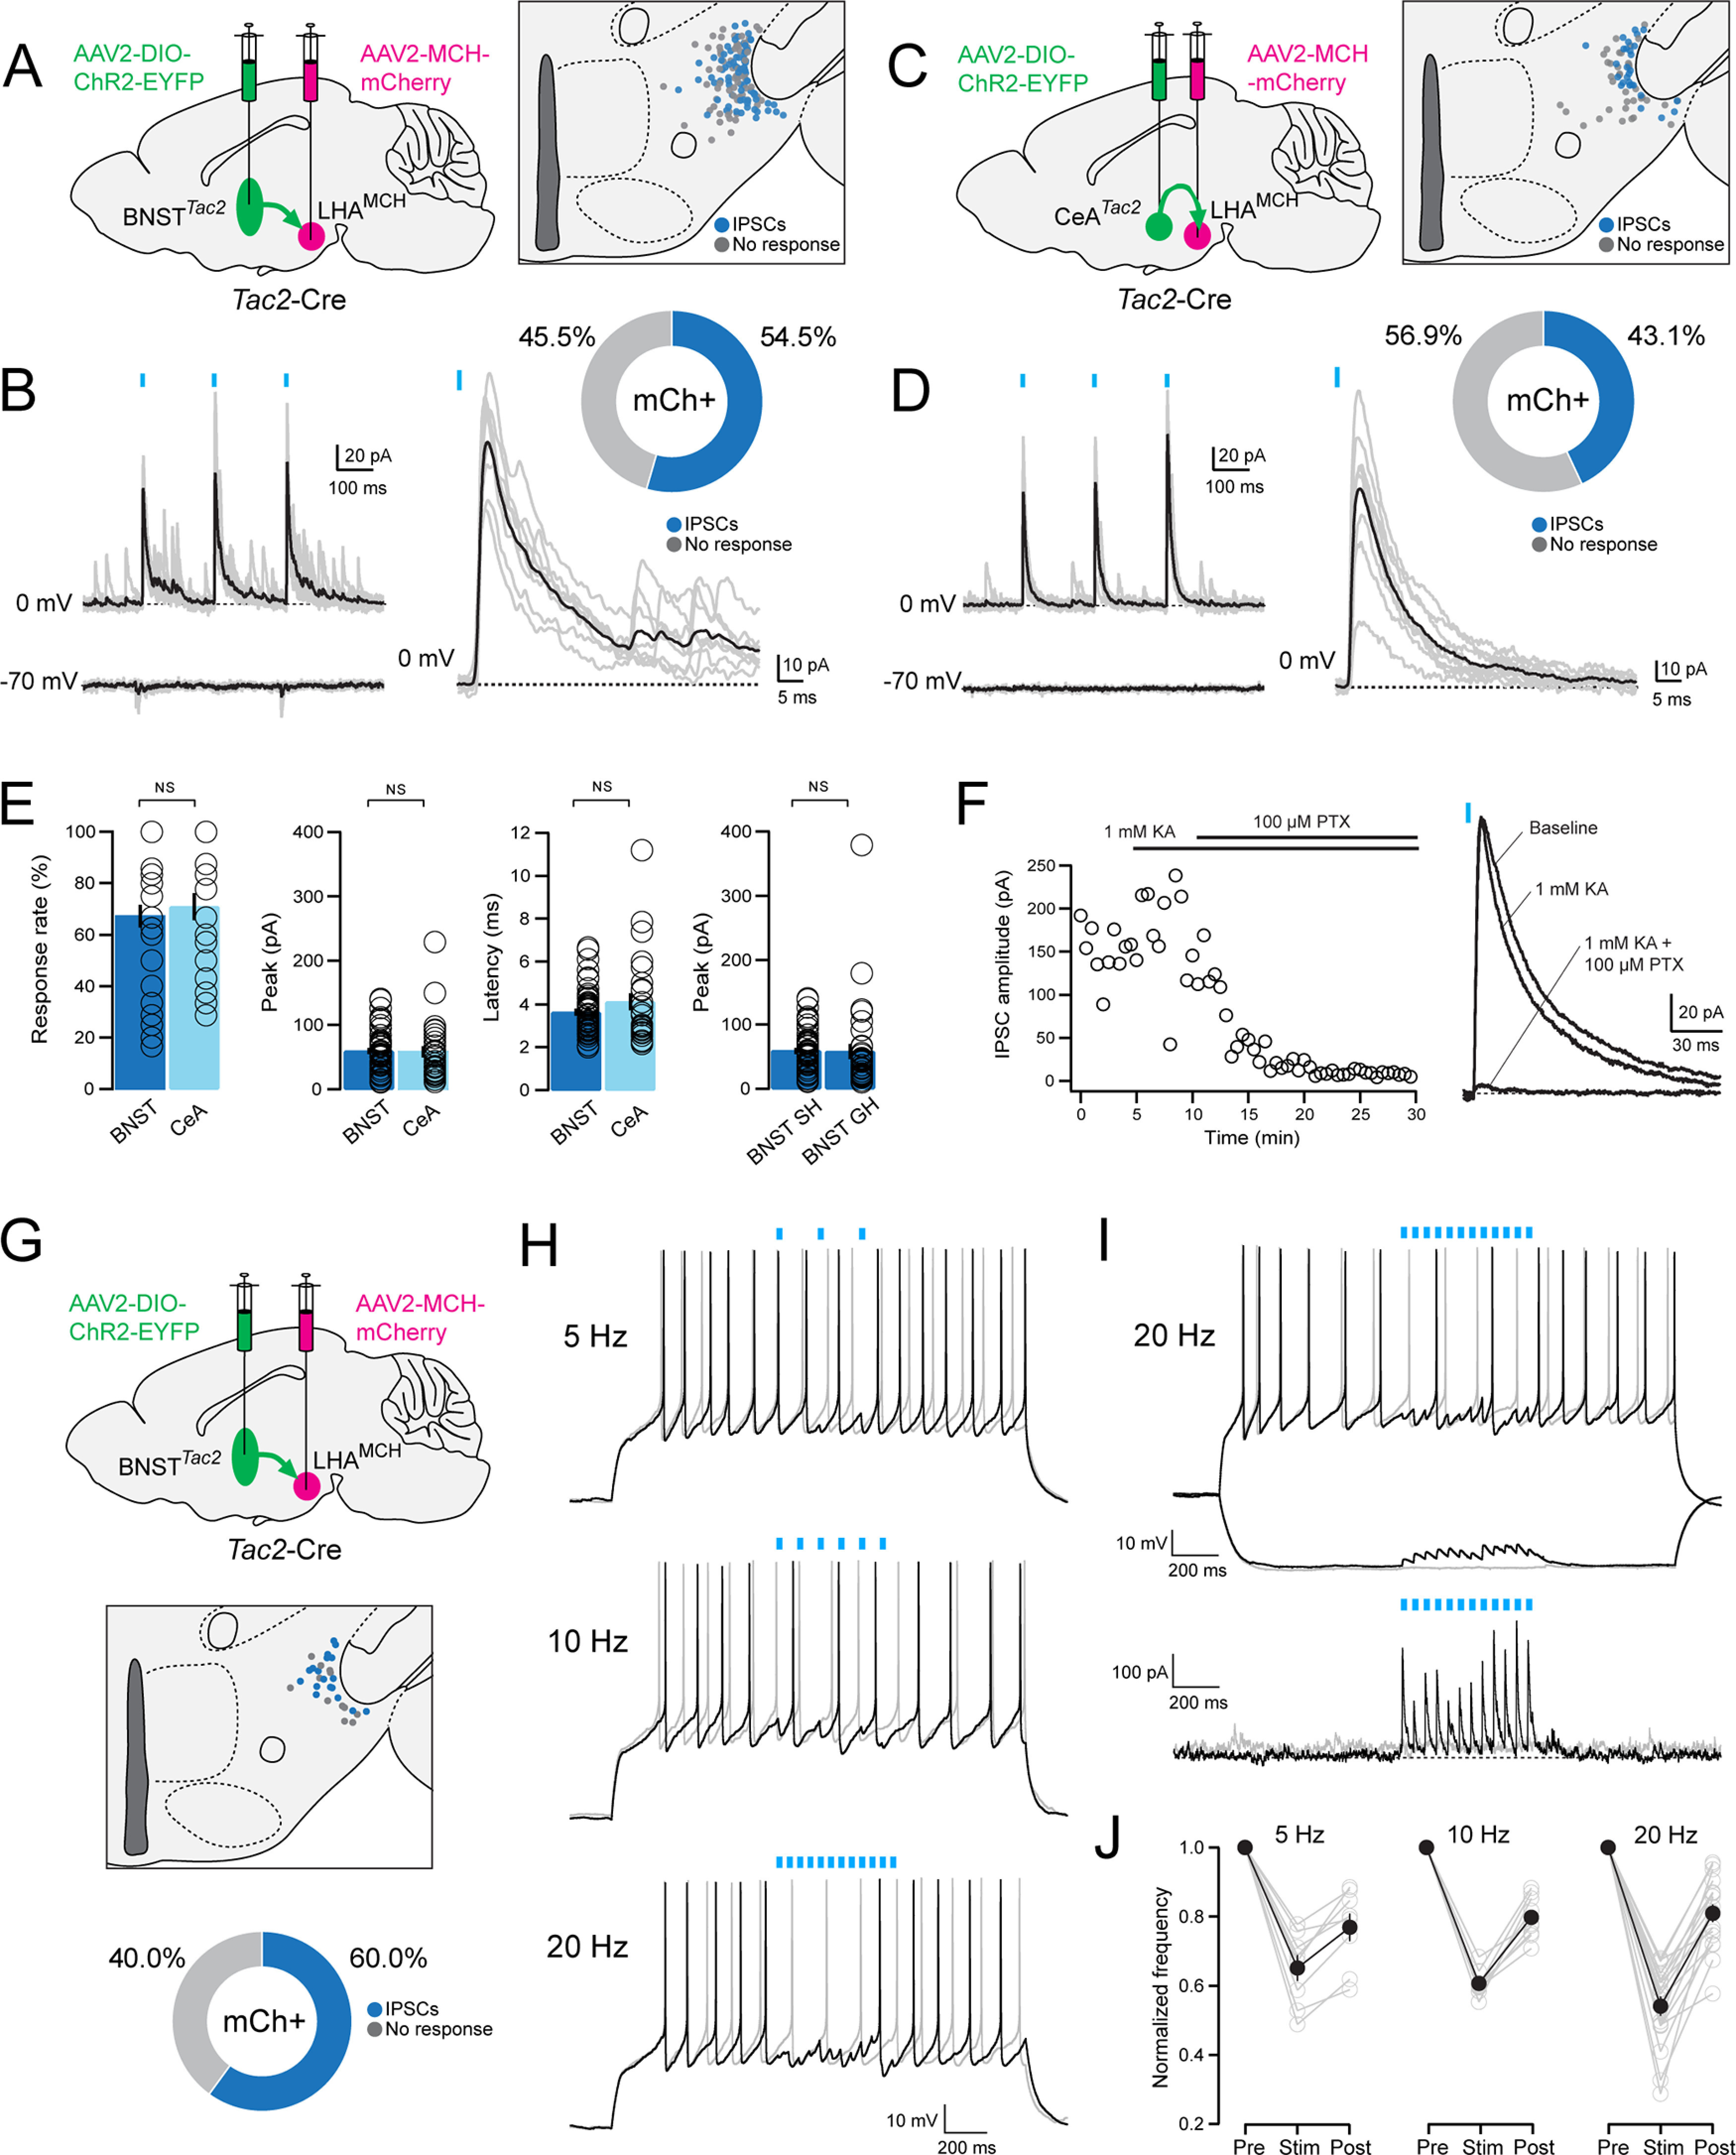
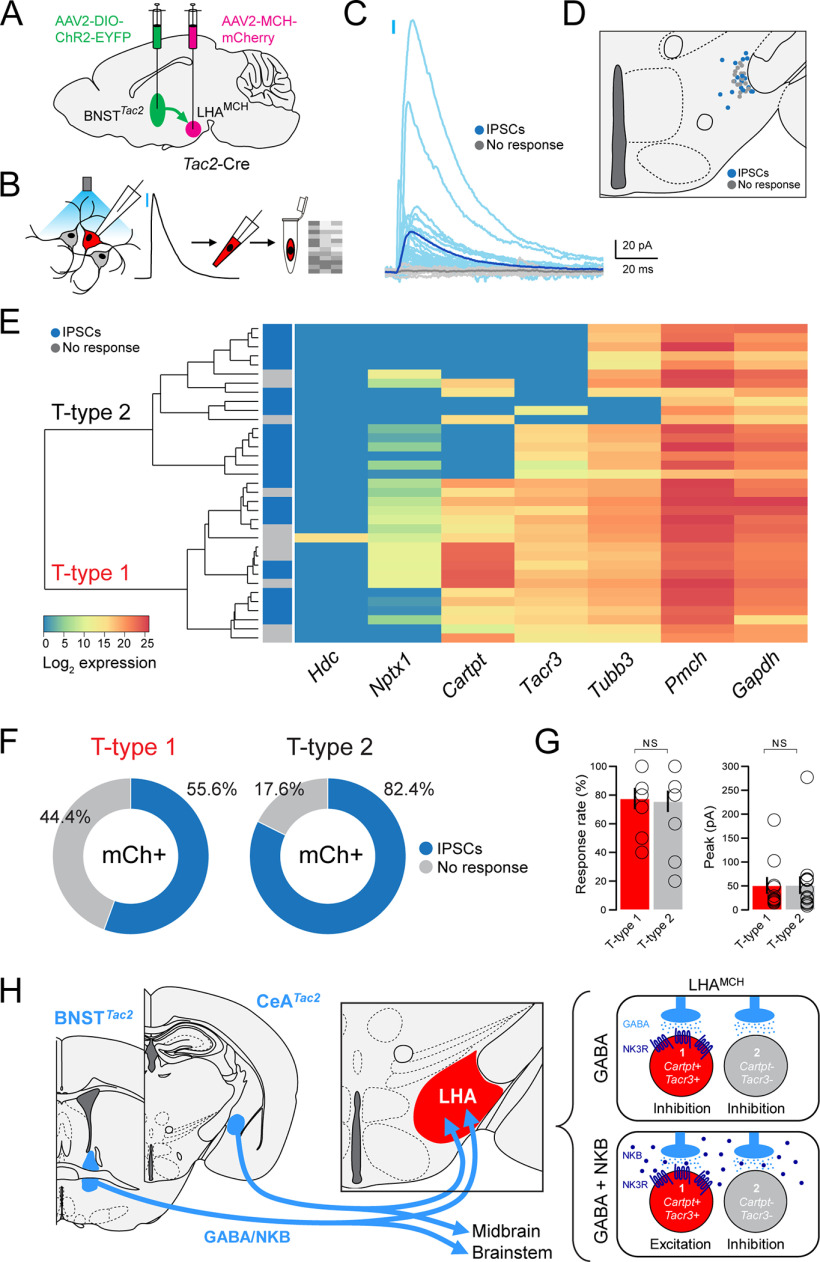
The lateral hypothalamic area (LHA) is a highly conserved brain region critical for maintaining physiological homeostasis and goal-directed behavior. LHA neurons that express melanin-concentrating hormone (MCH) are key regulators of arousal, energy balance, and motivated behavior. However, cellular and functional diversity among LHAMCH neurons is not well understood. Previous anatomic and molecular data suggest that LHAMCH neurons may be parsed into at least two distinct subpopulations, one of which is enriched in neurokinin-3 receptor (NK3R), the receptor for neurokinin B (NKB), encoded by the Tac2 gene. This tachykininergic ligand-receptor system has been implicated in reproduction, fear memory, and stress in other brain regions, but NKB interactions with LHAMCH neurons are poorly understood. We first identified how LHAMCH subpopulations may be distinguished anatomically and electrophysiologically. To dissect functional connectivity between NKB-expressing neurons and LHAMCH neurons, we used Cre-dependent retrograde and anterograde viral tracing in male Tac2-Cre mice and identified Tac2/EYFP+ neurons in the bed nucleus of the stria terminalis and central nucleus of the amygdala, the central extended amygdala, as major sources of NKB input onto LHAMCH neurons. In addition to innervating the LHA, these limbic forebrain NKB neurons also project to midbrain and brainstem targets. Finally, using a dual-virus approach, we found that optogenetic activation of these inputs in slices evokes GABA release onto a subset of LHAMCH neurons but lacked specificity for the NK3R+ subpopulation. Overall, these data define parallel tachykininergic/GABAergic limbic forebrain projections that are positioned to modulate multiple nodes of homeostatic and behavioral control.SIGNIFICANCE STATEMENT The LHA orchestrates fundamental behavioral states in the mammalian hypothalamus, including arousal, energy balance, memory, stress, and motivated behavior. The neuropeptide MCH defines one prominent population of LHA neurons, with multiple roles in the regulation of homeostatic behavior. Outstanding questions remain concerning the upstream inputs that control MCH neurons. We sought to define neurochemically distinct pathways in the mouse brain that may communicate with specific MCH neuron subpopulations using viral-based retrograde and anterograde neural pathway tracing and optogenetics in brain slices. Here, we identify a specific neuropeptide-defined forebrain circuit that makes functional synaptic connections with MCH neuron subpopulations. This work lays the foundation for further manipulating molecularly distinct neural circuits that modulate innate behavioral states.

Keywords: bed nucleus of the stria terminalis; central nucleus of the amygdala; lateral hypothalamic area; melanin-concentrating hormone; neurokinin B; neurokinin-3 receptor.


Figures

Figure 1.
Figure 1.
Coexpression of Cartpt and Tacr3 in a subpopulation of Pmch+ neurons. A, Pmch-expressing neuronal cluster (red) visualized on a t-SNE plot after scRNA-seq of the LHA (n = 3589 cells, 5 mice) and corresponding heatmap displaying normalized, natural-log transformed expression of marker genes that distinguish two subpopulations of Pmch+ neurons (n = 119 cells, 5 mice), using published scRNA-seq data (Mickelsen et al., 2019). B, Scatter plot showing normalized, natural-log transformed expression of Tacr3 and Cartpt in 119 Pmch+ neurons (left) using data from Mickelsen et al. (2019). Donut plot showing binarized representation of the scatter plot data with positive (+) expression of either gene corresponds to detection of more than zero transcripts of that gene (right). C, Confocal micrographs (40×) showing the expression of Pmch (green), Cartpt (orange), and Tacr3 (magenta) and merged expression (left). White arrows indicate cells that coexpress Pmch, Cartpt, and Tacr3. Scale bar, 50 µm. Higher magnification confocal micrograph (100×, right) of the boxed region, showing a cell that coexpresses Pmch, Cartpt, and Tacr3 (white arrow), next to a cell that expresses Pmch alone. Scale bar, 15 µm. D, Scatter plot (left) and corresponding donut plot (right) quantifying the mean intensity and proportion of Tacr3 and Cartpt expression in Pmch+ cells (n = 342 cells, 2 mice). E, Representative confocal micrographs (40×) of the LHA showing expression of tdT (magenta), NK3R-IR (green), and merge in Pmch-Cre;tdTomato mice with the boxed region enlarged. Scale bars: 50 µm. Corresponding donut plot (right) depicting the proportion of tdT+ and NK3R-IR cells in Pmch-Cre;tdT mice (n = 729 cells, 3 mice). F, Representative traces of whole-cell recordings from a tdT+ neuron in a Pmch-Cre;tdT mouse held at −85 mV with 1 s of current injection (−120 pA, +40 pA, +120 pA, left). Bar plot displaying RMP values of silent tdT+ and EYFP+ neurons (n = 53/81 cells, 10 mice), with individual values (right). Error bars represent ± SEM. G, Representative current-clamp traces from tdT+ neurons held at −85 mV in Pmch-Cre;tdT mice (left) showing differential responses to local puff application of senktide (red line, 500 nm); depolarization to threshold (top), subthreshold depolarization (middle), and no response (bottom). Corresponding donut plot (right) showing differential responses to either 100 nm or 500 nm senktide (n = 35 cells, 9 mice).
Figure 2.
Figure 2.
Defining LHAMCH subpopulations through molecular markers and electrophysiological signatures. A, Diagram of the injection site in the LHA of wild-type mice, with AAV2-MCH-mCherry to visually identify LHAMCH neurons in slice recordings. B, Fluorescence micrographs (left) of a representative coronal section of the LHA showing expression of mCherry (magenta), MCH-IR (green), and merged. Scale bar, 200 µm. Insets, Confocal micrographs (40×) of the boxed regions. Scale bar, 80 µm. Donut plot (right) displaying the specificity (% mCherry+ cells that are MCH-IR) of the AAV-MCH-mCherry virus (n = 583 cells, 2 mice). C, Diagram of the electrophysiological recording and sc-qPCR procedure—current-clamp and voltage-clamp recordings from mCherry+ neurons, cytoplasm harvest, and sc-qPCR for key molecular markers. D, Dendrogram of unsupervised cluster analysis and corresponding heatmap of gene expression in recorded mCherry+ neurons (n = 53 cells, 5 mice). The two major clades are classified as transcriptomic T-type 1 (red) and T-type 2 (gray) based on the seven markers. E, Anatomical map of the LHA illustrating the location of the recorded mCherry+ neurons classified based on the transcriptomic type. F, Dendrogram of unsupervised cluster analysis based on the intrinsic membrane properties of recorded mCherry+ neurons. The two major clades are classified as electrophysiological E-type A and E-type B. The corresponding bar chart denotes the T-type (T-type1, red; T-type 2, gray). G, Donut plots depicting the proportion of T-type classified cells in E-type A and E-type B. H, Comparison of representative current-clamp traces among T-type 1 and T-type 2 cells at or near rheobase and a hyperpolarizing current step of −50 pA for 1 s. I, Box and whisker plots, with individual data points, of the RMP, Rm, max dV/dt, and AP half-width across T-type 1 and T-type 2 cells. Asterisks indicate statistical significance, *p < 0.05. NS, Not significant.
Figure 3.
Figure 3.
A subpopulation of LHAMCH neurons are innervated by NKB fibers. A, Fluorescence micrograph (10×) of a coronal section of the LHA immunostained with anti-NKB (green) in a Pmch-Cre;tdT (magenta) mouse with higher magnification confocal micrographs (40×) of the boxed regions (i–iv). B, Fluorescence micrograph (10×) of a coronal section of the LHA immunostained with anti-MCH (green) in a Tac2-Cre;tdT (magenta) mouse with higher magnification confocal micrographs (40×) of the boxed regions (i–iv). C, Fluorescence micrograph (10×) of a coronal section of the LHA immunostained with anti-NK3R (green) in a Tac2-Cre;tdT (magenta) mouse with higher magnification confocal micrographs (40×) of the boxed regions (i–iv). Scale bars: 200 µm, low-magnification images; 50 µm, high-magnification images (i–iv).
Figure 4.
Figure 4.
Validation of a Tac2-Cre mouse. A, Coronal sections showing Tac2 ISH expression in select brain regions from the Allen Mouse Brain Atlas (Lein et al., 2007). B, Confocal micrographs (40×) of the dBNST, pBNST, and MPA showing EYFP (green) expression in Tac2-Cre;EYFP mice and FISH expression for Tac2 (magenta) and Cre (green) in Tac2-Cre mice. Scale bars: 50 µm. C, Confocal micrographs (40×) of the mHb, CeA, and Arc showing EYFP (green) expression in Tac2-Cre;EYFP mice and FISH expression for Tac2 (magenta) and Cre (green) in Tac2-Cre mice. Scale bars: 50 µm. D, Scatter plot (left) showing mean intensity of Cre and Tac2 coexpression in single cells from Tac2-Cre mice, color coded for anatomic region (n = 1157 cells, 2 mice). Donut plot (right) showing proportion of Tac2+ cells that were Cre+ or Cre−. Note that there are no detectable Tac2−/Cre+ cells.
Figure 5.
Figure 5.
Retrograde tracing to determine sources of NKB innervation of the LHA. A, Diagram of the injection site with retroAAV-FLEX-tdTomato in the LHA of Tac2-Cre;EYFP mice. B, Confocal micrographs (40×) of select regions showing coexpression of EYFP (green) and tdT (magenta). Arrowheads indicate colocalization. Scale bar, 50 µm. C, Diagram illustrating the distribution of EYFP+, tdT+, and colocalized neurons at the following distances from bregma (in mm): +0.14, −0.22, −1.58. D, Bar plot showing quantified percentages of EYFP+ (green), tdT+ (magenta), and colocalized (yellow) expression across different brain regions (n = 4 mice).
Figure 6.
Figure 6.
Anterograde tracing from BNSTTac2 → LHAMCH. A, Diagram of the BNST injection site with AAV-DIO-ChR2-EYFP in Tac2-Cre mice. B, Overlay of the injection site (green) throughout the BNST from anterior to posterior at the following distances from bregma (in mm): +0.14, +0.02, −0.22 (n = 6 mice). C, Fluorescence micrograph (10×) of a representative coronal section showing ChR2-EYFP expression in the injection site in the BNST. Scale bar, 500 µm. D, Fluorescence micrograph (10×) of a representative parasagittal section showing the BNST injection site and descending projections (green) overlaid with immunostaining for anti-MCH (magenta) in the LHA. Scale bar, 100 µm. E, Fluorescence micrograph (10×) of ChR2-EYFP fibers and MCH immunostaining in a representative coronal section of the anterior LHA with confocal micrographs (40×) of the boxed regions (i–iii). Scale bar, 200 µm, low-magnification images; 50 µm, high-magnification images. F, Fluorescence micrograph (10×) of ChR2-EYFP fibers and MCH immunostaining in a representative coronal section of the posterior LHA with confocal micrographs (40×) of the boxed regions (i–iii). Scale bar, 200 µm, low-magnification images; 50 µm, high-magnification images. G, Diagram illustrating the BNST injection site and its projections to the CeA. H, Fluorescence micrograph (10×) of EYFP-expressing BNSTTac2 terminals in the CeA (left) with a confocal micrograph (40×) of the boxed region (right). Scale bar, 200 µm, low-magnification images; 50 µm, high-magnification images.
Figure 7.
Figure 7.
Anterograde tracing from CeATac2→ LHAMCH. A, Diagram of the CeA injection site with AAV-DIO-ChR2-EYFP in Tac2-Cre mice. B, Overlay of the injection site (green) throughout the CeA from anterior to posterior at the following distances from bregma (in mm): −1.22, −1.34, −1.46 (n = 4 mice). C, Fluorescence micrograph (10×) of a representative coronal section showing ChR2-EYFP expression of the injection site (green) in the CeA. Scale bar, 300 µm. D, Fluorescence micrograph (10×) of ChR2-EYFP fibers (green) and MCH immunostaining (magenta) in a representative coronal section of the anterior LHA with confocal micrographs (40×) of the boxed regions (i–iii). Scale bars: 200 µm, low-magnification images; 50 µm, high-magnification images. E, Fluorescence micrograph (10×) of ChR2-EYFP fibers and MCH immunostaining in a representative coronal section of the posterior LHA with confocal micrographs (40×) of the boxed regions (i–iii). Scale bars: 200 µm, low-magnification images; 50 µm, high-magnification images. F, Diagram illustrating the CeA injection site and its projections to the BNST in Tac2-Cre mice. G, Confocal micrograph (40×) of the EYFP-expressing CeATac2 terminals in the dBNST (left) and vBNST (right). Scale bar, 50 µm.
Figure 8.
Figure 8.
BNSTTac2 and CeATac2 projections to the midbrain and brainstem. A, Diagram of the BNST injection site and projections with AAV-DIO-ChR2-EYFP in Tac2-Cre mice. B, Fluorescence micrographs (10×) of ChR2-EYFP fibers (green) in the VTA/PBP, SNc, PBP, PAG, and PBN with the top three regions immunostained for anti-TH (magenta). Insets, Confocal micrographs (40×) of the boxed regions. C, Diagram of the CeA injection site and projections with AAV-DIO-ChR2-EYFP in Tac2-Cre mice. D, Fluorescence micrographs (10×) of ChR2-EYFP fibers in the VTA/PBP, SNc, PBP, PAG, and PBN with the top three regions immunostained for anti-TH. Insets, Confocal micrographs (40×) of the boxed regions. Scale bars: 400 µm, low-magnification images; 50 µm, high-magnification images. lPBN, lateral parabrachial nucleus.
Figure 9.
Figure 9.
Functional connectivity between BNSTTac2/CeATac2 neurons and LHAMCH neurons. A, Diagram illustrating dual, bilateral stereotactic injections in a Tac2-Cre mouse with AAV-DIO-ChR2-EYFP in the BNST and AAV-MCH-mCherry in the LHA (left). Anatomical map of the LHA illustrating the location of the recorded mCherry+ neurons classified based on the response to the photostimulation (gray, no response; blue, evoked IPSCs; n = 145 cells, 10 mice; right). B, Overlay of average (black) and individual (gray) filtered traces of a representative photostimulated (blue lines) mCherry+ neuron held at 0 mV (top) and −70 mV (bottom, left). Magnified view of the evoked IPSC at the first pulse (blue line) held at 0 mV from the same mCherry+ neuron (bottom) and a corresponding donut plot illustrating the responses of all recorded mCherry+ neurons (top). C, Diagram illustrating dual, bilateral stereotactic injections in a Tac2-Cre mouse with AAV-DIO-ChR2-EYFP in the CeA and AAV-MCH-mCherry in the LHA (left). Anatomical map of the LHA illustrating the location of the recorded mCherry+ neurons classified based on the response to the photostimulation (gray, no response; blue, evoked IPSCs; n = 65 cells, 4 mice; right). D, Overlay of average (black) and individual (gray) filtered traces of a representative photostimulated (blue lines) mCherry+ neuron held at 0 mV (top) and −70 mV (bottom; left). Magnified view of the evoked IPSC at the first pulse (blue line) held at 0 mV from the same mCherry+ neuron (bottom) and a corresponding donut plot illustrating the responses of all recorded mCherry+ neurons (top). E, Bar plots quantifying (left to right) the response rate (%), peak amplitude (pA), and latency (ms) of recorded mCherry+ neurons with photostimulation of BNSTTac2 (dark blue; n = 95 cells, 6 mice) or CeATac2 terminals (light blue; n = 65 cells, 4 mice; Mann–Whitney test; response rate, p = 0.536; peak amplitude, p = 0.461; latency, p = 0.721). Bar plot quantifying the peak amplitude of recorded mCherry+ neurons with photostimulation of BNSTTac2 terminals between group housed (GH; n = 50 cells, 4 mice) and singly housed mice (SH; n = 95 cells, 6 mice; Mann–Whitney test; p = 0.0653; far right). F, Plot displaying the IPSC amplitude (pA) of a representative mCherry+ neuron during baseline, followed by application of KA (1 mm) and PTX (100 μm; left) and the corresponding overlay of the average traces from each condition (right). G, Diagram illustrating dual, bilateral stereotactic injections in a Tac2-Cre mouse with AAV-DIO-ChR2-EYFP in the BNST and AAV-MCH-mCherry in the LHA (top). Anatomical map of the LHA illustrating the location of the recorded mCherry+ neurons classified based on the response to the photostimulation (gray, no response; blue, evoked IPSCs; n = 30 cells, 3 mice; middle). Donut plot depicting the responses of all recorded mCherry+ neurons (bottom). H, Representative current-clamp traces of a recorded mCherry+ neuron without (light gray) and with (black) 5, 10, and 20 Hz photostimulation (blue lines) in conjunction with a depolarizing step. I, Representative current-clamp traces of a recorded mCherry+ neuron without (light gray) and with (black) 20 Hz photostimulation (blue lines) during a depolarizing and hyperpolarizing step (top). Corresponding voltage-clamp trace in the same cell without (light gray) and with (black) 20 Hz photostimulation (blue lines). J, Plot of the averaged normalized frequency before (pre), during (stim), and after (post) photostimulation at varying frequencies of every recorded mCherry+ neuron (light gray) and the average of each frequency group overlaid (black).
Figure 10.
Figure 10.
Assessment of the specificity of BNSTTac2 GABAergic inputs onto transcriptionally distinct LHAMCH neuron subpopulations. A, Diagram illustrating dual, bilateral stereotactic injections in a Tac2-Cre mouse with AAV-DIO-ChR2-EYFP in the BNST and AAV-MCH-mCherry in the LHA (top). B, Diagram of optogenetic stimulation and sc-qPCR procedure—voltage-clamp recording from mCherry+ cells, photostimulation to evoke IPSCs, cytoplasm harvest, and sc-qPCR for key molecular markers. C, Overlay of the averaged trace of every photostimulated mCherry+ neuron classified based on the response (light gray, no response; light blue, evoked IPSCs) with the average of each response group overlaid (gray, no response; dark blue, evoked IPSCs). D, Anatomical map of the LHA illustrating the location of the recorded mCherry+ neurons classified based on the response to the photostimulation (gray, no response; blue, evoked IPSCs; n = 35 cells, 5 mice). E, Dendrogram of unsupervised cluster analysis and corresponding heatmap of gene expression in recorded mCherry+ neurons following photostimulation. The two major clades are transcriptomic T-type 1 and T-type 2 based on the seven markers. Photostimulation-evoked IPSCs are indicated for each cell (gray, no response; blue, evoked IPSC). F, Donut plots depicting the proportion of responses to the photostimulation in mCherry+ neurons that are either T-type 1 (left, n = 18 cells) or T-type 2 (right, n = 17 cells). G, Bar plots quantifying (left to right) the response rate (%) and peak amplitude (pA) of IPSCs in recorded mCherry+ neurons with photostimulation of BNSTTac2 terminals on T-type 1 (red; 10 cells) or T-type 2 (gray; 14 cells) LHAMCH neurons. (Mann–Whitney test; response rate, p = 0.9519; peak amplitude, p = 0.7961). H, Diagram illustrating key findings. BNSTTac2 and CeATac2 neuron projections converge on the LHA, as well as projecting to midbrain and brainstem targets (left). GABAergic innervation of both LHAMCH subpopulations results in fast synaptic inhibition (top), whereas hypothetical cotransmission of GABA and NKB (bottom) would be predicted to result in excitation of the NK3R+ LHAMCH subpopulation alone (right).

Similar articles

Cited by

References

    1. Andero R, Dias BG, Ressler KJ (2014) A role for Tac2, NkB, and Nk3 receptor in normal and dysregulated fear memory consolidation. Neuron 83:444–454. 10.1016/j.neuron.2014.05.028 - DOI - PMC - PubMed
    1. Andero R, Daniel S, Guo JD, Bruner RC, Seth S, Marvar PJ, Rainnie D, Ressler KJ (2016) Amygdala-dependent molecular mechanisms of the Tac2 pathway in fear learning. Neuropsychopharmacology 41:2714–2722. 10.1038/npp.2016.77 - DOI - PMC - PubMed
    1. Apergis-Schoute J, Iordanidou P, Faure C, Jego S, Schone C, Aitta-Aho T, Adamantidis A, Burdakov D (2015) Optogenetic evidence for inhibitory signaling from orexin to MCH neurons via local microcircuits. J Neurosci 35:5435–5441. 10.1523/JNEUROSCI.5269-14.2015 - DOI - PMC - PubMed
    1. Arrigoni E, Saper CB (2014) What optogenetic stimulation is telling us (and failing to tell us) about fast neurotransmitters and neuromodulators in brain circuits for wake-sleep regulation. Curr Opin Neurobiol 29:165–171. 10.1016/j.conb.2014.07.016 - DOI - PMC - PubMed
    1. Arrigoni E, Chee MJS, Fuller PM (2019) To eat or to sleep: that is a lateral hypothalamic question. Neuropharmacology 154:34–49. 10.1016/j.neuropharm.2018.11.017 - DOI - PubMed

Publication types

LinkOut - more resources