. 2021 Nov 10;41(45):9466-9481.
doi: 10.1523/JNEUROSCI.0556-21.2021. Epub 2021 Oct 12.

Schizophrenia-Linked Protein tSNARE1 Regulates Endosomal Trafficking in Cortical Neurons

Affiliations

Schizophrenia-Linked Protein tSNARE1 Regulates Endosomal Trafficking in Cortical Neurons

Melissa Plooster et al. J Neurosci. .

Abstract

TSNARE1, which encodes the protein tSNARE1, is a high-confidence gene candidate for schizophrenia risk, but nothing is known about its cellular or physiological function. We identified the major gene products of TSNARE1 and their cytoplasmic localization and function in endosomal trafficking in cortical neurons. We validated three primary isoforms of TSNARE1 expressed in human brain, all of which encode a syntaxin-like Qa SNARE domain. RNA-sequencing data from adult and fetal human brain suggested that the majority of tSNARE1 lacks a transmembrane domain that is thought to be necessary for membrane fusion. Biochemical data demonstrate that tSNARE1 can compete with Stx12 for incorporation into an endosomal SNARE complex, supporting its possible role as an inhibitory SNARE. Live-cell imaging in cortical neurons from mice of both sexes demonstrated that brain tSNARE1 isoforms localized to the endosomal network. The most abundant brain isoform, tSNARE1c, localized most frequently to Rab7+ late endosomes, and endogenous tSNARE1 displayed a similar localization in human neural progenitor cells and neuroblastoma cells. In mature rat neurons from both sexes, tSNARE1 localized to the dendritic shaft and dendritic spines, supporting a role for tSNARE1 at the postsynapse. Expression of either tSNARE1b or tSNARE1c, which differ only in their inclusion or exclusion of an Myb-like domain, delayed the trafficking of the dendritic endosomal cargo Nsg1 into late endosomal and lysosomal compartments. These data suggest that tSNARE1 regulates endosomal trafficking in cortical neurons, likely by negatively regulating early endosomal to late endosomal trafficking.SIGNIFICANCE STATEMENT Schizophrenia is a severe and polygenic neuropsychiatric disorder. Understanding the functions of high-confidence candidate genes is critical toward understanding how their dysfunction contributes to schizophrenia pathogenesis. TSNARE1 is one of the high-confidence candidate genes for schizophrenia risk, yet nothing was known about its cellular or physiological function. Here we describe the major isoforms of TSNARE1 and their cytoplasmic localization and function in the endosomal network in cortical neurons. Our results are consistent with the hypothesis that the majority of brain tSNARE1 acts as a negative regulator to endolysosomal trafficking.

Keywords: GWAS; SNARE; endocytosis; late endosome; schizophrenia.


Figures

Figure 1.
Figure 1.
TSNARE1 is a high-confidence candidate gene for schizophrenia risk. The association between TSNARE1 and schizophrenia is supported by eQTL and Hi-C data. Hi-C –log10 (P-val) denotes the significance of interaction between schizophrenia GWS locus (highlighted in green) and each neighboring bin. Blue represents the TSNARE1 promoter region. LD, Linkage disequilibrium; TAD, topologically associating domain.
Figure 2.
Figure 2.
TSNARE1 gene expression is enriched in the cortex and in neurons. a, GTEx brain RNA-seq data as plotted for transcripts per million bases (TPM) for TSNARE1. ACC, Anterior cingulate cortex; CBH, cerebellar hemisphere. b, Heat map of mean TSNARE1 expression in brain structures in both the fetal (left) and adult (right) human brain. ACx, Allocortex; AMY, amygdaloid complex; BF, basal forebrain; BN, basal nuclei; CBC, cerebellar cortex; Cla, claustrum; CP, cortical plate; EXA, extended amygdala; HTH, hypothalamus; IZ, intermediate zone; MTc, midbrain tectum; MTg, midbrain tegmentum; MZ, marginal zone; NP, neural plate; PACx, periallocortex; PnTg, pontine tegmentum; PTR, pretectal region; SG, subpial granular zone; SP, subplate zone; SubTH, subthalamus; SZ, subventricular zone; THM, thalamus; VZ, ventricular zone. c, Heat map of mean TSNARE1 expression in cell types in the brain. Astro, Astrocytes; endo, endothelial cells; micro, microglia; neuro, neurons; oligo, oligodendrocytes; OPC, oligodendrocyte progenitor cells. d, Heat map of TSNARE1 expression in excitatory and inhibitory neurons. Ex, Excitatory neurons; In, inhibitory neurons.
Figure 3.
Figure 3.
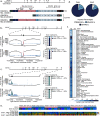
TSNARE1 is alternatively spliced, and the majority of transcripts encode a C-terminal non-TM domain. a, The gene model for TSNARE1 and the validated transcripts in adult human brain shown with exon inclusion and the predicted domains and nuclear localization signals (NLS) annotated above. b, c, Sashimi plot of RNA-sequencing data displaying exon coverage and the number of reads that link two exons from (b) exon 2 to either exon 3 or exon 5 or (c) exon 12 to exon 13 or exon 14. d, The imputed approximate percentages for each isoform calculated by combining the percentages determined in b and c. e, Heat map of the log2 intensity of the probe common to all TSNARE1 isoforms (CUST_1054_P1416573500) and those probes that are contained within exon 14 (CUST_1088_P1416379584, A_23_P319520). f, Heat map of the median read count per base for exons 13 and 14 from data adapted from GTEx.
Figure 4.
Figure 4.
The SNARE and Myb-like domains of tSNARE1 are conserved. a, b, phyloP scores computed from 100 vertebrate alignment per base of the (a) SNARE domain with the layers of interacting amino acids within the four-helical bundle marked (mean = 0.4 ± 0.1 SEM) and (b) the Myb-like domain with the predicted three helices boxed (mean = 0.3 ± 0.1 SEM). Comparison of phyloP scores between Myb-like and SNARE domain determined by two-tailed Student's t test (p = 0.374). c, The percent of individuals with sequencing coverage above 10× at each base (top) and CNV duplications and deletions (bottom) from the Exome Aggregation Consortium database. d, The minor allele frequency per base of each domain.
Figure 5.
Figure 5.
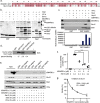
tSNARE1 competes with Stx12 to form SNARE complexes with Stx6, Vti1a, and VAMP4. a, Protein alignment of the SNARE domains of tSNARE1 and Stx12. b, SNARE assembly assays with various recombinant endosomal SNARE proteins. Different combinations of soluble SNARE proteins were mixed with GST-Vamp4 or control GST protein immobilized on beads. Following incubation, beads were washed and assembled complexes visualized by Coomassie staining following SDS-PAGE (see Materials and Methods). c, Assembled SNARE complexes were analyzed by immunoblot analysis using antibodies against specific soluble SNAREs as indicated. Quantitation of the Stx6 incorporation into SNARE complexes is shown below the immunoblot. This allows direct comparison of the ability of tSNARE1c and Stx12 to stimulate incorporation of Stx6 into 4 helical SNARE complexes. d, Assembly of endogenous Stx6 from mouse brain lysates into heterologous SNARE complexes with recombinant GST-tSNARE1c and GST-Stx12. e, Inhibition of endosomal SNARE complex assembly by tSNARE1c. Endosomal SNARE complex assembly was conducted (see Materials and Methods) in the presence or absence of tSNARE1c at indicated concentrations. f, Quantitation of the effect of tSNARE1 on Stx12 incorporation into the endosomal SNARE complex. 3 μm, p = 0.0002; 6 μm, p = 0.0002. p values were determined by two-tailed Student's t test. ***p < 0.0005. g, Determination of IC50 for tSNARE1 on Stx12 incorporation into endosomal SNARE complexes. GraphPad Prism was used to graphically determine IC50 values from inhibition data.
Figure 6.
Figure 6.
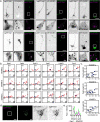
tSNARE1 localizes to markers of the endosomal network in cortical neurons. a, Example images of 2 DIV E15.5 murine cortical neurons expressing GFP-tSNARE1c and various red-tagged endosomal markers. For each group, reverse-contrast images of each channel are shown with a merged image to the right. A zoomed-in region of the soma marked by a white box in the merged image is shown below each group. Scale bars: 15 µm; zoom, 2.5 µm. b, Quantification of colocalization using peak height and correlation of GFP-tSNARE1 isoforms with each marker. The number (n) of (cells) is boxed on each individual distribution. At least three independent biological replicates were performed for each condition. c, Averages of individual distributions for each isoform as shown in b. d, A maximum intensity projection of a 15 DIV E18 rat cortical neuron expressing GFP-tSNARE1c and tagRFP-Rab7, shown in a zoomed-out image (left) with a zoomed-in ROI (right). Beside this are inverted contrast images of each channel from the merged images. Scale bars: left, 25 µm; zoomed images, 5 µm. e, Average 3 pixel-wide line scan of the fluorescence intensity of GFP-tSNARE1c and tagRFP-Rab7 in a single z plane (normalized to the minimum and maximum fluorescence intensity per channel) of the area indicated by the white dotted line in the zoomed merged image.
Figure 7.
Figure 7.
Endogenous tSNARE1 localizes to Rab7+ compartments in primary human neural progenitors and neuroblastoma cells. a, Maximum intensity projections of primary human NPCs immunostained for tSNARE1 (green) and Rab7 (magenta). b, Average 3 pixel-wide line scans of the fluorescence intensity of tSNARE1 and Rab7 in a single z plane (normalized to the minimum and maximum fluorescence intensity per channel) of the area denoted by the white dotted line in the zoomed merged image in each row in a. c, The percent of the volume of endogenous tSNARE1 that was colocalized with Rab7 in NPCs (n = 13 cells). d, Maximum intensity projections of human SH-SY5Y neuroblastoma cells immunostained for tSNARE1 (green) and Rab7 (magenta). e, Average 3 pixel-wide line scans of the fluorescence intensity of tSNARE1 and Rab7 in a single z plane (normalized to the minimum and maximum fluorescence intensity per channel) of the area denoted by the white dotted line shown in the zoomed merged image of each row in d. f, The percent of the volume of endogenous tSNARE1 that colocalized with Rab7 in SH-SY5Y neuroblastoma cells (n = 13 cells). For each row in a and c, there is a zoomed-out image (left) with a zoomed-in ROI (right). Beside this are inverted contrast images of each channel from the merged images. Scale bars: left column, 25 µm; zoomed images, 5 µm. Colocalization data are reported in a box-and-whiskers plot, with the minimum and maximum values as whiskers and the median and the 25th and 75th percentile as the box.
Figure 8.
Figure 8.
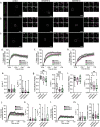
Overexpression of tSNARE1 delays trafficking of Nsg1 into late endosomal and lysosomal compartments. a-c, A representative single frame from each movie of a mouse cortical neuron at 2 DIV-expressing Nsg1-HaloTag (AlexaFluor-660 ligand) and (a) tagRFP-Rab5, (b) tagRFP-Rab7, or (c) LAMP1-mCherry, with or without the GFP-tSNARE1 isoforms listed. Scale bars: large, 10 µm; zoom montage, 2 µm. Time is in minutes. d, The percentage of Nsg1-HaloTag puncta colocalized with tagRFP-Rab5 over time. n = 22 (control), n = 21 (tSNARE1b), n = 21 (tSNARE1c). e, Nsg1-HaloTag entry into (kin) or exit out of (kout) tagRFP-Rab5+ compartments. kin p = 0.3710 (tSNARE1b), p = 0.3701 (tSNARE1c); kout p = 0.4922 (tSNARE1b), p = 0.3634 (tSNARE1c). f, The percentage of Nsg1-HaloTag puncta colocalized with tagRFP-Rab7 over time. n = 14 (control), n = 17 (tSNARE1b), n = 21 (tSNARE1c). g, The colocalization plateau and rate constant for Nsg1-HaloTag entry into tagRFP-Rab7+ compartments. Plateau p = 0.0291 (tSNARE1b), p = 0.0016 (tSNARE1c); k p = 0.0002 (tSNARE1b), p = 0.0004 (tSNARE1c). h, The percentage of Nsg1-HaloTag puncta colocalized with LAMP1-mCherry over time. n = 21 (control), n = 21 (tSNARE1b), n = 20 (tSNARE1c). i, The colocalization plateau and the rate constant for Nsg1-HaloTag entry into LAMP1-mCherry+ compartments. Plateau p = 0.1940 (tSNARE1b), p = 0.9960 (tSNARE1c); k p = 0.0192 (tSNARE1b), p = 0.0051 (tSNARE1c). j, The percentage of Nsg1-HaloTag puncta colocalized with tagRFP-Rab4 over time. n = 20 (control), n = 17 (tSNARE1b), n = 18 (tSNARE1c). k, Nsg1-HaloTag entry into (kin) or exit out of (kout) tagRFP-Rab4+ compartments. kin p = 0.2428 (tSNARE1b) and p = 0.3504 (tSNARE1c), kout p = 0.8819 (tSNARE1b) and p = 0.7632 (tSNARE1c). l, The percentage of Nsg1-HaloTag puncta colocalized with tagRFP-Rab11 over time. n = 19 (control), n = 19 (tSNARE1b), n = 18 (tSNARE1c). m, The colocalization plateau and rate constant for Nsg1-HaloTag entry into tagRFP-Rab11+ compartments. k p = 0.0871 (tSNARE1b), p = 0.9215 (tSNARE1c); plateau p = 0.7619 (tSNARE1b), p = 0.9890 (tSNARE1c). Data are reported by the curve fit (dark line, see Materials and Methods) of the mean percentage ± SEM (shaded area) at each time point. For the quantification of rates and colocalization plateaus, data are reported in a box-and-whiskers plot, with the minimum and maximum values as whiskers and the median and the 25th and 75th percentile as the box. *p < 0.05; **p < 0.005; ***p < 0.0005; one-way ANOVA. n refers to the number of cells examined.
Figure 9.
Figure 9.
tSNARE1 localizes to axons, dendrites, and the postsynapse. a, A reverse-contrast maximum intensity projection of human neurons differentiated from primary human NPCs immunostained for tSNARE1. Right, Enlarged black boxes represent ROIs. Scale bars: left, 25 µm; zoomed images, 5 µm. b, c, Maximum intensity projections of NPC-derived human neurons depicting endogenous tSNARE1 (green) and either (b) Tau (magenta), localization seen in n = 11 of 12 cells or (c) MAP2 (magenta), localization seen in n = 12 of 13 cells. Enlarged white rectangle represents ROI. Right, Reverse-contrast images of each channel. Magenta arrows point to areas positive for both tSNARE1 and the respective marker. Scale bars: left, 25 µm; zoomed images, 5 µm. d, Maximum intensity projection of GFP-tSNARE1c (green) and tagRFP-CAAX (magenta) in a 15 DIV E18 rat cortical neuron. Left, Merged image. Right, Separated reverse-contrast images of each channel. Scale bar, 25 µm. e, Maximum intensity projection of GFP-tSNARE1c (green) and PSD95IB-mRuby2 (magenta) in a dendritic arbor of a 22 DIV E18 rat cortical neuron. Right, Reverse-contrast images of each channel. Scale bar, 25 µm. We observed this localization in n = 8 of 8 cells. f, g, Zoomed maximum intensity projection of the ROIs denoted in e. For each, 3 pixel-wide average line scans of a single z plane are displayed for each region indicated by the dashed white lines in the merged image. Right, Reverse-contrast images of each channel. Scale bar, 5 µm.

Similar articles

Cited by

References

    1. Antonin W, Fasshauer D, Becker S, Jahn R, Schneider TR (2002) Crystal structure of the endosomal SNARE complex reveals common structural principles of all SNAREs. Nat Struct Biol 9:107–111. 10.1038/nsb746 - DOI - PubMed
    1. Barford K, Yap CC, Dwyer ND, Winckler B (2017) The related neuronal endosomal proteins NEEP21 (Nsg1) and P19 (Nsg2) have divergent expression profiles in vivo. J Comp Neurol 525:1861–1878. 10.1002/cne.24168 - DOI - PMC - PubMed
    1. Bennett MK, Calakos N, Scheller RH (1992) Syntaxin: a synaptic protein implicated in docking of synaptic vesicles at presynaptic active zones. Science 257:255–259. 10.1126/science.1321498 - DOI - PubMed
    1. Bradford MM (1976) A rapid and sensitive method for the quantitation of microgram quantities of protein utilizing the principle of protein-dye binding. Anal Biochem 72:248–254. 10.1006/abio.1976.9999 - DOI - PubMed
    1. Clary DO, Griff IC, Rothman JE (1990) SNAPs, a family of NSF attachment proteins involved in intracellular membrane fusion in animals and yeast. Cell 61:709–721. 10.1016/0092-8674(90)90482-t - DOI - PubMed

Publication types