. 2021 Oct;9(10):e002809.
doi: 10.1136/jitc-2021-002809.

Single-cell sequencing reveals antitumor characteristics of intratumoral immune cells in old mice

Affiliations

Single-cell sequencing reveals antitumor characteristics of intratumoral immune cells in old mice

Cangang Zhang et al. J Immunother Cancer. 2021 Oct.

Abstract

Background: Aging has long been thought to be a major risk factor for various types of cancers. However, accumulating evidence indicates increased resistance of old animals to tumor growth. An in-depth understanding of how old individuals defend against tumor invasion requires further investigations.

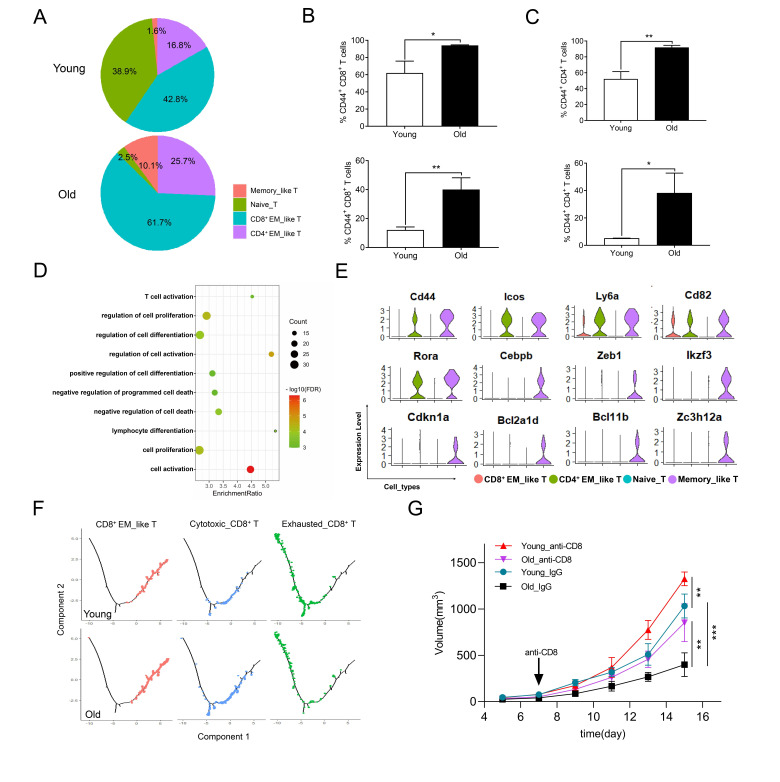
Methods: We revealed age-associated alterations in tumor-infiltrating immune cells between young and old mice using single-cell RNA and coupled T cell receptor (TCR) sequencing analysis. Multiple bioinformatics methods were adopted to analyze the characteristics of the transcriptome between two groups. To explore the impacts of young and old CD8+ T cells on tumor growth, mice were treated with anti-CD8 antibody every 3 days starting 7 days after tumor inoculation. Flow cytometry was used to validate the differences indicated by sequencing analysis between young and old mice.

Results: We found a higher proportion of cytotoxic CD8+ T cells, naturally occurring Tregs, conventional dendritic cell (DC), and M1-like macrophages in tumors of old mice compared with a higher percentage of exhausted CD8+ T cells, induced Tregs, plasmacytoid DC, and M2-like macrophages in young mice. Importantly, TCR diversity analysis showed that top 10 TCR clones consisted primarily of exhausted CD8+ T cells in young mice whereas top clones were predominantly cytotoxic CD8+ T cells in old mice. Old mice had more CD8+ T cells with a 'progenitor' and less 'terminally' exhausted phenotypes than young mice. Consistently, trajectory inference demonstrated that CD8+ T cells preferentially differentiated into cytotoxic cells in old mice in contrast to exhausted cells in young mice. Importantly, elimination of CD8+ T cells in old mice during tumor growth significantly accelerated tumor development. Moreover, senescent features were demonstrated in exhausted but not cytotoxic CD8+ T cells regardless of young and old mice.

Conclusions: Our data revealed that a significantly higher proportion of effector immune cells in old mice defends against tumor progression, providing insights into understanding the altered kinetics of cancer development and the differential response to immunotherapeutic modulation in elderly patients.

Keywords: CD8-positive T-lymphocytes; cellular; immunity; immunotherapy; lymphocytes; tumor microenvironment; tumor-infiltrating.


Conflict of interest statement

Competing interests: None declared.

Figures

Figure 1
Figure 1
Changes in immune cell composition of the TME during aging. (A) Tumor growth of B16 melanoma in young (n=6) and old (n=6) mouse models. Mice with the tumor size of length × width2/2 (mm2) were monitored. (B) Schematic diagram of the experimental design, scRNA-seq, data analysis, and validation. (C) Heatmap showing the relative expression (expression of normalized log2 (count +1)) of marker genes across different immune cell types. (D) tSNE projections of immune cells in tumors of young (upper) and old (below) mice. (E) The proportions of various immune cell types in tumors of young and old mice. cDC, conventional dendritic cells; NK, natural killing cells; pDC, plasmacytoid dendritic cells; scRNA-seq, single-cell RNA sequencing; TCR, T cell receptor; TME, tumor microenvironment; t-SNE, t-distributed stochastic neighbor embedding.
Figure 2
Figure 2
Myeloid cell composition of the TME in young and old mice. (A) Pie charts showing the proportions of four major myeloid cell types in tumors of young and old mice. (B) Heatmap showing the relative expression (expression of normalized log2 (count +1)) of top differentially expressed genes across different myeloid cell clusters. (C) UMAP projections of myeloid cell subpopulations in tumors of young (upper) and old (below) mice. (D) The proportions of various myeloid cell clusters in young and old mice. DC, dendritic cell; TME, tumor microenvironment; UMAP, uniform manifold approximation and projection.
Figure 3
Figure 3
Macrophage cell subtypes and their heterogeneity in tumors of young and old mice. (A) Violin plots comparing the relative expression of marker genes across various macrophage subsets. (B) Comparison of the proportions of five macrophage subsets in young and old mice. (C) Heatmap showing expression profiles of chemokines in different macrophage subsets. (D) Bubble plots showing the scores (represented by the color gradient) of different gene sets and proportions (represented by the size of bubble) of each macrophage cluster in young and old mice. The gene set score is calculated by averaging the z-scores of gene expression values of all genes in this gene set. The gene expression in A, C is represented as expression of normalized log2 (count +1)). MC1–MC5: five clusters of macrophages.
Figure 4
Figure 4
Dendritic cell (DC) and their heterogeneity in tumors of young and old mice. (A) Violin plots comparing the expression levels of representative marker genes among different DC subtypes. (B) Pie charts showing the proportions of four DC subtypes in tumors of young and old mice. (C) Violin plots comparing the gene expression among different DC subtypes. (D, E) Percentages of pDC (D) and cDC (E) in the tumor tissues of young and old groups (n=5). (F, G) Percentages of Lag3+ DC in the dLN (F) and tumor tissues (G) of young and old groups (n=3). (H) Bubble plots showing the scores (represented by the color gradient) of different gene sets and proportions (represented by the size of bubble) of each DC cluster in young and old mice. The gene set score was calculated by averaging the z-scores of gene expression values of all genes in this gene set. (I) Violin plots showing gene expression in MoDC in tumors of young and old mice. The gene expression in A, C and G is represented as expression of normalized log2 (count +1). cDC, conventional DC; MoDC, monocyte-derived DC; pDC, plasmacytoid DC. The level of significance is indicated as *P < 0.05, **P < 0.01.
Figure 5
Figure 5
T cell subtypes and their heterogeneity in tumors of young and old mice. (A) UMAP projections of T cells in tumors of young (left) and old (right) mice. (B, C) Expression of signature genes (B) and genes essential for T cell function (C) projected onto UMAP plots in (A). Color scale shows z-score transformation of log2 (count +1). (D) Bar graph showing the percentages of various T cell subtypes in the tumors of young and old mice. EM, effector memory; UMAP, uniform manifold approximation and projection.
Figure 6
Figure 6
Diversity of tumor-infiltrating CD8+ T lymphocytes and their functional states in young and old mice. (A) Pie charts showing the proportions of CD8+ T subtypes in young and old mice. (B) Percentages of PD-1+LAG3+ CD8+ T(left) and TIM3+LAG3+ CD8+ T(right) cells in tumor tissue of young (n=5) and old mice (n=5). (C) Percentages of IFN-γ+ CD8+ T(left) and GranzymeB+ CD8+ T(right) cells in tumor tissue of young (n=3) and old mice (n=3). (D) tSNE plots representing T-cell receptor (TCR) profiles of top 10 clonotypes in tumors of young (left) and old (right) mice. (E, F) Differentiation trajectory of CD8+ T cells reconstructed by monocle2 using scRNA-seq data. Color scale indicates either the ordering of cell in pseudotime (E) or the cell state (F). (G) Venn plots showing the number of shared TCR clones between exhausted CD8+ T and other CD8+ T cells in tumors of young and old mice. (H) Bar graph showing the percentages of TCR sequences shared by exhausted CD8+ T and other CD8+ T cells in young and old mice. (I) Violin plots comparing the gene expression among ‘progenitor’ exhausted CD8+ T and ‘terminally’ exhausted CD8+ T cells. (J) UMAP projections of ‘progenitor’ exhausted CD8+ T and ‘terminally’ exhausted CD8+ T cells in tumors of young (left) and old (right) mice. The icon indicates the cell proportion of the two groups. (K) Percentages of progenitor 1 exhausted CD8+ T (left) and progenitor 2 exhausted CD8+ T (right) cells in tumor tissue of young and old mice (n=5). (L) Percentages of intermediate exhausted CD8+ T (left) and “terminally” exhausted CD8+ T (right) cells in tumor tissue of young and old mice (n=5). The gene expression in I is represented as expression of normalized log2 (count +1). EM, effector memory; ns, not significant; PD-1, programmed cell death 1; scRNA-seq, single-cell RNA sequencing; UMAP, uniform manifold approximation and projection.
Figure 7
Figure 7
Characterization of tumor-infiltrating naive and memory like CD8+ T cells in young and old mice. (A) Pie charts showing the proportions of four T cells subtypes in young and old mice. (B, C) Percentages of CD8+ EM_like T(B) and CD4+ EM_like T (C) in the dLN (upper) and tumor tissues (below) of young and old. (D) Pathway enrichment result of top differential expressed genes in memory_like T cells. (E) Violin plots showing the gene expression in naive_T and different memory_like T cells. (F) Differentiation trajectory of CD8+ EM_like T cytotoxic_CD8+ T and exhausted_CD8+ T cells reconstructed by monocle2 using scRNA-seq data from young and old mice. Colors indicate the cell differentiation states. (G) Tumor volume in B16-bearing young and old mice with or without (IgG) anti-CD8 antibody treatment (n=5). EM, effector memory; scRNA-seq, single-cell RNA sequencing. The level of significance is indicated as *P < 0.05, **P < 0.01, ***P < 0.001.
Figure 8
Figure 8
The senescent phenotype of T cells in TME of young and old mice. (A) Bubble plots showing the cellular senescence scores (represented by the color gradient) of different gene sets and proportions (represented by the size of bubble) of each T cells cluster in young and old mice. (B) Violin plots showing senescent marker genes expression in T cells of young and old mice. (C) Bubble plots showing the oxidative stress induced senescence scores (represented by the color gradient) of different gene sets and proportions (represented by the size of bubble) of each T cells cluster in young and old mice. (D) Violin plots showing antioxidant genes expression in T cells of young and old mice. The gene set score was calculated by averaging the z-scores of gene expression values of all genes in this gene set. The gene expression in C and D is represented as expression of normalized log2 (count +1). EM, effector memory; TME, tumor microenvironment.

References

    1. Fane M, Weeraratna AT. How the ageing microenvironment influences tumour progression. Nat Rev Cancer 2020;20:89–106. 10.1038/s41568-019-0222-9 - DOI - PMC - PubMed
    1. Montecino-Rodriguez E, Berent-Maoz B, Dorshkind K. Causes, consequences, and reversal of immune system aging. J Clin Invest 2013;123:958–65. 10.1172/JCI64096 - DOI - PMC - PubMed
    1. Goronzy JJ, Weyand CM. Understanding immunosenescence to improve responses to vaccines. Nat Immunol 2013;14:428–36. 10.1038/ni.2588 - DOI - PMC - PubMed
    1. Shanmugham LN, Petrarca C, Frydas S, et al. . Il-15 an immunoregulatory and anti-cancer cytokine. recent advances. J Exp Clin Cancer Res 2006;25:529–36. - PubMed
    1. Ladomersky E, Zhai L, Lauing KL, et al. . Advanced age increases immunosuppression in the brain and decreases immunotherapeutic efficacy in subjects with glioblastoma. Clin Cancer Res 2020;26:5232–45. 10.1158/1078-0432.CCR-19-3874 - DOI - PMC - PubMed

Publication types