. 2021 Oct 19;118(42):e2103420118.
doi: 10.1073/pnas.2103420118.

The association of opening K-12 schools with the spread of COVID-19 in the United States: County-level panel data analysis

Affiliations

The association of opening K-12 schools with the spread of COVID-19 in the United States: County-level panel data analysis

Victor Chernozhukov et al. Proc Natl Acad Sci U S A. .

Abstract

This paper empirically examines how the opening of K-12 schools is associated with the spread of COVID-19 using county-level panel data in the United States. As preliminary evidence, our event-study analysis indicates that cases and deaths in counties with in-person or hybrid opening relative to those with remote opening substantially increased after the school opening date, especially for counties without any mask mandate for staff. Our main analysis uses a dynamic panel data model for case and death growth rates, where we control for dynamically evolving mitigation policies, past infection levels, and additive county-level and state-week "fixed" effects. This analysis shows that an increase in visits to both K-12 schools and colleges is associated with a subsequent increase in case and death growth rates. The estimates indicate that fully opening K-12 schools with in-person learning is associated with a 5 (SE = 2) percentage points increase in the growth rate of cases. We also find that the association of K-12 school visits or in-person school openings with case growth is stronger for counties that do not require staff to wear masks at schools. These findings support policies that promote masking and other precautionary measures at schools and giving vaccine priority to education workers.

Keywords: K–12 school openings; and remote; debiased estimator; foot traffic data; hybrid; in-person; mask-wearing requirements for staff.


Conflict of interest statement

The authors declare no competing interest.

Figures

Fig. 1
Fig. 1
The evolution of cases, deaths, and visits to K–12 schools and restaurants before and after the opening of K–12 schools. A and B plot the evolution of weekly cases or deaths per 1,000 persons averaged across counties within each group of counties classified by K–12 school teaching methods and mitigation strategy of mask requirements against the days since K–12 school opening. We classify counties that implement in-person teaching as their dominant teaching method into “in-person/yes-mask” and “in-person/no-mask” based on whether at least one school district requires staff to wear masks or not. Similarly, we classify counties that implement hybrid teaching into “hybrid/yes-mask” and “hybrid/no-mask” based on whether mask-wearing is required for staff. We classify counties that implement remote teaching as “Remote.” C and D plot the evolution of the 7-d average of per-device visits to K–12 schools and full-time workplaces, respectively, against the days since K–12 school opening using the same classification as in A and B.
Fig. 2
Fig. 2
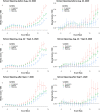
The event-study regression estimates before and after the school opening. Plots show the estimated coefficients for weekly dummies of leads and lags in regression specification 1 with 95% confidence intervals for three subsample periods.
Fig. 3
Fig. 3
The average treatment estimates obtained using the difference-in-differences (DID) method from Callaway and Sant’Anna [3]. A plots the estimates and 95% simultaneous confidence intervals of the average dynamic treatment effect of in-person openings relative to the counties with remote openings as well as the counties that have not opened yet on cases per 1,000 using a subset of counties with either in-person opening or remote opening, where we use the estimation method of ref. [3] implemented by their did R package. Similarly, B–D plot the estimates of the average dynamic treatment effect of school opening with hybrid, in-person/mask mandates and hybrid/mask mandates teaching methods, respectively, using a subset of counties with the corresponding teaching method as well as remote opening. EH, IL, MP, QT, and UX report the estimates of the average dynamic treatment effect on deaths per 1,000, log(cases), log(deaths), per-device visits to K–12 schools, and per-device visits to full-time workplaces, respectively.
Fig. 4
Fig. 4
The causal path diagram for our model.
Fig. 5
Fig. 5
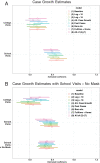
Sensitivity analysis for the estimated coefficients of K–12 visits and college visits of case growth regressions: debiased estimator. A presents the estimates of college visits and K–12 school visits with the 90% confidence intervals across different specifications taking Table 2, column 1 as baseline. B presents the estimates of college visits, K–12 school visits, and the interaction between K–12 school visits and no mask-wearing requirement for staff taking Table 2, column 2 as baseline. The results are based on the debiased estimator. SI Appendix, Fig. S8 presents the results based on the estimator without bias correction.
Fig. 6
Fig. 6
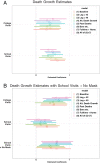
Sensitivity analysis for the estimated coefficients of K–12 visits and college visits of death growth regressions: debiased estimator. A presents the estimates of college visits and K–12 school visits with the 90% confidence intervals across different specifications taking SI Appendix, Table S9, column 1 as baseline. B presents the estimates of college visits, K–12 school visits, and the interaction between K–12 school visits and no mask-wearing requirement for staff taking SI Appendix, Table S9, column 2 as baseline.

References

    1. New York Times, Github Repository. https://raw.githubusercontent.com/nytimes/covid-19-data/master/us-counti.... Deposited 2 February 2021.
    1. MCH Strategic Data, COVID-19 IMPACT: School District Operation Status, https://www.mchdata.com/covid19/schoolclosings. Accessed 28 January 2021.
    1. Callaway B., Sant’Anna P. H., Difference -in-differences with multiple time periods. J. Econom. (2020), in press.
    1. Goodman-Bacon A., Difference-in-Differences with Variation in Treatment Timing, (NBER Working Papers 25018, National Bureau of Economic Research, 2018), 10.3386/w25018. - DOI
    1. Sun L., Abraham S., Estimating dynamic treatment effects in event studies with heterogeneous treatment effects. J. Econom. (2020), in press.