. 2021 Oct 19;118(42):e2106294118.
doi: 10.1073/pnas.2106294118.

Synapse development is regulated by microglial THIK-1 K+ channels

Affiliations

Synapse development is regulated by microglial THIK-1 K+ channels

Pablo Izquierdo et al. Proc Natl Acad Sci U S A. .

Abstract

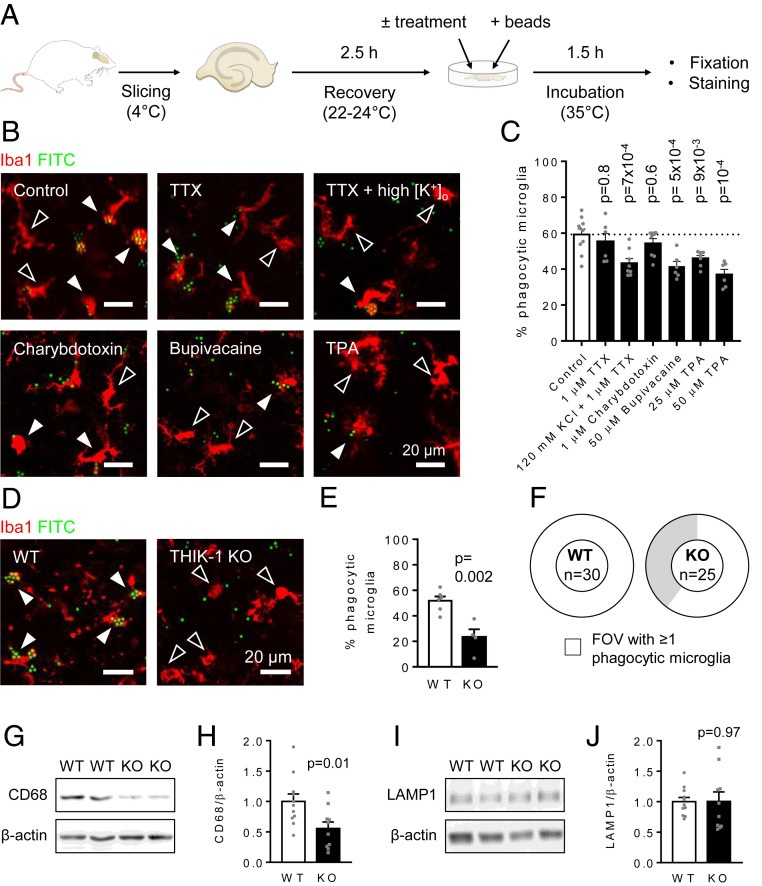
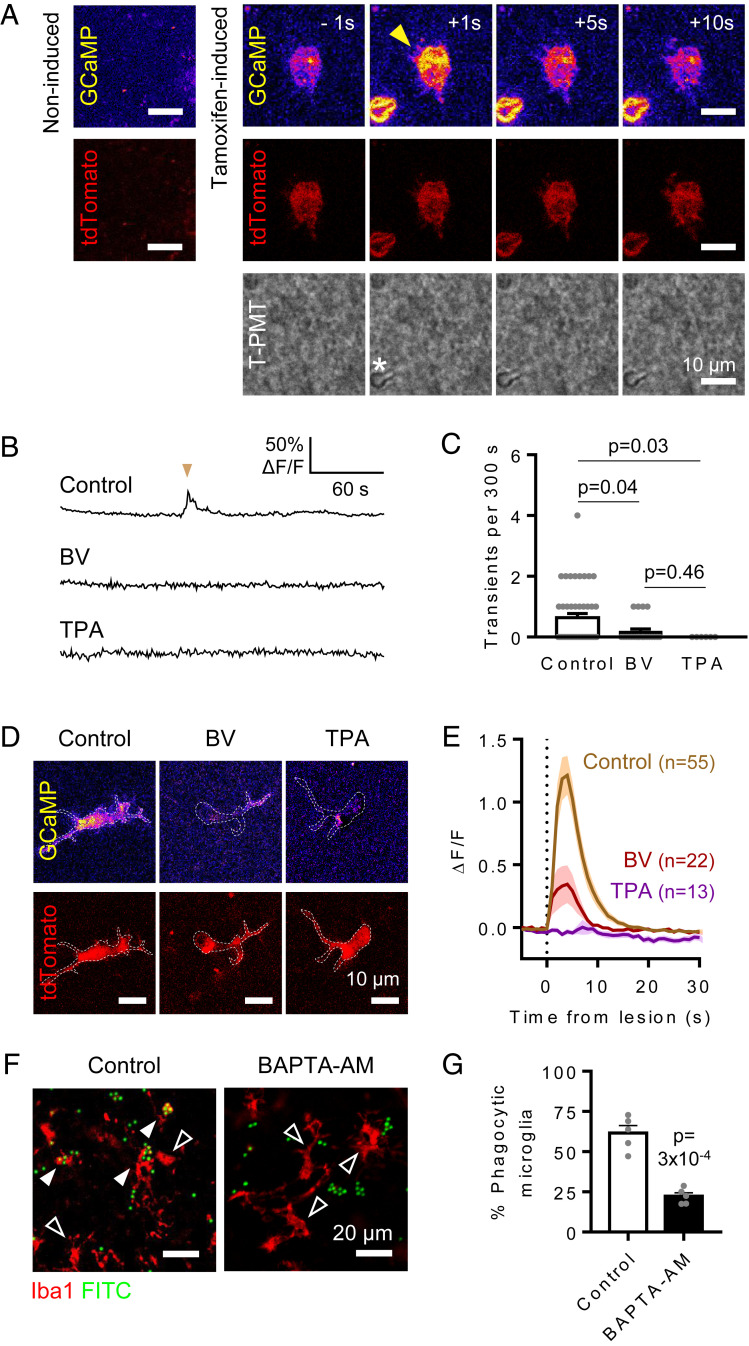
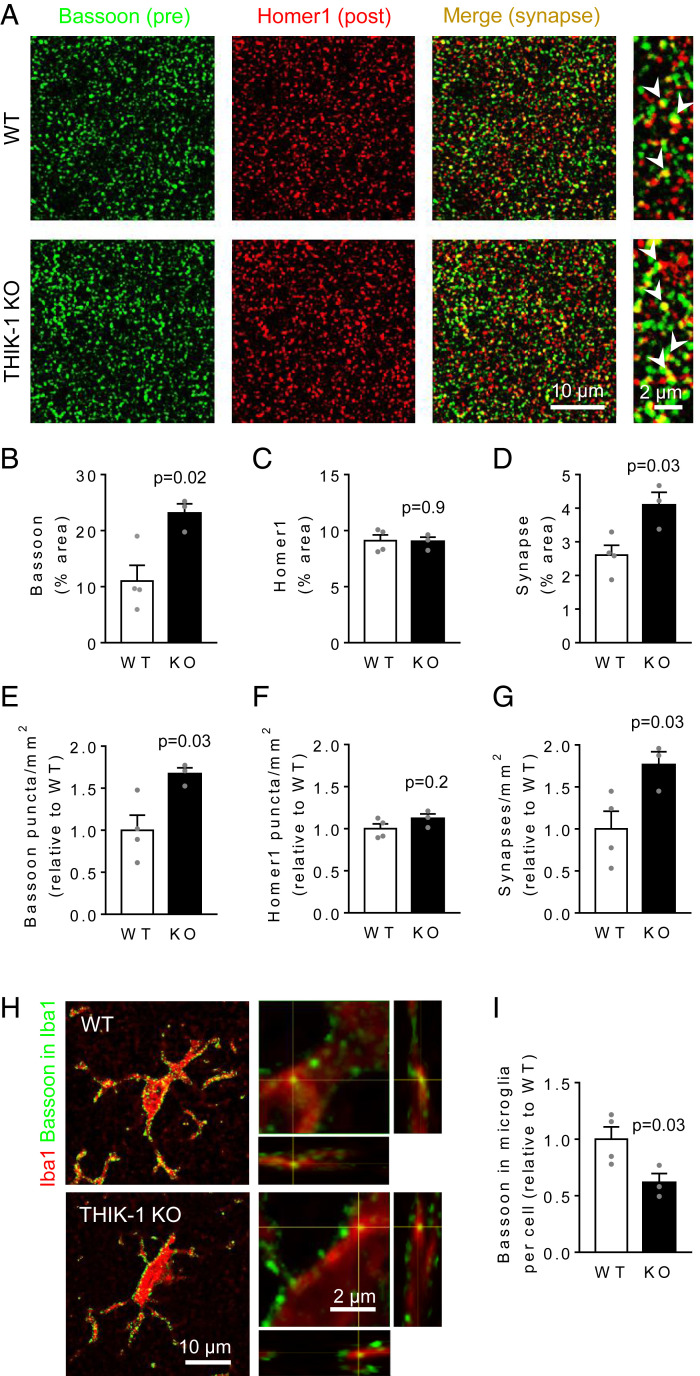
Microglia are the resident immune cells of the central nervous system. They constantly survey the brain parenchyma for redundant synapses, debris, or dying cells, which they remove through phagocytosis. Microglial ramification, motility, and cytokine release are regulated by tonically active THIK-1 K+ channels on the microglial plasma membrane. Here, we examined whether these channels also play a role in phagocytosis. Using pharmacological blockers and THIK-1 knockout (KO) mice, we found that a lack of THIK-1 activity approximately halved both microglial phagocytosis and marker levels for the lysosomes that degrade phagocytically removed material. These changes may reflect a decrease of intracellular [Ca2+]i activity, which was observed when THIK-1 activity was reduced, since buffering [Ca2+]i reduced phagocytosis. Less phagocytosis is expected to result in impaired pruning of synapses. In the hippocampus, mice lacking THIK-1 expression had an increased number of anatomically and electrophysiologically defined glutamatergic synapses during development. This resulted from an increased number of presynaptic terminals, caused by impaired removal by THIK-1 KO microglia. The dependence of synapse number on THIK-1 K+ channels, which control microglial surveillance and phagocytic ability, implies that changes in the THIK-1 expression level in disease states may contribute to altering neural circuit function.

Keywords: microglia; phagocytosis; synaptic pruning.


Conflict of interest statement

The authors declare no competing interest.

Figures

Fig. 1.
Fig. 1.
THIK-1 channels regulate microglial phagocytosis. (A) Diagram of the phagocytosis assay. (B) Representative single-plane images of microglia (Iba1, red) in acute hippocampal rat slices incubated with 3-µm microbeads (FITC, green), either untreated (control) or treated with 1 µM TTX, 1 µM TTX + 120 mM KCl (high [K+]o), 1 µM charybdotoxin, 50 µM bupivacaine, or 50 µM TPA. Black arrowheads indicate nonphagocytic cells, and white arrowheads indicate phagocytic cells. Some microbeads remain outside microglia. (C) Percentage of microglia that phagocytosed microbeads in each condition, showing a reduction by high [K+]o and two-pore K+ channel block (bupivacaine, TPA) but not by calcium-activated K+ channel block (charybdotoxin) (control: n = 26 slices from 10 animals; TTX: nine slices from six animals; TTX + 120 mM KCl: 15 slices from eight animals; charybdotoxin: 14 slices from eight animals; bupivacaine: nine slices from six animals; 25 µM TPA: 19 slices from six animals; 50 µM TPA: 15 slices from five animals; and animals were used as the statistical unit). P values compare with control and are corrected for multiple comparisons. (D) Representative single-plane images of microglia in acute hippocampal slices from WT and THIK-1 KO mice incubated with 3-µm microbeads. (E) Percentage of microglia that phagocytosed microbeads in each genotype, showing a reduction in the KO. (F) Doughnut charts showing that only 60% of the analyzed fields of view (FOV) contained phagocytic microglia in the KO, while all did in the WT. The number of total microglia per FOV was not different (WT: 15.0 ± 1.8, KO: 12.3 ± 2.1; and P = 0.34) between genotypes. (G) Western blot for the microglial lysosomal marker CD68 in radioimmunoprecipitation assay–soluble homogenates from hippocampi of P17 WT or THIK-1 KO mice (β-actin was loading control). (H) Densitometric quantification showing THIK-1 KO reduces CD68 level (WT: n = 11 animals; KO: n = 10 animals). (I and J) As in G and H but for the broadly expressed lysosomal marker LAMP1.
Fig. 2.
Fig. 2.
Two-pore domain K+ channels regulate Ca2+ activity in microglia. (A) Tamoxifen-induced microglia from Cx3cr1CreER × GCaMP5g-IRES-tdTomato mice expressed the calcium reporter GCaMP5g (yellow) and tdTomato (red), which were not detected in brain slices from noninduced animals (Left). Acute laser lesion (star in the transmitted light channel, T-PMT) evokes a rapid [Ca2+]I rise in tdTomato-labeled microglia (yellow arrowhead). Times indicate seconds from laser ablation. (B and C) Spontaneous Ca2+ transients in GCaMP5g-expressing microglia occur less often in cells treated with 50 µM bupivacaine (BV) or 50 µM TPA compared to control cells, as shown by the representative traces for GCaMP fluorescence changes (ΔF/F) (B) and transient rates over 5 min (C). (D) Representative microglial cells incubated in the absence (control) or presence of 50 µM BV or 50 µM TPA (ΔF/F for GCaMP5g shown at peak). (E) [Ca2+]i levels over time showing increase upon laser lesion (vertical dashed line). TPA (n = 13 from 3 mice; P = 10−4) and BV (n = 22 cells from 4 mice; P = 3 × 10⁻³) significantly reduced the lesion-induced [Ca2+]i rise compared to control (n = 56 from eight mice). No significant difference was found between BV and TPA (P = 0.2). (F) Representative single-plane images of microglia (Iba1, red) in acute hippocampal rat slices incubated with 3-µm microbeads (FITC, green) in the absence (control) or presence of 50 µM BAPTA-AM to chelate intracellular calcium. Black arrowheads indicate nonphagocytic cells, and white arrowheads indicate phagocytic cells. (G) Percentage of microglia that phagocytosed microbeads in each condition, showing a significant reduction by BAPTA-AM (eight slices from five animals per condition; animals were used as the statistical unit).
Fig. 3.
Fig. 3.
Microglial phagocytosis of presynaptic material is reduced by THIK-1 KO. (A) Representative confocal images from the CA1 stratum radiatum of WT or THIK-1 KO mice at P17 to P19, showing the presynaptic marker Bassoon (green) and the excitatory postsynaptic marker Homer1 (red). The merged image and expanded views on the right show colocalized puncta (yellow). (BD) Quantification of the area covered by (B) Bassoon, (C) Homer1, and (D) colocalized puncta, showing an increased fraction of the imaged area labeled for synapses in KO mice. (EG) Quantification of the numbers of (E) Bassoon, (F) Homer, and (G) synaptic puncta per square millimeter, showing increased numbers of presynaptic puncta and synapses in KO mice. Average numbers in WT mice were 53 puncta/100 µm2 for Bassoon, 42 puncta/100 µm2 for Homer1, and 26 synapses/100 µm2. (For BG, WT: n = 4 animals; KO: n=3 animals; and three confocal stacks from five brain slices averaged per animal.) (H) Representative confocal images showing Bassoon puncta (green) located within microglia (Iba1, red). On the right, close-up of microglial processes with orthogonal projections at the level of the crosshairs showing Bassoon puncta within microglia. (I) Quantification of the area of Bassoon puncta colocalizing with each microglial cell, showing a decrease in KO microglia (WT: 20 cells from four animals; KO: 15 cells from three animals; and animals were used as the statistical unit).
Fig. 4.
Fig. 4.
THIK-1 KO increases excitatory synaptic transmission. (A) Representative current traces from whole-cell voltage-clamped CA1 pyramidal neurons (Vh = −65 mV, ECl = −62mV) in WT (black, left) and THIK-1 KO (gray, right) hippocampal slices. The top two rows show spontaneous EPSCs (sEPSCs) (i.e., including both miniature EPSCs [mEPSCs] and those evoked by spontaneous action potentials). The bottom two rows show mEPSCs in 500 nM TTX. The second and fourth row traces expand the indicated areas in the first and third rows. (B and C) Bar graphs showing sEPSC (B) frequency and (C) amplitude, comparing WT and THIK-1 KO. Overlaid gray circles show raw values in individual cells. Numbers on bars are of cells/animals, and SEM values use cells as the statistical unit. (D and E) As for C and D but showing mEPSC (D) frequency and (E) amplitude, comparing WT and THIK-1 KO in 500 nM TTX. (F) Representative traces of whole-cell currents (Vh = −40 mV, ECl = −62 mV) from WT (black) and THIK-1 KO (red) hippocampal CA1 pyramidal cells and bar graph of mean current induced by 10 µM NMDA bath application to WT and THIK-1 KO cells. (G) As for F but applying 1 µM kainic acid.

References

    1. Lawson L. J., Perry V. H., Dri P., Gordon S., Heterogeneity in the distribution and morphology of microglia in the normal adult mouse brain. Neuroscience 39, 151–170 (1990). - PubMed
    1. Izquierdo P., Attwell D., Madry C., Ion channels and receptors as determinants of microglial function. Trends Neurosci. 42, 278–292 (2019). - PubMed
    1. Madry C., et al. ., Microglial ramification, surveillance, and interleukin-1β release are regulated by the two-pore domain K+ channel THIK-1. Neuron 97, 299–312.e6 (2018). - PMC - PubMed
    1. Brown G. C., Neher J. J., Microglial phagocytosis of live neurons. Nat. Rev. Neurosci. 15, 209–216 (2014). - PubMed
    1. Hughes A. N., Appel B., Microglia phagocytose myelin sheaths to modify developmental myelination. Nat. Neurosci. 23, 1055–1066 (2020). - PMC - PubMed

Publication types