Comparative Study
. 2021 Oct 12;12(10):935.
doi: 10.1038/s41419-021-04223-4.

Genomic comparison between cerebrospinal fluid and primary tumor revealed the genetic events associated with brain metastasis in lung adenocarcinoma

Affiliations
Comparative Study

Genomic comparison between cerebrospinal fluid and primary tumor revealed the genetic events associated with brain metastasis in lung adenocarcinoma

Zhiyong Deng et al. Cell Death Dis. .

Abstract

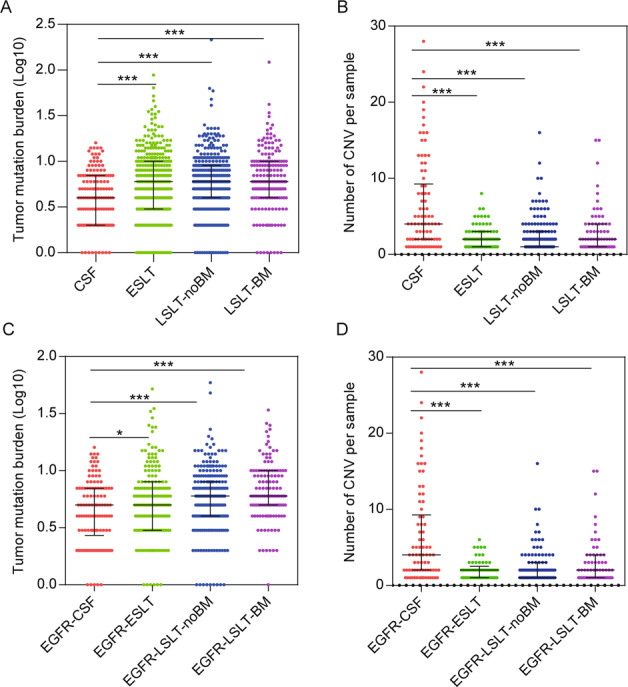
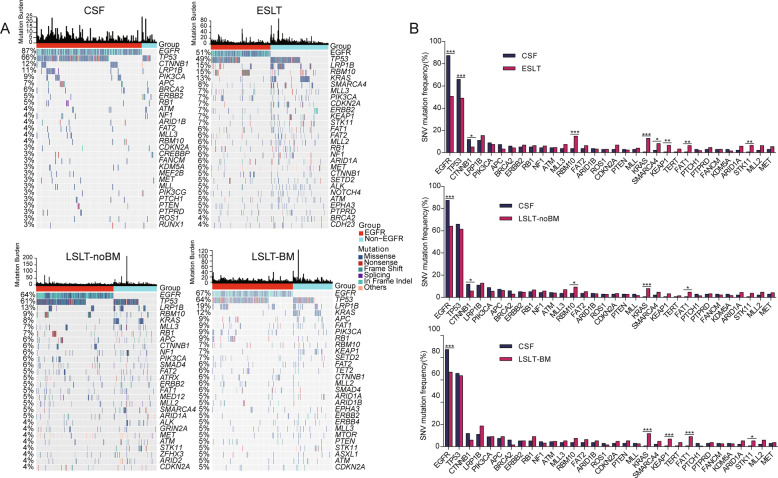
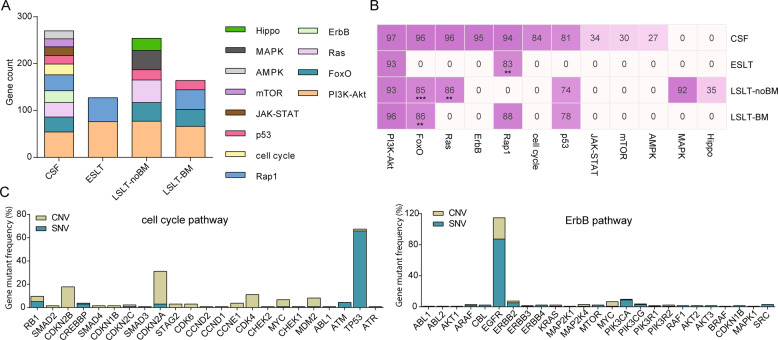
Lung adenocarcinoma (LUAD) is most common pathological type of lung cancer. LUAD with brain metastases (BMs) usually have poor prognosis. To identify the potential genetic factors associated with BM, a genomic comparison for BM cerebrospinal fluid (CSF) and primary lung tumor samples obtained from 1082 early- and late-stage LUAD patients was performed. We found that single nucleotide variation (SNV) of EGFR was highly enriched in CSF (87% of samples). Compared with the other primary lung tissues, copy number gain of EGFR (27%), CDK4 (11%), PMS2 (11%), MET (10%), IL7R (8%), RICTOR (7%), FLT4 (5%), and FGFR4 (4%), and copy number loss of CDKN2A (28%) and CDKN2B (18%) were remarkably more frequent in CSF samples. CSF had significantly lower tumor mutation burden (TMB) level but more abundant copy number variant. It was also found that the relationships among co-occurrent and mutually exclusive genes were dynamically changing with LUAD development. Additionally, CSF (97% of samples) harbored more abundant targeted drugs related driver and fusion genes. The signature 15 associated with defective DNA mismatch repair (dMMR) was only identified in the CSF group. Cancer associated pathway analysis further revealed that ErbB (95%) and cell cycle (84%) were unique pathways in CSF samples. The tumor evolution analysis showed that CSF carried significantly fewer clusters, but subclonal proportion of EGFR was remarkably increased with tumor progression. Collectively, CSF sequencing showed unique genomic characteristics and the intense copy number instability associated with cell cycle disorder and dMMR might be the crucial genetic factors in BM of LUAD.


Conflict of interest statement

The authors declare no competing interests.

Figures

Fig. 1
Fig. 1. Summary of TMB and CNV count differences across the CSF and other primary lung tissue samples.
A, B Show the difference of TMB and CNV between CSF and ESLT, LSLT-noBM, LSLT-BM groups, respectively. C, D Show the difference of TMB and CNV in EGFR-CSF and EGFR-ESLT, EGFR-LSLT-noBM, EGFR-LSLT-BM subgroups, respectively. Statistical analysis was performed using the Mann–Whitney test. *P < 0.05, ***P < 0.001.
Fig. 2
Fig. 2. SNVs analysis of LUAD patients at different stages.
A Driver gene mutation profiles of the CSF, ESLT, LSLT-noBM, and LSLT-BM groups. Mutation frequencies in the group are shown on the left. Mutation burden (number of mutations per Mb) for each patient is shown at the top. B Comparison of mutation frequencies of driver genes between CSF and the other three groups, respectively. Significant differences of genes were calculated by two-sided Fisher’s exact test. *P < 0.05, **P < 0.01, ***P < 0.001.
Fig. 3
Fig. 3. Mutational relationships and processes based on CSF and primary lung tumors.
A Co-occurrence and mutually exclusivity analyses of somatic mutation genes in CSF and lung tissue. Fisher’s exact test was used to identify remarkable interactions. *P < 0.05. B The somatic mutation signature analysis. From left to right: the mutation distribution profile of tumor samples and the vertical axis represents the number of mutations for each triple nucleotide type, proportion of total somatic substitutions in four groups contributed by each of the operative mutational signatures, the heatmap distribution of signatures in all samples.
Fig. 4
Fig. 4. CNVs analysis of LUAD patients at different stages.
A High frequently mutated genes in CSF and primary lung tumors are shown. Mutation frequencies in the group are shown on the left. CNV counts (number of CNV events) for each patient is shown at the top. B Comparison of mutation frequencies of CNV genes between CSF and the other three groups, respectively. Significantly different genes were calculated by two-sided Fisher’s exact test. *P < 0.05, **P < 0.01, ***P < 0.001.
Fig. 5
Fig. 5. Pathway differences between CSF and primary lesions.
A Remarkable enrichment of KEGG pathways in each group according to FDR < 0.1. The vertical axis indicates gene count. Gene count means the number of mutated genes enriched in one term. B Heatmap of alteration frequency of identified pathways. The horizontal axis represents signal pathways, and the figures indicate mutation percentages. Differences with significant P values are labeled (two-sided Fisher’s exact test). **P < 0.01, ***P < 0.001. C Gene alterations (including SNV and CNV) of highly frequent and unique pathways in CSF samples. The vertical axis shows gene mutation frequency.
Fig. 6
Fig. 6. Genotyping profiles of the targeted drugs related diver genes.
The mutation landscape of several actionable driver alterations and gene rearrangements in lung cancer is shown at the top. Pie charts at the bottom indicate the proportion of these druggable genes.
Fig. 7
Fig. 7. Clonal and subclonal mutations in CSF and primary lung tumors.
AC Comparison of total clonal mutations burden (including clonal and subclonal), clonal mutation burden, and subclonal mutation burden in all somatic genes for CSF and the other three groups. Clonal mutations burden means the number of mutation clusters in each sample. Differences with significant P values are labeled (Mann–Whitney test). **P < 0.01, ***P < 0.001. D The clonal and subclonal proportion of EGFR and EGFR genotyping (L858R, T790M, and 19del) in CSF and primary lung tissue. The differences of these clonal distribution were estimated by two-sided Fisher’s exact test. *P < 0.05, **P < 0.01, ***P < 0.001.

References

    1. Skřičková J, Kadlec B, Venclíček O, Merta Z. Lung cancer. Cas Lek Ceskych. 2018;157:226–36. - PubMed
    1. Patel RR, Mehta MP. Targeted therapy for brain metastases: improving the therapeutic ratio. Clin Cancer Res. 2007;13:1675–83. doi: 10.1158/1078-0432.CCR-06-2489. - DOI - PubMed
    1. Achrol AS, Rennert RC, Anders C, Soffietti R, Ahluwalia MS, Nayak L, et al. Brain metastases. Nat Rev Dis Prim. 2019;5:5. doi: 10.1038/s41572-018-0055-y. - DOI - PubMed
    1. Shih DJH, Nayyar N, Bihun I, Dagogo-Jack I, Gill CM, Aquilanti E, et al. Genomic characterization of human brain metastases identifies drivers of metastatic lung adenocarcinoma. Nat Genet. 2020;52:371–7. doi: 10.1038/s41588-020-0592-7. - DOI - PMC - PubMed
    1. Consonni D, Pierobon M, Gail MH, Rubagotti M, Rotunno M, Goldstein A, et al. Lung cancer prognosis before and after recurrence in a population-based setting. J Natl Cancer Inst. 2015;107:djv059. doi: 10.1093/jnci/djv059. - DOI - PMC - PubMed

Publication types

MeSH terms