

One year of modeling and forecasting COVID-19 transmission to support policymakers in Connecticut
- PMID: 34642405
- PMCID: PMC8511264
- DOI: 10.1038/s41598-021-99590-5
One year of modeling and forecasting COVID-19 transmission to support policymakers in Connecticut
Abstract
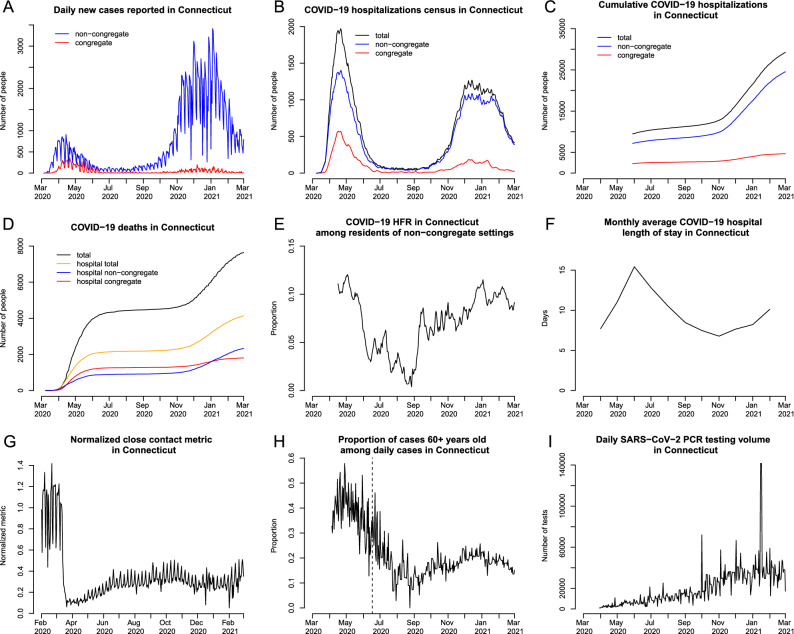
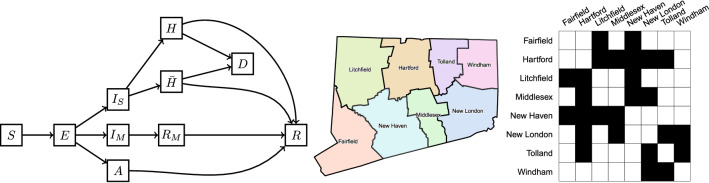
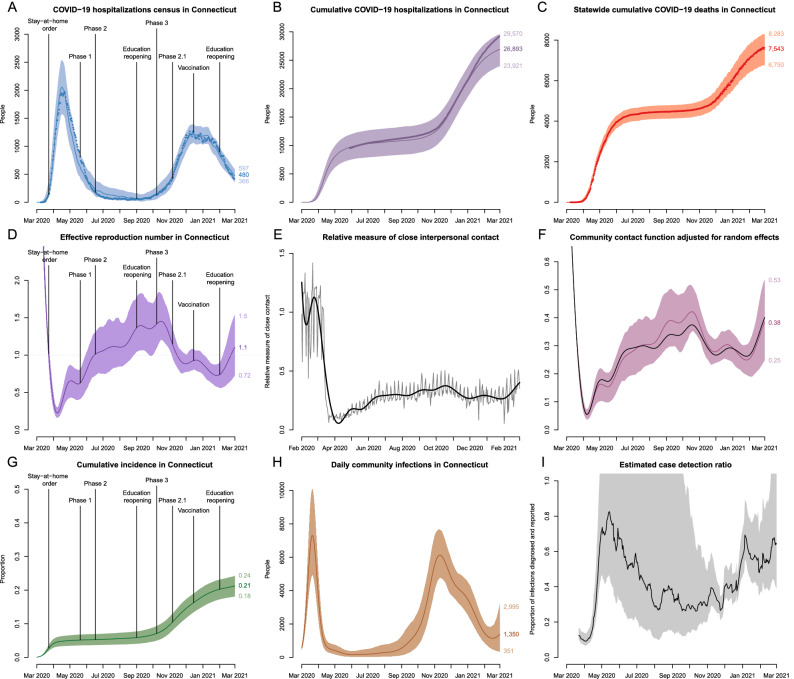
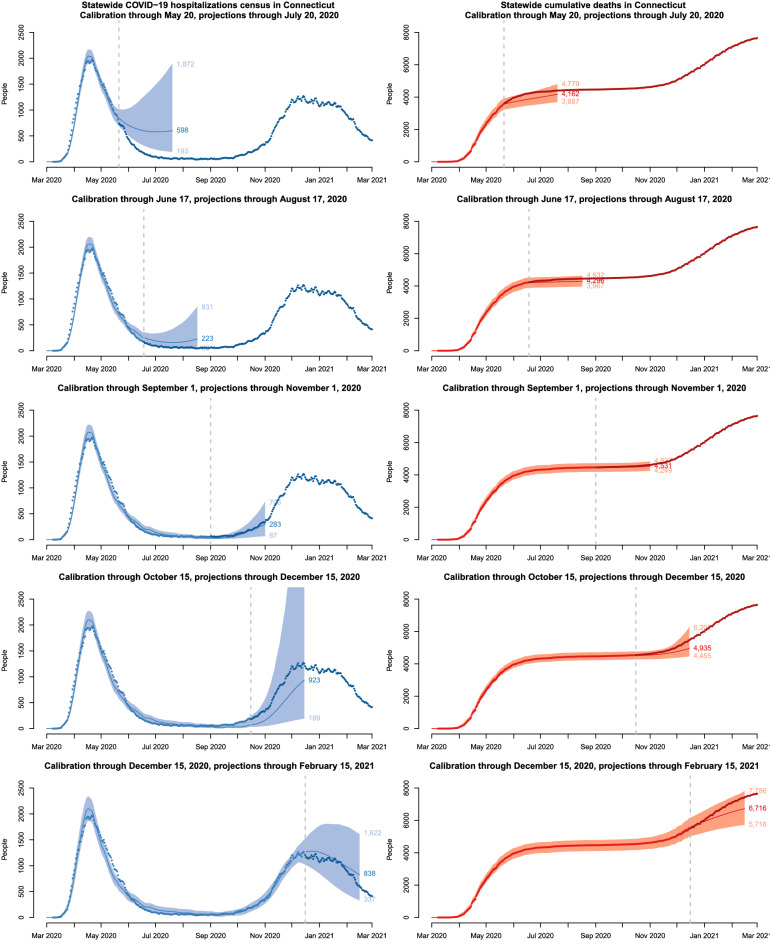
To support public health policymakers in Connecticut, we developed a flexible county-structured compartmental SEIR-type model of SARS-CoV-2 transmission and COVID-19 disease progression. Our goals were to provide projections of infections, hospitalizations, and deaths, and estimates of important features of disease transmission and clinical progression. In this paper, we outline the model design, implementation and calibration, and describe how projections and estimates were used to meet the changing requirements of policymakers and officials in Connecticut from March 2020 to February 2021. The approach takes advantage of our unique access to Connecticut public health surveillance and hospital data and our direct connection to state officials and policymakers. We calibrated this model to data on deaths and hospitalizations and developed a novel measure of close interpersonal contact frequency to capture changes in transmission risk over time and used multiple local data sources to infer dynamics of time-varying model inputs. Estimated epidemiologic features of the COVID-19 epidemic in Connecticut include the effective reproduction number, cumulative incidence of infection, infection hospitalization and fatality ratios, and the case detection ratio. We conclude with a discussion of the limitations inherent in predicting uncertain epidemic trajectories and lessons learned from one year of providing COVID-19 projections in Connecticut.
© 2021. The Author(s).
Conflict of interest statement
FWC is a paid consultant to Whitespace LTD. OM and ZRL declare no potential conflict of interest.
Figures
Update of
-
One year of modeling and forecasting COVID-19 transmission to support policymakers in Connecticut.medRxiv [Preprint]. 2021 Apr 23:2020.06.12.20126391. doi: 10.1101/2020.06.12.20126391. medRxiv. 2021. Update in: Sci Rep. 2021 Oct 12;11(1):20271. doi: 10.1038/s41598-021-99590-5. PMID: 32587978 Free PMC article. Updated. Preprint.
Similar articles
-
One year of modeling and forecasting COVID-19 transmission to support policymakers in Connecticut.medRxiv [Preprint]. 2021 Apr 23:2020.06.12.20126391. doi: 10.1101/2020.06.12.20126391. medRxiv. 2021. Update in: Sci Rep. 2021 Oct 12;11(1):20271. doi: 10.1038/s41598-021-99590-5. PMID: 32587978 Free PMC article. Updated. Preprint.
-
SARS-CoV-2 Infection Hospitalization Rate and Infection Fatality Rate Among the Non-Congregate Population in Connecticut.Am J Med. 2021 Jun;134(6):812-816.e2. doi: 10.1016/j.amjmed.2021.01.020. Epub 2021 Feb 20. Am J Med. 2021. PMID: 33617808 Free PMC article.
-
A comparison of five epidemiological models for transmission of SARS-CoV-2 in India.BMC Infect Dis. 2021 Jun 7;21(1):533. doi: 10.1186/s12879-021-06077-9. BMC Infect Dis. 2021. PMID: 34098885 Free PMC article.
-
Iterative data-driven forecasting of the transmission and management of SARS-CoV-2/COVID-19 using social interventions at the county-level.Sci Rep. 2022 Jan 18;12(1):890. doi: 10.1038/s41598-022-04899-4. Sci Rep. 2022. PMID: 35042958 Free PMC article.
-
Ten Epidemiological Parameters of COVID-19: Use of Rapid Literature Review to Inform Predictive Models During the Pandemic.Front Public Health. 2020 Dec 1;8:598547. doi: 10.3389/fpubh.2020.598547. eCollection 2020. Front Public Health. 2020. PMID: 33335879 Free PMC article.
Cited by
-
Real-time estimation and forecasting of COVID-19 cases and hospitalizations in Wisconsin HERC regions for public health decision making processes.BMC Public Health. 2023 Feb 17;23(1):359. doi: 10.1186/s12889-023-15160-6. BMC Public Health. 2023. PMID: 36803324 Free PMC article.
-
Scaling SARS-CoV-2 wastewater concentrations to population estimates of infection.Sci Rep. 2022 Mar 3;12(1):3487. doi: 10.1038/s41598-022-07523-7. Sci Rep. 2022. PMID: 35241744 Free PMC article.
-
Impact of close interpersonal contact on COVID-19 incidence: Evidence from 1 year of mobile device data.Sci Adv. 2022 Jan 7;8(1):eabi5499. doi: 10.1126/sciadv.abi5499. Epub 2022 Jan 7. Sci Adv. 2022. PMID: 34995121 Free PMC article.
-
Wastewater surveillance provides 10-days forecasting of COVID-19 hospitalizations superior to cases and test positivity: A prediction study.Infect Dis Model. 2023 Oct 31;8(4):1138-1150. doi: 10.1016/j.idm.2023.10.004. eCollection 2023 Dec. Infect Dis Model. 2023. PMID: 38023490 Free PMC article.
-
SARS-CoV-2 Attack Rate and Population Immunity in Southern New England, March 2020 to May 2021.JAMA Netw Open. 2022 May 2;5(5):e2214171. doi: 10.1001/jamanetworkopen.2022.14171. JAMA Netw Open. 2022. PMID: 35616938 Free PMC article.
References
-
- Ferguson, N. M. et al. Report 9: Impact of non-pharmaceutical interventions (NPIs) to reduce COVID-19 mortality and healthcare demand (2020). https://www.imperial.ac.uk/media/imperial-college/medicine/sph/ide/gida-.... - PMC - PubMed
-
- Adam, D. Special report: The simulations driving the world’s response to COVID-19. Nature580, 316 (2020). - PubMed
-
- Centers for Disease Control and Prevention. COVID-19 Mathematical Modeling. https://www.cdc.gov/coronavirus/2019-ncov/covid-data/mathematical-modeli... (2020).
Publication types
MeSH terms
Grants and funding
LinkOut - more resources
Full Text Sources
Medical
Miscellaneous
